annual report 2010-11 - Metro Tasmania
annual report 2010-11 - Metro Tasmania
annual report 2010-11 - Metro Tasmania

Create successful ePaper yourself
Turn your PDF publications into a flip-book with our unique Google optimized e-Paper software.
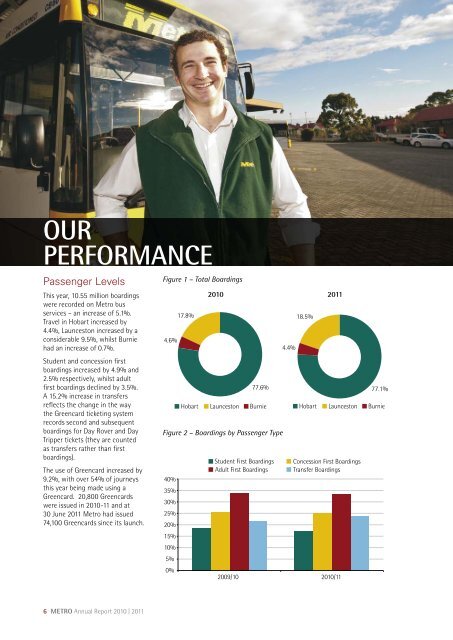
OURPERFORMANCEPassenger LevelsThis year, 10.55 million boardingswere recorded on <strong>Metro</strong> busservices – an increase of 5.1%.Travel in Hobart increased by4.4%, Launceston increased by aconsiderable 9.5%, whilst Burniehad an increase of 0.7%.Student and concession firstboardings increased by 4.9% and2.5% respectively, whilst adultfirst boardings declined by 3.5%.A 15.2% increase in transfersreflects the change in the waythe Greencard ticketing systemrecords second and subsequentboardings for Day Rover and DayTripper tickets (they are countedas transfers rather than firstboardings).The use of Greencard increased by9.2%, with over 54% of journeysthis year being made using aGreencard. 20,800 Greencardswere issued in <strong>2010</strong>-<strong>11</strong> and at30 June 20<strong>11</strong> <strong>Metro</strong> had issued74,100 Greencards since its launch.Figure 1 – Total Boardings17.8% 17.8%4.6% 4.6%77.6% 77.6%Hobart Hobart Launceston Launceston Burnie BurnieFigure 2 – Boardings by Passenger Type40%35%30%25%20%15%10%5%0%<strong>2010</strong> 20<strong>11</strong>Student First BoardingsAdult First Boardings18.5% 18.5%4.4% 4.4%2009/10 <strong>2010</strong>/<strong>11</strong>77.1% 77.1%Hobart Hobart Launceston Launceston Burnie BurnieConcession First BoardingsTransfer Boardings6 METRO Annual Report <strong>2010</strong> | 20<strong>11</strong>