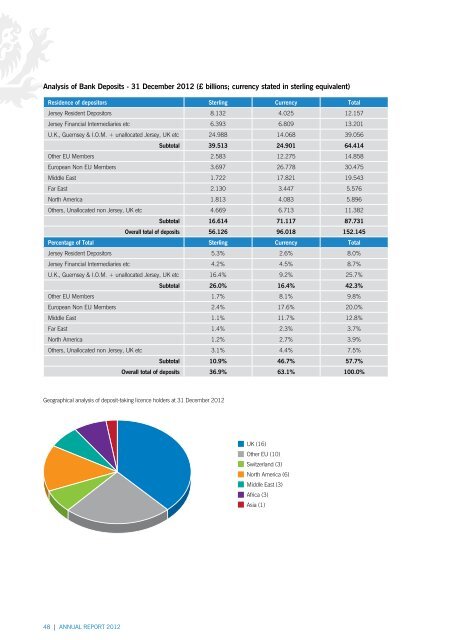
Analysis of Bank Deposits - 31 December <strong>2012</strong> (£ billions; currency stated in sterling equivalent)Residence of depositors Sterling Currency Total<strong>Jersey</strong> Resident Depositors 8.132 4.025 12.157<strong>Jersey</strong> <strong>Financial</strong> Intermediaries etc 6.393 6.809 13.201U.K., Guernsey & I.O.M. + unallocated <strong>Jersey</strong>, UK etc 24.988 14.068 39.056Subtotal 39.513 24.901 64.414O<strong>the</strong>r EU Members 2.583 12.275 14.858European Non EU Members 3.697 26.778 30.475Middle East 1.722 17.821 19.543Far East 2.130 3.447 5.576North America 1.813 4.083 5.896O<strong>the</strong>rs, Unallocated non <strong>Jersey</strong>, UK etc 4.669 6.713 11.382Subtotal 16.614 71.117 87.731Overall total of deposits 56.126 96.018 152.145Percentage of Total Sterling Currency Total<strong>Jersey</strong> Resident Depositors 5.3% 2.6% 8.0%<strong>Jersey</strong> <strong>Financial</strong> Intermediaries etc 4.2% 4.5% 8.7%U.K., Guernsey & I.O.M. + unallocated <strong>Jersey</strong>, UK etc 16.4% 9.2% 25.7%Subtotal 26.0% 16.4% 42.3%O<strong>the</strong>r EU Members 1.7% 8.1% 9.8%European Non EU Members 2.4% 17.6% 20.0%Middle East 1.1% 11.7% 12.8%Far East 1.4% 2.3% 3.7%North America 1.2% 2.7% 3.9%O<strong>the</strong>rs, Unallocated non <strong>Jersey</strong>, UK etc 3.1% 4.4% 7.5%Subtotal 10.9% 46.7% 57.7%Overall total of deposits 36.9% 63.1% 100.0%Geographical analysis of deposit-taking licence holders at 31 December <strong>2012</strong>UK (16)O<strong>the</strong>r EU (10)Switzerland (3)North America (6)Middle East (3)Africa (3)Asia (1)48 | ANNUAL REPORT <strong>2012</strong>
Assets of BanksTotals and sub-totals for registered deposit takers, split between those that are incorporated in <strong>Jersey</strong> (“<strong>Jersey</strong> Banks”)and those that operate in <strong>Jersey</strong> through a branch of an overseas incorporated bank (“<strong>Jersey</strong> Branches”).All values are in £ millions.Activity 2008 2009 2010 2011 <strong>2012</strong>All Loans 301,013 221,370 197,664 193,381 183,085<strong>Jersey</strong> Banks 93,264 79,155 82,402 82,877 81,863<strong>Jersey</strong> Branches 207,749 142,215 115,262 110,504 101,222of which:1.1 Funding of group companies 260,767 188,368 164,613 159,180 148,974<strong>Jersey</strong> Banks 63,662 53,185 56,166 55,859 56,133<strong>Jersey</strong> Branches 197,105 135,183 108,447 103,321 92,841of which intra-<strong>Jersey</strong> 1 is: 3,712 3,790 5,178 5,386 3,1211.2 O<strong>the</strong>r Loans 40,246 33,002 33,051 34,201 34,111<strong>Jersey</strong> Banks 29,602 25,970 26,236 27,018 25,730<strong>Jersey</strong> Branches 10,644 7,032 6,815 7,183 8,381of which:1.2.1 Interbank Loans 5,666 3,545 3,116 4,321 3,041<strong>Jersey</strong> Banks 2,794 3,473 2,974 4,199 2,840<strong>Jersey</strong> Branches 2,872 72 142 122 2011.2.2 Customer Loans 34,581 29,457 29,936 29,879 31,069<strong>Jersey</strong> Banks 26,808 22,497 23,263 22,819 22,890<strong>Jersey</strong> Branches 7,773 6,960 6,673 7,060 8,179of which:1.2.2.1 Retail Loans 7,624 5,737 4,409 4,474 4,523<strong>Jersey</strong> Banks 4,600 3,478 2,442 2,350 2,198<strong>Jersey</strong> Branches 3,024 2,259 1,967 2,124 2,3251.2.2.2 Residential Mortgages 6,538 6,575 6,448 6,881 7,417<strong>Jersey</strong> Banks 4,057 4,174 3,879 4,062 3,987<strong>Jersey</strong> Branches 2,481 2,401 2,569 2,819 3,4301.2.2.3 Commercial Loans 20,419 17,145 19,079 18,524 19,129<strong>Jersey</strong> Banks 18,151 14,845 16,942 16,407 16,705<strong>Jersey</strong> Branches 2,268 2,300 2,137 2,117 2,424All investments 12,115 9,562 11,871 11,594 29,085<strong>Jersey</strong> Banks 7,095 7,523 8,209 9,682 7,906<strong>Jersey</strong> Branches 5,020 2,039 3,662 1,912 21,179All o<strong>the</strong>r assets 5,961 19,979 31,558 28,134 5,243<strong>Jersey</strong> Banks 3,250 2,912 3,119 3,695 3,305<strong>Jersey</strong> Branches 2,711 17,067 28,439 24,439 1,938Balance Sheet Total 319,089 250,911 241,093 233,109 217,413<strong>Jersey</strong> Banks 103,609 89,590 93,730 96,254 93,074<strong>Jersey</strong> Branches 215,480 161,321 147,363 136,855 124,339Risk Weighted Assets (<strong>Jersey</strong> Banks only) 47,910 41,626 43,222 49,974 50,131<strong>2012</strong> CommentaryThe balance sheet total decreased by 1.3% in Q4 <strong>2012</strong> (£2.9 billion), driven by <strong>the</strong> decrease in total funding, which hasresulted in significant declines of £1.9 billion in lending (principally to group companies) and £1.0 billion in <strong>the</strong> total ofinvestments and all o<strong>the</strong>r assets (principally <strong>the</strong> value of items held as hedges versus issued debt). The last two categories fellbecause of a decline in outstanding issued debt and hence a decline in related hedging activity that falls within <strong>the</strong>se categories.A change in <strong>the</strong> management of some of <strong>the</strong>se hedging transactions resulted in circa £20 billion of investments being booked,replacing an equal value of derivatives.For <strong>the</strong> year as a whole, <strong>the</strong> decline in balance sheet assets of £15.7 billion (6.7%), is principally due to: (1) a reduction infunding of group companies (£10.2 billion), related to a decline in deposits and outstanding issued debt; and (2) a net reductionin investments and all o<strong>the</strong>r assets (£5.4 billion), related to <strong>the</strong> decline in outstanding issued debt.1Intra-<strong>Jersey</strong> funding represents deposits placed by banks registered in <strong>Jersey</strong> with o<strong>the</strong>r <strong>Jersey</strong> banks.ANNUAL REPORT <strong>2012</strong> | 49