Farnsworth Avenue Corridor - City of Aurora
Farnsworth Avenue Corridor - City of Aurora
Farnsworth Avenue Corridor - City of Aurora

Create successful ePaper yourself
Turn your PDF publications into a flip-book with our unique Google optimized e-Paper software.
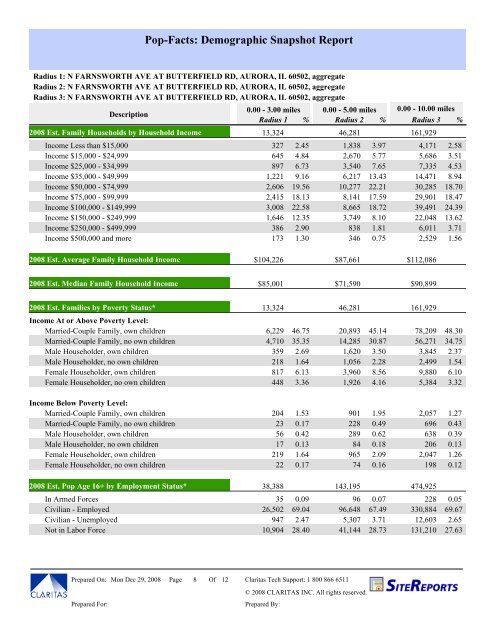
Pop-Facts: Demographic Snapshot Report<br />
Radius 1: N FARNSWORTH AVE AT BUTTERFIELD RD, AURORA, IL 60502, aggregate<br />
Radius 2: N FARNSWORTH AVE AT BUTTERFIELD RD, AURORA, IL 60502, aggregate<br />
Radius 3: N FARNSWORTH AVE AT BUTTERFIELD RD, AURORA, IL 60502, aggregate<br />
0.00 - 3.00 miles 0.00 - 5.00 miles 0.00 - 10.00 miles<br />
Description<br />
Radius 1 % Radius 2 % Radius 3 %<br />
2008 Est. Family Households by Household Income 13,324<br />
46,281 161,929<br />
Income Less than $15,000 327 2.45 1,838 3.97 4,171 2.58<br />
Income $15,000 - $24,999 645 4.84 2,670 5.77 5,686 3.51<br />
Income $25,000 - $34,999 897 6.73 3,540 7.65 7,335 4.53<br />
Income $35,000 - $49,999 1,221 9.16 6,217 13.43 14,471 8.94<br />
Income $50,000 - $74,999 2,606 19.56 10,277 22.21 30,285 18.70<br />
Income $75,000 - $99,999 2,415 18.13 8,141 17.59 29,901 18.47<br />
Income $100,000 - $149,999 3,008 22.58 8,665 18.72 39,491 24.39<br />
Income $150,000 - $249,999 1,646 12.35 3,749 8.10 22,048 13.62<br />
Income $250,000 - $499,999 386 2.90<br />
838 1.81 6,011 3.71<br />
Income $500,000 and more 173 1.30<br />
346 0.75 2,529 1.56<br />
2008 Est. Average Family Household Income $104,226<br />
$87,661 $112,086<br />
2008 Est. Median Family Household Income $85,001<br />
$71,590 $90,899<br />
2008 Est. Families by Poverty Status* 13,324<br />
46,281 161,929<br />
Income At or Above Poverty Level:<br />
Married-Couple Family, own children 6,229 46.75 20,893 45.14 78,209 48.30<br />
Married-Couple Family, no own children 4,710 35.35 14,285 30.87 56,271 34.75<br />
Male Householder, own children 359 2.69 1,620 3.50 3,845 2.37<br />
Male Householder, no own children 218 1.64 1,056 2.28 2,499 1.54<br />
Female Householder, own children 817 6.13 3,960 8.56 9,880 6.10<br />
Female Householder, no own children 448 3.36 1,926 4.16 5,384 3.32<br />
Income Below Poverty Level:<br />
Married-Couple Family, own children 204 1.53<br />
901 1.95 2,057 1.27<br />
Married-Couple Family, no own children 23 0.17<br />
228 0.49 696 0.43<br />
Male Householder, own children 56 0.42<br />
289 0.62 638 0.39<br />
Male Householder, no own children 17 0.13<br />
84 0.18 206 0.13<br />
Female Householder, own children 219 1.64<br />
965 2.09 2,047 1.26<br />
Female Householder, no own children 22 0.17<br />
74 0.16 198 0.12<br />
2008 Est. Pop Age 16+ by Employment Status* 38,388<br />
143,195 474,925<br />
In Armed Forces 35 0.09<br />
96 0.07 228 0.05<br />
Civilian - Employed 26,502 69.04 96,648 67.49 330,884 69.67<br />
Civilian - Unemployed 947 2.47 5,307 3.71 12,603 2.65<br />
Not in Labor Force 10,904 28.40 41,144 28.73 131,210 27.63<br />
Prepared On:<br />
Mon Dec 29, 2008<br />
Prepared For:<br />
Page 8 Of 12 Claritas Tech Support: 1 800 866 6511<br />
© 2008 CLARITAS INC. All rights reserved.<br />
Prepared By: