PETRÃLEOS MEXICANOS - Ri.pemex.com
PETRÃLEOS MEXICANOS - Ri.pemex.com
PETRÃLEOS MEXICANOS - Ri.pemex.com
- No tags were found...

Create successful ePaper yourself
Turn your PDF publications into a flip-book with our unique Google optimized e-Paper software.
PETRÓLEOS <strong>MEXICANOS</strong>Summary of operating statisticsIn<strong>com</strong>e statementsBalance sheet as of December 31InvestmentStatistics on safety and environmental protectionInfrastructure of the Mexican petroleum industryEmployees1PETRÓLEOS<strong>MEXICANOS</strong>STATISTICAL YEARBOOK PEMEX 20092
3STATISTICAL YEARBOOK PEMEX 200912008infrastructure of the mexican petroleum industryProducing fields 344Producing wells 6 382Offshore platforms 225Natural gas processing centers 12Gas sweetening plants 20Cryogenic plants 20Absorption plants 1Liquids fractionating plants 10Condensate sweetening plants 6Sulfur recovery plants 14Refineries 6Petrochemical centers 8Petrochemical plants 38LPG distribution terminals 19Wholesale centers of refined products 77Oil Tankers* 11Tank Trucks* 1 347Tank Cars* 525* Exclude third parties.
SUMMARY OF OPERATING STATISTICSPETRÓLEOS <strong>MEXICANOS</strong>Summary of operating statistics1Production (Mbd)1998 1999 2000 2001 2002 2003 2004 2005 2006 2007 2008CHANGE 2008OVER 2007 %Liquid hydrocarbons 3 498 3 343 3 450 3 560 3 585 3 789 3 825 3 760 3 683 3 471 3 157 -9.0Crude oil 3 070 2 906 3 012 3 127 3 177 3 371 3 383 3 333 3 256 3 076 2 792 -9.2Condensates and liquids a 428 437 438 433 408 418 442 426 427 395 366 -7.6Natural gas (MMcfd) 4 791 4 791 4 679 4 511 4 423 4 498 4 573 4 818 5 356 6 058 6 919 14.2Crude oil processing 1 283 1 228 1 227 1 252 1 245 1 286 1 303 1 284 1 284 1 270 1 261 -0.7Refined products b 1 525 1 485 1 450 1 473 1 481 1 556 1 587 1 554 1 546 1 511 1 490 -1.4Petrochemicals c (Mt) 14 656 12 823 11 501 10 377 9 880 10 298 10 731 10 603 10 961 11 757 11 973 1.8Domestic salesVolume (Mbd)Refined products d 1 644 1 654 1 726 1 712 1 658 1 684 1 718 1 771 1 762 1 815 1 826 0.6LPG 287 312 330 325 332 327 328 313 305 300 291 -3.0Motor gasolines 512 511 531 550 565 600 636 671 718 760 792 4.2Jet fuel 52 55 56 55 53 54 58 59 61 68 65 -4.3Diesel 276 275 285 276 271 295 303 320 345 358 382 6.6Fuel oil 489 471 492 475 406 355 332 341 264 257 220 -14.5Others 27 30 32 30 31 53 61 66 68 71 76 6.5Dry gas (MMcfd) 1 789 1 899 2 061 1 993 2 425 2 621 2 756 2 632 2 955 3 076 3 074 -0.1Petrochemicals c (Mt) 5 135 4 317 3 505 3 495 3 295 3 181 3 568 3 795 3 869 4 041 4 191 3.7Value (million pesos)Refined products d 95 394 112 246 184 680 171 139 161 213 222 821 296 219 373 383 433 565 473 571 542 688 14.6LPG 16 390 17 598 28 469 29 327 26 137 36 856 42 663 48 531 52 706 54 456 55 972 2.8Motor gasolines 39 433 45 722 74 887 71 609 69 756 99 228 144 982 184 651 221 697 247 338 265 981 7.5Jet fuel 2 856 3 800 6 682 5 682 5 194 7 229 10 951 16 241 18 897 23 369 31 936 36.7Diesel 18 418 22 669 37 917 33 793 30 245 44 707 61 473 78 736 88 374 96 920 111 425 15.0Fuel oil 16 389 20 250 33 522 27 653 26 709 30 896 31 529 39 521 43 299 42 396 61 670 45.5Others 1 908 2 207 3 203 3 075 3 172 3 905 4 621 5 703 8 591 9 091 15 703 72.7Dry gas 13 204 15 557 27 595 28 914 30 313 51 189 69 195 79 038 75 355 78 933 105 050 33.1Petrochemicals c 10 354 10 120 11 465 9 601 8 452 12 425 19 221 23 386 24 659 25 970 33 428 28.7a. Includes stabilized condensates.b. Includes LPG from natural gas processing plants of Pemex-Gas and Basic Petrochemicals.c. Includes petrochemicals manufactured by Pemex-Petrochemicals, Pemex-Refining and ethane and sulfur produced by Pemex-Gas and Basic Petrochemicals.d. Excludes propane and pentane.Natural Gas ProductionMillion Cubic Feet Per DAyDomestic sales ofautomotive gasolinesthousand barrels per day70001000600090045000800700STATISTICAL YEARBOOK PEMEX 20094000300020001000019981999200020012002200320042005200620072008600500400300200100019981999200020012002200320042005200620072008
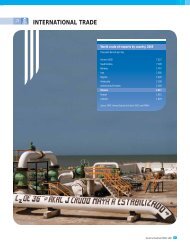
SUMMARY OF OPERATING STATISTICS (CONTINUED)1998 1999 2000 2001 2002 2003 2004 2005 2006 2007 2008CHANGE 2008OVER 2007 %Foreign tradeVolume (Mbd)Liquid hydrocarbonsnet exports 1 521 1 378 1 352 1 524 1 617 1 821 1 789 1 670 1 612 1 371 1 043 -23.9Crude oil exports 1 735 1 554 1 604 1 756 1 705 1 844 1 870 1 817 1 793 1 686 1 403 -16.8Refined productsExports e 121 150 111 104 156 177 153 187 188 180 192 6.8Imports 334 325 363 335 244 200 234 334 369 495 552 11.7PETRÓLEOS <strong>MEXICANOS</strong>Summary of operating statistics (continued)1Dry gas (MMcfd) fExports 40 138 24 25 4 - - 24 33 139 107 -22.6Imports 153 149 231 292 592 757 766 480 451 386 450 16.8Petrochemicals (Mt)Exports 1 010 809 1 116 780 832 813 914 867 818 693 587 -15.3Imports 72 106 317 128 197 95 105 239 254 270 236 -12.8Value (million dollars)Crude oil exports 6 448 8 830 14 553 11 928 13 392 16 676 21 258 28 329 34 707 37 937 43 324 14.2Refined productsExports e 527 833 1 119 856 1 182 1 614 1 947 2 991 3 595 4 052 5 562 37.3Imports 2 089 2 512 4 233 3 656 2 495 2 423 3 792 7 859 10 029 15 797 21 887 38.5Dry gas fExports 31 114 49 48 4 - - 79 72 351 316 -9.8Imports 122 132 366 424 775 1 526 1 715 1 398 1 135 996 1 424 43.0PetrochemicalsExports 119 108 246 113 113 148 217 303 299 242 349 44.0Imports 21 26 72 29 46 44 58 107 128 145 156 7.2Prices (dollars per barrel) gExportsCrude Oil 10.18 15.57 24.79 18.61 21.52 24.78 31.05 42.71 53.04 61.64 84.35 36.8Istmo 11.82 17.45 27.87 22.27 23.48 28.08 38.04 53.11 57.29 69.92 81.09 16.0Maya 8.56 14.13 22.99 17.19 20.89 24.13 29.82 40.61 51.10 60.38 82.88 37.3Olmeca 13.12 17.85 29.00 23.96 24.87 29.32 39.34 53.91 64.67 70.89 99.37 40.2LPG h 12.64 15.73 26.77 28.48 24.34 32.70 39.39 37.52 48.26 55.66 72.52 30.3Jet fuel 14.90 18.39 34.45 29.20 27.43 32.41 45.17 67.95 82.58 83.70 123.65 47.7Diesel 14.01 17.60 27.77 24.49 22.86 33.48 36.46 56.59 49.84 60.96 93.23 52.9Fuel oil (high sulfur content) 8.33 13.56 22.58 11.69 17.71 18.14 18.17 19.20 37.73 44.70 53.13 18.9ImportsLPG h 14.13 17.39 28.05 21.62 21.56 28.34 35.19 42.45 46.22 55.56 62.76 13.0Gasolines 20.35 25.57 39.60 37.83 34.05 41.69 52.42 75.45 85.16 95.09 115.37 21.3Fuel oil (low sulfur content) 12.89 17.02 26.56 23.01 26.01 29.31 34.79 43.00 54.55 62.10 95.82 54.3Natural gas (US$/MMBtu) 2.13 2.38 4.21 3.92 3.48 5.38 5.95 7.77 6.68 6.91 8.42 22.0STATISTICAL YEARBOOK PEMEX 20095e. Includes condensates from 2000 to 2006.f. Includes natural gas purchases and re-sales in the U. S. to 1998 and 1999.g. Average prices.h. Includes <strong>com</strong>ponents.
INCOME STATEMENTS aMILLION PESOS1998 1999 2000 2001 2002 2003 2004 2005 2006 2007 2008(MILLIONDOLLARS) CTotal sales 256 987 334 814 468 267 445 330 481 437 625 429 773 587 928 643 1 062 495 1 136 036 1 328 950 98 162Domestic sales 184 781 226 137 292 880 303 853 314 271 387 237 449 013 505 109 546 738 592 048 679 754 50 210Export sales 72 206 108 677 175 387 141 477 167 166 238 192 324 574 423 534 515 757 542 927 644 418 47 600Services in<strong>com</strong>e - - - - - - - - - 1 061 4 778 353Cost of sales 93 176 113 513 153 060 165 315 157 802 207 118 264 106 361 177 403 106 460 666 654 118 48 316Gross in<strong>com</strong>e 163 811 221 301 315 207 280 015 323 635 418 311 509 481 567 466 659 389 675 370 674 832 49 846General expenses 27 254 31 944 39 582 41 613 47 105 50 744 54 280 68 711 78 041 84 940 103 805 7 668Transportationand distribution expenses 9 603 10 868 12 609 13 588 14 962 15 549 17 574 21 911 24 019 24 799 33 962 2 509Administrative expenses 17 651 21 076 26 973 28 025 32 143 35 195 36 706 46 800 54 022 60 141 69 843 5 159Operating in<strong>com</strong>e 136 557 189 357 275 625 238 402 276 530 367 567 455 201 498 755 581 348 590 430 571 027 42 179Other revenues (expenses) - net- 6 636 5 468 5 083 5 405 342 2 961 11 154 11 837 69 742 83 019 198 006 14 626Comprehensive financing cost b -2 894 -7 156 -6 652 -13 104 -13 773 -30 742 -7 048 -4 479 -22 983 -20 047 -104 673 -7 732Participation in Subsidiaries andAssociates’ Results - - - - - - - - - 5 545 -2 030 - 150In<strong>com</strong>e before taxes and duties 140 300 187 669 274 057 230 703 263 098 339 785 459 308 506 112 628 107 658 947 662 330 48 923PETRÓLEOS <strong>MEXICANOS</strong>In<strong>com</strong>e statementsHydrocarbon extraction dutiesand other 86 033 120 477 224 211 168 264 179 099 288 366 419 629 560 415 582 855 677 256 771 692 57 001Special tax on production andservices 65 854 88 349 69 557 95 199 114 491 94 076 54 705 20 214 - - - -Net in<strong>com</strong>e -11 588 -21 157 -19 710 -34 091 -30 492 -40 644 -25 496 -76 282 45 252 -18 309 -109 362 -8 0781a. Audited figures. Includes Petróleos Mexicanos, subsidiary entities and subsidiary <strong>com</strong>panies.b. Until 2003, only net interest cost is considered. Since 2004 net money exchange and monetary position in addition to net interest cost is used.c. Convenience translations into US dollars of amounts in pesos have been made at the established exchange rate of Ps. 13.5383 = US$1.00 as of December 31, 2008.Such translations should not be construed as a representation that the peso amounts have been or could be converted into US dollars at the foregoing or any other rate.In<strong>com</strong>e* and taxesmillion pesos* In<strong>com</strong>e before taxes & duties800 000In<strong>com</strong>eTaxes & duties6700 000600 000STATISTICAL YEARBOOK PEMEX 2009500 000400 000300 000200 000100 000019981999200020012002200320042005200620072008
BALANCE SHEET AS OF DECEMBER 31 aMILLION PESOS1998 1999 2000 2001 2002 2003 2004 2005 2006 2007 2008(MILLIONDOLLARS) CTotal assets 423 168 482 248 563 468 556 883 697 379 845 472 947 527 1 042 560 1 204 734 1 330 281 1 226 892 90 624Current assets 55 382 87 489 109 393 76 534 123 654 171 027 243 616 292 763 384 924 428 561 354 418 26 179Properties, plant and equipment 316 819 338 254 388 225 406 913 486 098 539 219 594 569 643 236 710 488 793 846 51 209 3 783Others 50 967 56 505 65 850 73 436 87 627 135 226 109 343 106 561 109 322 107 874 821 265 60 662Total liabilities 249 553 320 779 412 862 434 017 596 684 799 611 914 185 1 069 430 1 164 781 1 280 373 1 200 112 88 646Short term liabilities 54 566 84 180 95 766 71 948 113 771 136 916 140 483 164 482 169 927 289 464 166 805 12 321Long term liabilities 194 987 236 599 317 096 362 069 482 913 662 695 773 702 904 947 994 854 990 909 1 033 307 76 325Equity 173 615 161 469 150 605 122 866 100 696 45 861 33 343 - 26 870 39 954 49 908 26 780 1 978Certificates of contribution 10 222 10 222 10 222 10 222 10 222 82 620 86 909 89 805 93 445 96 958 96 958 7 162Restatement of equity b 145 705 162 012 174 054 181 838 190 523 130 258 132 342 144 375 154 785 178 532 - -Accumulated net in<strong>com</strong>e (losses) 9 294 - 21 215 - 46 363 - 85 473 - 109 855 - 167 017 - 211 570 - 305 539 - 288 470 - 317 174 - 259 125 - 19 140Others 8 394 10 449 12 691 16 279 9 804 - 25 662 44 489 80 193 91 592 188 947 13 956Total liabilities and equity 423 168 482 248 563 467 556 883 697 380 845 472 947 528 1 042 560 1 204 735 1 330 281 1 226 892 90 624PETRÓLEOS <strong>MEXICANOS</strong>Balance sheet as of December 31a. Audited results. Include Petróleos Mexicanos, subsidiary entities and subsidiary <strong>com</strong>panies.b. Until 2000, revaluation surplus.c. Convenience translations into US dollars of amounts in pesos have been made at the established exchange rate of Ps. 13.5383 = US$1.00 as of December 31, 2008.Such translations should not be construed as a representation that the peso amounts have been or could be converted into US dollars at the foregoing or any other rate.1STATISTICAL YEARBOOK PEMEX 20097
CAPITAL INVESTMENT aMILLION PESOS1998 1999 2000 2001 2002 2003 2004 2005 2006 2007 2008(MILLIOSDOLLARS) CTotal 50 010 52 382 71 268 63 301 80 759 113 687 122 863 126 988 150 397 170 111 201 907 18 037Non-PIDIREGAS b 30 521 25 103 28 834 26 672 22 943 19 013 12 243 21 436 20 130 17 573 23 749 2 091PIDIREGAS 19 489 27 279 42 434 36 629 57 816 94 674 110 620 105 552 130 267 152 538 178 158 15 946Pemex-Exploration and Production 37 663 41 080 44 654 53 446 63 000 88 380 113 332 112 863 130 071 148 761 178 282 15 918Non-PIDIREGAS b 19 064 14 454 17 418 17 501 13 443 8 945 3 694 11 040 8 142 6 992 8 249 737PIDIREGAS 18 599 26 626 27 236 35 945 49 557 79 435 109 638 101 823 121 929 141 769 170 033 15 182Pemex-Refining 7 162 6 608 21 572 6 185 14 077 19 878 5 092 9 001 15 229 15 979 17 359 1 550Non-PIDIREGAS b 7 162 6 608 6 374 5 501 5 893 5 744 4 647 6 542 7 369 7 124 10 559 943PIDIREGAS - - 15 198 684 8 184 14 134 445 2 459 7 861 8 855 6 800 607Pemex-Gas and Basic Petrochemicals 4 142 3 430 3 617 2 246 1 796 3 253 2 498 3 206 3 322 4 004 4 083 365Non-PIDIREGAS b 3 252 2 777 3 617 2 246 1 721 2 148 1 961 1 936 2 845 2 308 2 769 247PIDIREGAS 890 653 - - 75 1 105 537 1 270 477 1 696 1 315 117Pemex-Petrochemicals 781 945 996 1 058 1 454 1 627 1 598 1 530 1 426 1 139 1 410 126Non-PIDIREGAS b 781 945 996 1 058 1 454 1 627 1 598 1 530 1 426 922 1 400 125PIDIREGAS - - - - - - - - - 217 10 1PETRÓLEOS <strong>MEXICANOS</strong>Capital investmentPetróleos Mexicanos Corporate 262 319 429 366 432 549 343 388 349 227 439 39Non-PIDIREGAS b 262 319 429 366 432 549 343 388 349 227 439 39a. Cash flow.b. Non-PIDIREGAS CAPEX does not include financing activitiesc. The convenience translation into US dollars of amounts in pesos has been made at the 2008 Federal Budget estimated exchange rate of Ps. 11.20 = US$1.00. Suchtranslations should not be construed as a representation that the peso amounts have been or could be converted into US dollars at the foregoing or any other rate.1STATISTICAL YEARBOOK PEMEX 20098
STATISTICS ON SAFETY AND ENVIRONMENTAL PROTECTION2000 2001 2002 2003 2004 2005 2006 2007 2008Frequency index ( number of disabling accidents per million ofman-hours worked)Petróleos Mexicanos 1.19 1.00 1.17 1.09 1.50 1.06 0.67 0.59 0.47Pemex-Exploration and Production 1.66 1.26 1.14 1.35 1.67 1.26 0.96 1.22 0.74Pemex-Refining 0.72 0.69 1.10 0.63 1.23 1.16 0.59 0.27 0.24Pemex-Gas and Basic Petrochemicals 0.90 0.50 1.01 0.92 0.38 0.26 0.07 0.10 0.53Pemex-Petrochemicals 1.06 0.56 0.88 1.13 2.00 1.13 0.70 0.48 0.80Petróleos Mexicanos 1.49 1.86 1.79 1.54 1.85 0.71 0.42 0.07 0.12Severity index (number of lost workdays per million of manhoursworked)Petróleos Mexicanos 170 124 133 132 143 117 33 35 27Pemex-Exploration and Production 277 191 154 134 161 143 42 71 41Pemex-Refining 126 85 138 121 127 93 36 16 17Pemex-Gas and Basic Petrochemicals 109 88 114 196 203 250 9 2 44PETRÓLEOS <strong>MEXICANOS</strong>Statistics on safety and environmental protection1Pemex-Petrochemicals 170 139 161 199 210 138 40 31 43Petróleos Mexicanos 32 53 40 52 54 27 11 2 4Environmental protectionSulfur oxide emissions (SOx) (t/Mt) 2.06 2.15 1.49 1.65 1.49 1.25 1.48 1.60 2.60Carbon dioxide emissions (CO 2) (t/Mt) 133 125 111 117 112 90 114 124 151Total discharges to water (kg/Mt) 17.14 13.19 9.16 7.61 6.39 6.35 6.99 7.72 6.92Disposal of hazardous waste a (%) 76.50 77.00 84.80 97.99 98.19 158.20 62.59 110.62 123.39Leakage and spills bAmount 1 518 1 249 839 791 338 399 404 392 329Volume(t) 6 252 8 031 19 995 9 570 5 488 3 528 3 434 14 992 1 970Environmental audits and certifications (number)Completed environmental audits (accrued) 231 303 308 432 440 443 464 656 754Clean industry certificates (accrued) 229 279 297 345 369 369 377 422 461ISO 9000 c 303 318 159 89 52 46 41 43 43ISO 14000 c 16 44 46 41 36 29 29 28 28a. Includes stock changes in calculation of hazardous residual generation. A volume 7.8% greater than generated was disposed in 2005.b. According to the institutional rules regarding the report of leakages and spills 526 events were not included (equivalent to 5 tons) in 2003, and 469 (equivalent to 22 tons) were not included in 2004.c. In 2002, 2003 and 2004 the number of certificates decreased due to internal reorganizations and multisite certifications (in 2006, Pemex-Gas and Basic Petrochemicals and Pemex-Petrochemicals, obtain asingle certificate).9ACCIDENT FRECUENCY INDEXPemexPemex-RefiningPemex-PetrochemicalsPemex-Exploration and ProductionPemex-Gas and Basic PetrochemicalsSTATISTICAL YEARBOOK PEMEX 20095.04.54.03.53.02.52.01.51.00.50.0200020012002200320042005200620072008
RosaritoNogalesCd. JuárezCamargoCd. ObregónTopolobampoBurgosCadereytaReynosaCuliacánDurangoZacatecasSan Luis PotosíArenqueMaderoGuadalajaraSalamancaTulaPoza <strong>Ri</strong>caMéridaMatapioncheCampechePETRÓLEOS <strong>MEXICANOS</strong>Lázaro CárdenasPueblaCosoleacaqueCorredorMinatitlánCoatzacoalcosCactusSalina CruzLa VentaNuevoPemexCd. Pemex110STATISTICAL YEARBOOK PEMEX 2009REFINERYPETROCHEMICAL CENTERGAS PROCESSING CENTERPRODUCING MARINE AREASPIPELINESMARITIME ROUTE
EMPLOYEESNUMBER AT YEAR END1998 1999 2000 2001 2002 2003 2004 2005 2006 2007 2008Total 131 433 129 159 132 728 134 852 137 134 138 215 137 722 139 171 141 275 141 146 143 421Pemex-Exploration and Production 40 233 40 367 42 642 43 208 44 658 46 322 47 975 48 371 48 767 49 045 50 273Pemex-Refining 47 319 45 396 46 151 47 710 47 341 46 692 44 899 45 335 45 494 44 811 45 510Pemex-Gas and Basic Petrochemicals 11 121 11 220 11 579 11 716 11 977 12 104 11 923 12 018 12 562 12 397 12 976Pemex-Petrochemicals 15 007 14 747 14 837 14 578 14 360 14 203 13 895 13 939 14 045 13 823 14 028Petróleos Mexicanos 5 139 4 941 5 043 5 121 6 207 6 272 6 441 6 687 7 497 7 710 7 341Medical services 10 706 10 710 10 712 10 745 10 863 10 870 10 855 11 097 11 209 11 674 11 619Tele<strong>com</strong>unications 1 908 1 778 1 764 1 774 1 728 1 752 1 734 1 724 1 701 1 686 1 674PETRÓLEOS <strong>MEXICANOS</strong>Employees1STATISTICAL YEARBOOK PEMEX 200911
![RAFAEL FERNANDEZ.ppt [Read-Only] - Ri.pemex.com](https://img.yumpu.com/45686255/1/190x146/rafael-fernandezppt-read-only-ripemexcom.jpg?quality=85)