PETRÃLEOS MEXICANOS - Ri.pemex.com
PETRÃLEOS MEXICANOS - Ri.pemex.com
PETRÃLEOS MEXICANOS - Ri.pemex.com
- No tags were found...

Create successful ePaper yourself
Turn your PDF publications into a flip-book with our unique Google optimized e-Paper software.
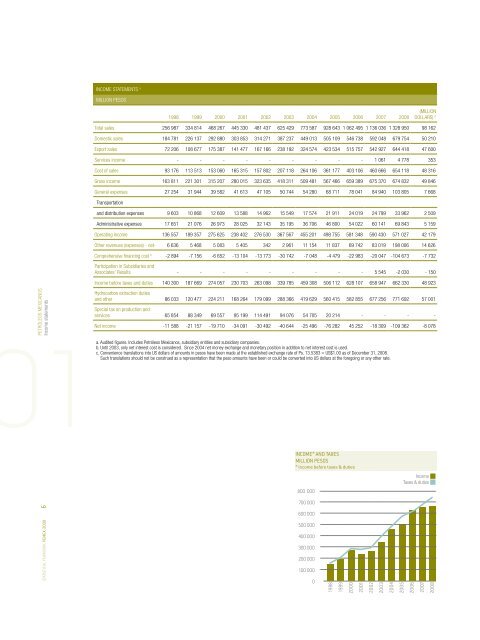
INCOME STATEMENTS aMILLION PESOS1998 1999 2000 2001 2002 2003 2004 2005 2006 2007 2008(MILLIONDOLLARS) CTotal sales 256 987 334 814 468 267 445 330 481 437 625 429 773 587 928 643 1 062 495 1 136 036 1 328 950 98 162Domestic sales 184 781 226 137 292 880 303 853 314 271 387 237 449 013 505 109 546 738 592 048 679 754 50 210Export sales 72 206 108 677 175 387 141 477 167 166 238 192 324 574 423 534 515 757 542 927 644 418 47 600Services in<strong>com</strong>e - - - - - - - - - 1 061 4 778 353Cost of sales 93 176 113 513 153 060 165 315 157 802 207 118 264 106 361 177 403 106 460 666 654 118 48 316Gross in<strong>com</strong>e 163 811 221 301 315 207 280 015 323 635 418 311 509 481 567 466 659 389 675 370 674 832 49 846General expenses 27 254 31 944 39 582 41 613 47 105 50 744 54 280 68 711 78 041 84 940 103 805 7 668Transportationand distribution expenses 9 603 10 868 12 609 13 588 14 962 15 549 17 574 21 911 24 019 24 799 33 962 2 509Administrative expenses 17 651 21 076 26 973 28 025 32 143 35 195 36 706 46 800 54 022 60 141 69 843 5 159Operating in<strong>com</strong>e 136 557 189 357 275 625 238 402 276 530 367 567 455 201 498 755 581 348 590 430 571 027 42 179Other revenues (expenses) - net- 6 636 5 468 5 083 5 405 342 2 961 11 154 11 837 69 742 83 019 198 006 14 626Comprehensive financing cost b -2 894 -7 156 -6 652 -13 104 -13 773 -30 742 -7 048 -4 479 -22 983 -20 047 -104 673 -7 732Participation in Subsidiaries andAssociates’ Results - - - - - - - - - 5 545 -2 030 - 150In<strong>com</strong>e before taxes and duties 140 300 187 669 274 057 230 703 263 098 339 785 459 308 506 112 628 107 658 947 662 330 48 923PETRÓLEOS <strong>MEXICANOS</strong>In<strong>com</strong>e statementsHydrocarbon extraction dutiesand other 86 033 120 477 224 211 168 264 179 099 288 366 419 629 560 415 582 855 677 256 771 692 57 001Special tax on production andservices 65 854 88 349 69 557 95 199 114 491 94 076 54 705 20 214 - - - -Net in<strong>com</strong>e -11 588 -21 157 -19 710 -34 091 -30 492 -40 644 -25 496 -76 282 45 252 -18 309 -109 362 -8 0781a. Audited figures. Includes Petróleos Mexicanos, subsidiary entities and subsidiary <strong>com</strong>panies.b. Until 2003, only net interest cost is considered. Since 2004 net money exchange and monetary position in addition to net interest cost is used.c. Convenience translations into US dollars of amounts in pesos have been made at the established exchange rate of Ps. 13.5383 = US$1.00 as of December 31, 2008.Such translations should not be construed as a representation that the peso amounts have been or could be converted into US dollars at the foregoing or any other rate.In<strong>com</strong>e* and taxesmillion pesos* In<strong>com</strong>e before taxes & duties800 000In<strong>com</strong>eTaxes & duties6700 000600 000STATISTICAL YEARBOOK PEMEX 2009500 000400 000300 000200 000100 000019981999200020012002200320042005200620072008
![RAFAEL FERNANDEZ.ppt [Read-Only] - Ri.pemex.com](https://img.yumpu.com/45686255/1/190x146/rafael-fernandezppt-read-only-ripemexcom.jpg?quality=85)