Wisell MSc thesis
Wisell MSc thesis
Wisell MSc thesis
- No tags were found...

You also want an ePaper? Increase the reach of your titles
YUMPU automatically turns print PDFs into web optimized ePapers that Google loves.
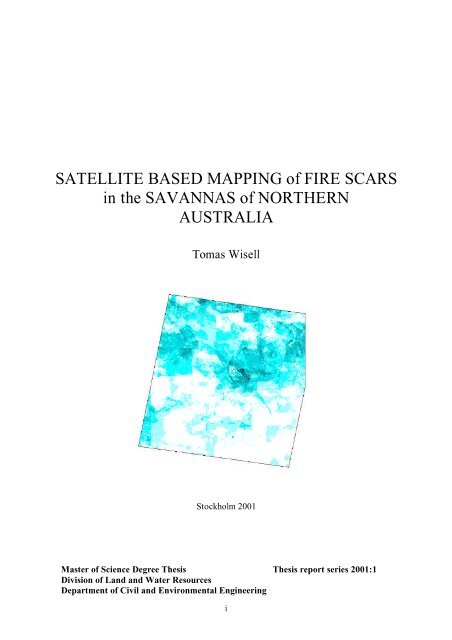
SATELLITE BASED MAPPING of FIRE SCARSin the SAVANNAS of NORTHERNAUSTRALIATomas <strong>Wisell</strong>Stockholm 2001Master of Science Degree Thesis Thesis report series 2001:1Division of Land and Water ResourcesDepartment of Civil and Environmental Engineeringi
Royal Institute of TechnologySATELLITE BASED MAPPING of FIRE SCARSin the SAVANNAS of NORTHERNAUSTRALIATomas <strong>Wisell</strong>SupervisorsAssistant Professor Sindre LangaasDivision of Land and Water ResourcesRoyal Institute of TechnologyDr Jeremy Russell-SmithTropical Savannas Cooperative Research CentreBushfires Council of the Northern TerritoryAustraliaCameron YatesBushfires Council of the Northern TerritoryAustraliaExaminatorLecturer Maria RoslundDivision of GeoinformaticsRoyal Institute of TechnologyStockholm 2001Master of Science Degree Thesis Thesis report series 2001:1Division of Land and Water ResourcesDepartment of Civil and Environmental EngineeringRoyal Institute of Technologyii
iii
Thesis Report 2001:1A <strong>thesis</strong> submitted to the Royal Institute of Technology (KTH), Stockholm, Sweden, inpartial fulfilment of the requirements for the degree of Master of Science inEngineering- Surveying programme with specialisation in Environmental Engineering.The fourth and last year was undertaken within the EESI-programme, which is partlyfinanced by the SIDA (Swedish International Development Agency).Stockholm, January 2001The conclusions and the viewpoints presented in the study are those of the author, and do notnecessarily coincide with those of the Department.Cover illustration: Distribution of fire frequencies over Sturt Plateau, Northern Australia.iv
AbstractEvery year large parts of the tropical savannas in Northern Territory, Australia, are ravagedby bushfires. While fires are inherent characteristics of savanna ecosystems, there arescientists who claim that the fire regimes have changed from pre-European times, thusinfluencing the distribution and abundance of various savanna ecosystems and theircomponents. Further, there are many different land managers with different opinions uponhow to deal with the fires from different economic perspectives, e.g. on the timing anddesirability of prescribed fires.Several authors have demonstrated the usefulness of remote sensing and GIS techniqueswithin the area of fire scar mapping. These techniques therefore have an important role toplay in the quantification and mapping of fire scar for provision of relevant information forscience and management purposes.The overall purpose of this study, carried out in close cooperation with the Northern Territory(NT) Bushfire Council’s Research Unit, was to map the fire patterns in space and time oversix year period in a sparsely vegetated and populated area in the NT named the Sturt Plateau.Aerial, rather satellite based remote sensing was the only feasible way of mapping fires forthe area studied. Ten different Landsat images, including MSS, TM and ETM+ images, wereclassified using an unsupervised classification approach. An accuracy assessment wasperformed for the latest image acquired in October 2000. An additional objective met was thederivation of fire frequencies and fire repeat intervals; information relevant for bothecological analysis and management purposes.Additionally, the <strong>MSc</strong> report reviews the ecological impacts of the savanna fires and differentmethodologies for efficient and accurate mapping of fire scars high-resolution satelliteimagery.vi
vii
AcknowledgementsI thank my supervisor Dr Sindre Langaas at the Royal Institute of Technology, and mylocal supervisor Dr Jeremy Russell-Smith at the Bushfires Council NT, Darwin, Australiafor valuable assistance as professional help and advise during the working process. I alsothank Cameron Yates at the Bushfires Council for help in the form of practical assistancewith the softwares and the fieldwork. The imagery was provided and owned by the BushfiresCouncil and acquired by the ACRES, and the processing would not have been possiblewithout them.Bushfires Council is partly financed by the Cooperative Research Centre for SustainableDevelopment of Tropical Savannas, why the author greatly acknowledges this organisationfor making the implementation of this project possible.The author is also grateful to Andrew Edwards, Tracey May and Lisa Roeger at theBushfires Council for their support and practical help. Thanks are moreover due to CraigHempel at the Park and Wildlife Commission and various managers of the Ranger Stationsin Timber Creek and Mataranka for their assistance with the fieldwork.The <strong>thesis</strong> work would not has been possible to perform in Australia without the generousscholarships from Civilingenjörsförbundets Miljöfond (Swedish Engineers Union’sfoundation for Environmental studies) and the private foundation of Anna Whitlocksminnesfond.viii
AbbreviationsACRESAVHRRDBHEMERETMCRCGCPGISGPSIRKIAMSSNDVINTRMSRSTMAustralian Centre for Remote SensingAdvanced Very High Resolution RadiometerDiameter Breast HeightElectro MagneticEarth ResourceEnhanced Thematic MapperCooperative Research CentreGround Control PointsGeographic Information SystemsGlobal Positioning SystemInfraRedKappa Index of AgreementMulti-Spectral ScannerNormalized Difference Vegetation IndexNorthern TerritoryRoot Mean SquareRemote SensingThematic Mapperx
Table of contents1 INTRODUCTION 32 AIM, OBJECTIVES AND SCOPE 52.1 Aim 52.2 Objectives 52.2.1 Objective 1: To classify ten Landsat images for the case region 52.2.2 Objective 2: To create a fire frequency and a min fire interval of the classified results 52.3 Scope 53 ECOLOGICAL AND MANAGEMENT SIGNIFICANCE OF SAVANNA FIRES IN NORTHERNAUSTRALIA 73.1 Introduction 73.2 Ecological perspective 83.2.1 Introduction 83.2.2 Fire effects on vegetation 83.2.3 Fire effects on fauna 113.3 Fire management 143.3.1 Introduction 143.3.2 Fire management strategies 153.3.3 Future scenarios 164 SATELLITE REMOTE SENSING OF SAVANNA FIRES IN NORTHERN AUSTRALIA 184.1 Introduction 184.2 Principles and theory 194.2.1 Remote sensing theory 194.2.2 Spectral properties of burnt savanna areas 204.3 Remote sensing of fires in northern Australia 234.3.1 The Landsat satellite 234.3.2 Remote sensing future in northern Australia 254.4 Satellite based fire scar mapping methodologies used in the Northern Territory 264.4.1 Introduction 264.4.2 Visual interpretation 274.4.3 Digital techniques 275 METHODOLOGY 325.1 Introduction 325.2 Selection of case area and time period 355.2.1 Why the Sturt Plateau? 355.2.2 The study area 355.2.3 Selection of time period 375.3 Data 375.3.1 Imagery 375.3.2 Field reference data 385.4 Pre-processing 38
5.4.1 Geocoding 385.5 Field verification method 405.5.1 Introduction 405.5.2 On ground sampling 405.5.3 Airborne helicopter sampling 415.6 Method used for image classification 415.6.1 Introduction 415.6.2 Considering factors of burnt area classification 425.6.3 The classification approach 425.7 Method used for creation of fire information maps 465.7.1 GIS methodology 465.8 Accuracy Assessment 486 RESULT 506.1 Classification result 506.2 Fire information maps 546.3 Fire information diagrams 576.4 Accuracy Assessment result 587 DISCUSSION 607.1 Image data shortages 607.2 Classification accuracy 607.3 Reference data quality 618 CONCLUSION 639 REFERENCES 6510 APPENDIX 6910.1 Datasets: Scene 104/071 Sturt Plateau 692
1 IntroductionThe extent and frequency of fire is a major management issue all over the tropical savanna ofnorthern Australia (Russell-Smith, 2000). During the dry season, which lasts from April tillOctober/November, almost the entire Top End (the very north part of Northern Territory) isexposed to frequent fires. Most of these are unintended wildfires. Human lit most wildfires,either accidentally or intentionally. There are also a considerable number of prescribed firesset for one or another management purpose by the aboriginal or by representatives for thevarious other stakeholder groups having an economic interest in determining where and whento burn. The frequent lightning mainly occurring in the onset of the rainy season, also set aconsiderably number of fires (Langaas et al., unpublished).While being rich in natural resources, this region is termed the Outback Australia, partiallyreflecting its very low population densities compared to the more populated areas in southeasternAustralia (Langaas et al., unpublished). In many countries around the world,vegetation fires are one aspect of the management of natural resources. Fires may bebeneficial under proper control, but conversely, when used inappropriately they can devastatehuge areas, degrade the environment and diminish natural resources availability. Regularinformation about fire events at local to national scales is a necessary prerequisite tounderstanding and documenting the extent of their occurrence in space and time (Flasse andCeccato, 1995).Tropical savannas are the dominant ecosystems of Australia’s tropics, covering about onequarter of the continent. Compared to African savannas, North Australia savannas generallyhave a higher ecosystem diversity and patchiness reflecting a more varied climate andtopography. Proper management of the savanna regions requires therefore information on thelocation, timing, and extent of the fires, which means that cost efficient techniques for datacollection and extract information must be used (Langaas et al., unpublished).Field based mapping is often feasible for small areas, but for larger areas as in this study,aerial based remote sensing techniques are generally more favourable. For large areasaffected by the fires such as those occurring in the vast savanna regions of Northern Australiathere are no alternatives to satellite remote sensing for cost-effective mapping of fire scars.Data from the satellite sensor Advanced Very High Resolution Radiometer (AVHRR)onboard the US National Oceanic and Atmospheric Administration (NOAA) satellites -areexcellent for complete coverage of the entire Northern Australia or its states and territories.For more restricted regions, such as the Sturt Plateau with an approximate area of 30 000 km 2 ,there are no good alternatives to the use of high-resolution satellite imagery such as Landsat(Langaas, 2000).Multi-annual mapping of fire scars using satellite imagery makes it possible to analyse thefrequency of fire occurrences and to better analyse the causes of fires as well as theconsequences when applying GIS (Geographic Information System). Figure 1.1 shows anexample of NOAA/AVHRR satellite based fire scar mapping in northern Australia. The fireoccurrence is dependent on various factors such as climatic conditions, vegetation type oranthropogenic activity. Changes in fire pattern and frequency in time are also central in theissue of fire occurrence.3
Figure 1.1. Satellite map of fire scars in northern Australia (Mapped from NOAA 44 satellite imagery bySatellite Remote Sensing Services Dept. Land Administration, Leeuwin centre, Perth, WA)(http://savanna.ntu.edu.au/information/r0/t1/r0_t1_8.html).Globally, very few studies have created multi-annual data sets covering a period of five yearsor more of burned areas derived from interpretation of high-resolution satellite imagery. Somestudies have however been carried out in Australia. A ten-year fire history of the BradshawField Training Area, Northern Territory was performed by Yates et al. (2000) using LandsatTM & MSS, two or three images per year. Images were purchased in the early dry season andthe late dry season, Landsat MSS images were purchased from 1990 to 1997. A study of theEast Kimberley region, Western Australia by O’Neill et al. (1992), presents a four-year firefrequency and fire distribution of different years (1988-1991), using Landsat TM imagerywith bands 1-5 and 7. An other project, over the North Kimberly region, is undertaken byRyan (1997), and will produce maps from 1990 to 1999, based on a study area covered byfour MSS scenes, sampled three times per year. Also, Kakadu National Park has a fire historyfor the years 1980 to 1990 being derived from manual digitising of hard copy prints ofLandsat MSS bands 4, 5 and 7.There are eight major chapters making up this report; the first is the Introduction thatintroduces the reader to the subject and the task. It is followed by the chapter Aim, objectivesand scope that explains the meaning of the work as the heading indicates. The third and thefourth chapters are theoretical literature reviews of ecological impacts of wildfires andphysical and technical aspects of satellite based fire mapping, respectively. The fifth chapteris the Methodology, which describes in detail all steps and problems in the practical workfrom pre-processing to the final maps and their assessment. The seventh chapter presents theResult, and the eighth and ninth Discuss and Conclude the results and the approach/method.4
2 Aim, objectives and scope2.1 AimIn this study I present an application and adoption of commonly used satellite remote sensingand GIS techniques, to study the frequency and extent of fire scars at the Sturt Plateau,Northern Territory, Australia. More specifically I will use Landsat MSS (Multi-spectralscanner), TM (Thematic Mapper) & ETM+ (Enhanced TM) imagery and digital remotesensing techniques to map the distribution of burnt areas over a period of six years (1995-2000) to provide this multi-temporal information to a GIS. Further, the aim was to create acartographic presentation from which it is possible to derive the fire frequency and thegeographical extent of the fires. This information can then be used to make ecologicalanalysis about the mapped areas.2.2 Objectives2.2.1 Objective 1: To classify ten Landsat images for the case regionThe available source data consists of ten Landsat images over exactly the same area andranging over ten fire seasons. The first main objective is to classify data obtained fromLandsat imagery by classifying the pixels into the two classes of burnt and unburnt landsurfaces. When this objective is achieved, a fire history database is created consisting of theten classified images. Reference data will also be collected from ground and airbornetransects. Thereby, it should be possible to give some opinions about the classificationaccuracy of the image from year 2000.2.2.2 Objective 2: To create a fire frequency and a min fire interval of the classifiedresultsThe main second objective is to create a fire frequency and a fire interval map using theclassified results obtained in Objective 1. Merging of the burnt/unburnt information from allyears in a GIS, and by that obtains a cumulative view containing burned area information oversix years will create these maps. GIS are used to refine the final image, and from that resultcreate a fire frequency map of six years at the Sturt Plateau as well as the minimum fireinterval for any pixel.2.3 ScopeThe scope of the Master project is basically to perform a fire frequency assessment over aspecial area in Northern Territory, Australia. The special area is limited by the Landsatsatellite scene (path 104, row 071) over the “Sturt Plateau”, which is situated straight south ofthe Arnhem land and around 500 km south-east of Darwin city (see also Figure 5.2). The areacovered by the scene is approximately 30 000 km 2 . While satellite data are available for tenyears, this study covers six years, from 1995-2000, 1 or 2 images per year and 10 images intotal. Eight of the images used are in Landsat MSS format and registered in the channels 1- 4,one in Landsat TM format registered in the channels 3 and 4, one in Landsat TM formatregistered in the channels 1-7 and two in Landsat ETM+ format registered in the channels 1-8.5
Furthermore, the scope comprises also a study of previous work and research within the area,and analysis and discussion of the result. The classification results, the fire frequency resultand the accuracy assessment will be compared to earlier experiences and literature reviews.6
3 Ecological and management significance of savanna fires inNorthern Australia3.1 IntroductionThe Northern parts of Australia embrace a wide range of ecosystems, of which most comprisethe tropical savannas. The land is of high importance to the aboriginals, whom have inhabitedthese areas for thousands of year (e.g. Roberts et al., 1995). Other stakeholders with interestsin land management are pastoralists, researchers, conservation managers, ecologists, mining,commercial businesses etc, both for ecological and economical purposes (Russell-Smith,2000).Before ascertaining what impacts fire on the savanna has on the environment, and how thefires will affect various land managers, one must ask the question; what is a savanna?Following Eiten (1986) and others, savanna is defined as follows: "A savanna is any areawhere scattered trees and/or shrubs and other large persistent plants occur over a continuousand permanent ground layer visually dominated by herbs, usually graminoids."The vegetation type called savanna is one of the world’s most extensive biomes. They occurunder a wide range of moisture conditions; from humid to arid - and soil conditions - fromlight to heavy textured soils. They are generally described as discontinues tree stratumoverlaying continuous but patchy, grassy ground layer (Williams et al., 1997), but it variesgreatly in tree and grass cover (Braithwaite, 1994). Its ecological characteristics are primarilydetermined by plant available moisture and plant available nutrients (Braithwaite, 1994;Williams et al., 1997). Fire and herbivores are seen as secondary determinants or modifyingfactors. In Northern Australia, other vegetation types occur primarily as the result ofaccumulation of water in low-lying parts of the landscapes (wetlands), access by roots togroundwater (monsoon forest), or substrate composition (Braithwaite, 1994).Savanna vegetation is commonly regarded as being highly resilient to fire, with subsequentregeneration occurring very quickly during the following wet season. The longer-term effectsof fires on vegetation have been poorly documented. It is also very little known about theeffects of fire on biodiversity. Some species of birds and small mammals appear to bedeclining in the region, and it has been suggested that changed fire regimes are causing thesedeclines (Andersen, 2000).Compared to other parts of the world with widespread grass and bushfires, the managementsetting of the north Australian land is extremely diverse. There is a wide range of concernedparties involved, with different fire management goals. These management goals can amongother things be preservation of flora and fauna, protection of human life and property,maximising water quality and minimising production of green house gas (Langaas et al.,unpublished).The purpose of this chapter is to provide a brief overview of the savanna fires in the NorthernAustralia from an ecological and managing perspective. Outcomes from research project ofThe Kapalga Fire Experiment, which was designed to provide information for conservationmanagement on the savanna, are presented together with other studies.7
3.2 Ecological perspective3.2.1 IntroductionIn the Northern Territory, the structure of the savannas varies from open- forests in the humidcoastal and sub- coastal regions of the north, to woodlands and lows open-woodlands in themore arid interior. Recently, the Top End of the NT has seen a sustained research effort by arange of organisations into questions concerning fire and biological diversity, their form andfunction in savannas (Williams et al., 1997). Fire affects all aspects of the ecology of thesavanna - individual plants, plant communities, animals and their habitats, water catchmentsand down-stream hydrology (Russell-Smith and Start, unpublished).The seasonality of growth and reproduction is important not only for the life of plants withinthe savanna, but also for the availability of resources for fauna. Fire may affect theseresources, because leaf flush, flowering and fruiting all peaks during the late dry season(Williams, 2000). Burning of fuel (twigs, dead grass and leaf litter) in the savanna alsotransfers carbon and plant nutrients to the atmosphere as gases, fine particles, and charredfragments of vegetation. The transfers of nitrogen are likely to be the main loss of concern forthe nutrient budget of savannas. Other work suggests that increasing fire frequency isassociated with decreasing nitrogen concentrations in plant tissues. This decrease invegetation quality may affect the fauna, but this has not been demonstrated (Andersen, 2000).3.2.2 Fire effects on vegetationTypically the changes in vegetation generated by fire in the tropical savannas are not dramaticand recovery is rapid. Within two weeks to a month, perennial grasses have usually resprouted;new leaves have appeared on the trees (Braithwaite, 1994). Natural selection in thefire-prone environments has produced many plants that can tolerate defoliation and even thedestruction of their stems by fire. They employ a wide range of mechanisms to survive, forinstance protecting growing points, investing in dormant buds and regularly refilling seedbanks (Russell-Smith and Start, unpublished). The recovery is however varying widely withrespect to different plant groups. A study of Russell-Smith et al. (1998) of fire regime andfire-sensitive vegetation indicated that most species are reproductive at least by the third wet(growing) season following fire and some species, particularly the taller Acacia species andslow-growing shrubs on rocky, skeletal substrates take at least five years to becomereproductive.At first sight the savanna looks as through they are composed of relatively few plant species,but the savannas are actually rich in species, particular plants. There are many ephemeral(short life cycle) herbs, which appear above ground for a brief time, usually in the wet seasonor early dry season. Further, many of the grasses and woody plants look very similar to othersin their group (Russell-Smith and Start, unpublished). Braithwaite (1994) showed from a fieldstudy that on a half square km piece of savanna, 70 species of woody plants, 55 species ofgrasses and sedges, and over 150 species of herbs, were found.Fire regimes often determine which plant community will inhabit a particular area. They arecharacterised by three major elements: frequency, intensity, and seasonality. The major fireregime of these parameters concerns to be fire intensity (Russell-Smith et al., 1998). Frequenthot fires will suit species such as annual sorghum grass, which can generate sufficient fueleach year to maintain the same regime and therefore its dominance (Russell-Smith and Start,unpublished). There are fire sensitive vegetation types, such as monsoon rainforest and heath8
lands, which may be subject to local contraction or gross changes in species compositionunder a regime of repeat late dry season fire (Bowman, 1994). A few species in the savannaare particularly sensitive to fire. They are species that are killed by fire and can regenerateonly, or mostly, from seed. They require several years free from another fire for the seedlingsto mature and refill their seed store in the soil (Russell-Smith and Start, unpublished).In the absence of fire, some ecologists mean that woodland savannas may be invaded byrainforest species given availability of local seed sources (Russell-Smith et al.,1998). In theKapalga Fire Experiment, fire exclusion did not lead to invasion of the savanna by rainforesttrees, at least in the short-to-medium term. Grass-layer composition and diversity were alsounaffected by fire. Grass-layer dynamics were driven more by variation in annual rainfall andpre-existing sorghum cover than by fire (Williams, 2000).Plant survivalRegeneration after fire of the most plant species in Australia habitat savanna is fromvegetation re-sprouts. Many woody rainforests species also reproduce vegetative seasonallydry sites. Given that only species initially present at savanna sites usually are involved inpost-fire succession, it follows that species numbers tend to decline with time if sites arefrequently burned, or not burnt for very long periods (Russell-Smith et al., 1998).To examine strategies to survive fires used by the different groups of plants, it is convenientto classify them as annuals and perennials. Annual species produce a new generation eachyear, and perennial species often live for many years. Both groups contain grasses and broadleavedplants. Broad-leaved annuals are often called forbs while broad-leaved perennialsinclude many growth forms but the most prominent in savannas are shrubs and trees (Russell-Smith and Start, unpublished).Savannas are very resilient to frequent burning although this may lead to increased dominanceof annual grasses, which survive by regenerate from seed each year. Germination (thebeginning of the growth of a seed) occurs during the wet season. Growth and reproductionare rapid and by the early dry season there is a fresh crop of seed in the soil. Early dry seasonfires can harm the crops but these fires are normally ‘cool’, small and patchy. It does notmatter if the spent plants are burned after that because each species is already assured ofanother generation. The species survive because some escape in unburned areas from wherethey can quickly re-colonise burnt patches (Russell-Smith and Start, unpublished). Examplesof native annual species are Sorghum species or spear grass, and the exotic mission grass(Pennisetum polystachion). These species are highly flammable and their increased biomassresults in more frequent, severe and destructive fires (Bowman, 1994).Perennial grasses survive by regeneration from seed. Being relatively slow growing and wellspread out, they do not create sufficient fuel to carry another fire until they have refilled theirseed store in the soil. Most species form dense tussocks, sending up shoots from rhizomes ator below ground level. Fire may destroy the shoots, but buds on the rhizome are protectedand the tussocks quickly re-shoot. The tussocks will die at some stage anyway, and so in thelong term even perennial grasses depend on seed for perpetuation (Russell-Smith and Start,unpublished). Some perennial species, notably some of the of highly flammable hummockspinifex grasses (Symplectrodia, Triodia), are killed by fire (Williams et al., 1999; Russell-Smith et al., 1998). Perennial species such as Pennisetum polystachion (Gamba grass) arehighly productive grasses that increase fuel loads, cure later than the annual grasses, andtherefore have the potential to produce intense, late dry season fires (Williams et al., 1997).9
Tree and shrub survivalTree survivals after fire is dependent on fire regime, fire intensity, tree size and tree functionalgroups (Williams et al., 1999). It is likely to decrease with increasing fire intensity (Williams,2000). Some shrubs are killed by fire and can only regenerate from seed. Thick layers of barkprotect the stems of many trees and woody plants, which insulate the underlying living tissue.Many smaller species, including young trees, coppice (re-sprouting from the base) fromdormant buds at the base of the plant, even if their stems are killed to ground level. Somespecies develop large woody structures that are studded with dormant buds just below theground surface. Individuals in all these groups will die from one cause or another and so theyall need to recruit seedlings for long-term persistence in a community (Russell-Smith andStart, unpublished).The eucalyptus of the tropical savannas of northern Australia will regenerate in the absence offire, but there is differential species susceptibility to late dry season fires. The deciduous,broadleaf trees (for example Terminalia) and the bloodwood group of eucalypts (for example,Corymbia porrecta) are more fire sensitive than the dominant eudesmid group of eucalypts(for example E.miniata). All the eucalypts are sprouters rather than seeders, which is anadaptation to seasonal drought as much as fire. Moreover, the eucalypts are non-serotinous,and seed release occurs each year as fruits ripen and dry, rather than periodically in responseto fire (Williams et al., 1997).In the Kapalga study, the late regime reduced both the proportion of flowering trees per stand,and the density of flowers in the canopy for E. miniata. By contrast, the early and unburntregime had a similarly high proportion of flowering, trees and a high density of flowers in thecanopy. Although the early regime did not significantly reduce flowering in E. miniata, it didsubstantially reduce the development of the flowers through to mature seed-bearing capsules.A similar result was found for A. ocinocarpa, with 4-8 times the amount of seed produced perplant in the unburnt regime compared to early (Setterfield, 2000). This study showed also thatannual burning could have a significant impact on population recruitment in E. miniata and A.ocinocarpa. Frequent fire reduces the amount of seed produced, and reduces the chances ofseedling establishment. This suggests that a fire-free period of a few years would promoteseedling regeneration of these common tropical savanna species (Setterfield, 2000).The impacts of late dry season fires can for some species be dramatic, and their effects aremost profoundly displayed in the tree stratum. Fire sensitive species die following completecanopy scorch. One example is the northern cypress pine, Callitris intratropica, whichpopulations are in serious decline in many areas of northern Australia under the onslaught ofcontemporary fire regimes (Russell-Smith et al., 1998). The Callitris woodlands havecontracted in area in the past 50 to 100 years due to increasing of late dry season fires(Williams et al., 1997) and very frequent burning has also resulted in the local extinction ofCallitris (Bowman, 1994). Both field research and mathematical modelling have shown thaton sites without topographic fire protection, healthy populations of Callitris can develop onlyunder a very specific fire regime of frequent mild fires. The very specific fire regimes thatrequired supporting healthy populations of cypress pines would not occur under naturalconditions. Lightning strikes at the end of the dry season are a common cause of intensebushfires, which are highly destructive of cypress, pine forests (Bowman, 1994).Species–based analyses of stem survival have showed that there is significant intrafunctionaltype variation in survival probabilities. Within the eucalypts, survival in E. miniata and E.polysciada are more likely to survive than those of E. tetrodonta and E. porrecta. Manydeciduous species are more sensitive to fire than evergreen trees like eucalypts (Russell-Smith10
and Start, unpublished). Survival is lowest in the deciduous trees Terminalia ferdinandianaand Erythrophleum chlorostachys (Williams et al., 1999).In a study of Williams et al. (1999) in Kakadu National Park were 31 tree species, sampledbefore and after an unplanned fire. Evergreen eucalypts, deciduous eucalypts and otherdeciduous trees were the most common and accounted for 94 % of all individual stems. Therewas substantial interspecific variation in postfire whole plant and stem survival. Wrightiasaligna and Acacia species did not survive the fire, but were representative by very fewindividuals. Alphitonia excelse, Croton arnhemicus and Livistona species were also severelyaffected with the latter two taxa having less then 40 % whole plant survival. Stem survivalwas modelled of tree functional types. Survival increased sharply with tree size over the rangeof 2-20 cm DBH (Diameter Breast Height), but fell sharply in trees with DBH>40 cm. Thehigh mortality of the largest stems in the study may be related to the high incidence of termite‘piping’ of trunks and larger (Williams et al., 1999).Aquatic vegetationThe seasonal pattern of rainfall in the Top End means that most of the streams do not flow allyear round. Instead, these “seasonal streams” flow for just a few months during the wetseason and remain dry for much of the year. During this dry period, fires frequently burn largeparts of the stream catchments, but it is not much known what affect this has on the streamsthemselves (Douglas, 2000).At the Kapalga Fire Experiment, there was a dramatic difference between stream biota(aquatic plants) in late and unburnt catchments. Streams in late burnt catchments containedsix times as many different species and over ten times the biomass of aquatic plants (Douglas,2000). Compared with the late burnt catchments, unburnt riparian zones had twice as manyspecies and about three times the density of woody plants. Late burning seemed to either killsthe woody plants and vines or reduced reproduction, which is a clearly detrimental effect(Douglas, 2000).Research at Kapalga over the last three years indicates that compared with late and unburntregimes, burning early in the dry season results in intermediate riparian tree density, ripariancanopy cover and the biomass of aquatic plants. Catchments burnt early in the dry season hadsimilar water quality, similarly high richness of riparian vegetation, and similarly low richnessof aquatic plants to that found in unburnt catchments. Burning early in the dry seasontherefore seems to be a reasonable trade-off between maximising the benefits for riparianvegetation and aquatic biota (Douglas, 2000).3.2.3 Fire effects on faunaRelative to other vegetation types in the area, the savannas are rich in mammals, lizards andinsects (Braithwaite, 1994), and fire does affect the overall species composition (Andersen,2000). The resources available to animal species change considerably over time. Thus thehabitat changes over the years and the abundance of different animal species changes also. Inmany cases the animal composition may be totally different at one end of the successionalseries versus the other. Therefore fire has a clear influence on habitat diversity and the rangeof species that can be carried in an area of savanna (Braithwaite, 1994).Fires at a particular time of year may destroy key resources needed by one species but makeavailable resources for another. Many animals exploit the fire itself and the short- termrecovery phases following over the next two months. Many predators hunt around the fireitself, granivores find seeds easily, herbivores feed on the new nutritious foliage and so on.11
Some species find the conditions created by the fires so favourable that they breed during thedry season (Braithwaite, 1994). Fires may also destroy some birds nests during the breedingseason but help form the tree hollows needed for breeding by parrots or shelter by owls andbats (Russell-Smith and Start, unpublished).An important factor for fauna on the savannas is the habitat diversity, which is highlydependent on the fire regime. A large area of monotonous habitat will cater for fewer animalspecies and lower abundance of many of them. Because some groups of animals are moremobile then other, it is not possible to generalise on the optimum size for habitat patches.Nevertheless a mosaic of smaller patches will provide better habitat for many species than oneof larger patches (Russell-Smith and Start, unpublished).Vertebrate faunaBesides the successional development of habitats through the process of regeneration, firesaffect vertebrates in many different ways. Not all species are affected in the same way byparticular processes (Russell-Smith and Start, unpublished). All fires regimes caused bothsignificant increases and decreases in vertebrate richness and abundance, indicating that noparticular fire regime is universally good or bad for terrestrial vertebrates. The late andunburnt regimes caused relatively more decreases than increases in vertebrates richness, sothey are more likely to be harmful than beneficial to functional group diversity (Corbett,2000).The size of the different habitat patches is important for at least two reasons. Firstly, large,uniform areas will not suit the many animals, but they require access to a variety of habitats,for example for breeding. Secondly, as the vegetation at any place changes from newly burntto long unburnt, it provides for a transient succession of animal species each preferring aparticular stage in the process. (Russell-Smith and Start, unpublished).Reptiles and frogsReptiles exhibit a wide range of responses to different fire regimes. As other vertebrates,habitat structure has also in this case a significant influence on the abundance andcomposition of reptile communities. Generally, reptiles are one of the most resilient faunalgroups with respect to fire in the savannas, given their preference for more open, structurallysimple environments (Williams et al., 2000).Different lizard species survive and prosper to different degrees following fires at differenttimes of year (Braithwaite, 1994). Dragons (Agamidae) are examples of this, they exhibit ageneral preference for open habitat in tropical savannas and use to increase in abundance inrecently burnt woodland (Williams et al., 2000). The most famous species in the dragonfamily, the Frillneck Lizard, responds very positively to dry season fires because burningimproves access to food resources at a time of the year when food availability is at its lowest.However, either a high frequency of late fires, or long- term fire exclusion, result inpopulation decline (Griffiths, 2000; Williams et al., 2000).Most frog species in the Australian savannas are relatively inactive during the dry season.Terrestrial frogs decrease in abundance in the late- and unburnt regimes but the mechanismsfor this are unclear. Reduced ground cover following fire in riparian habitats may also reducefrog abundance (Williams et al., 2000).Mammals12
Northern Australia has been spared the dramatic loss of mammal species experienced inalmost all other parts of the continent (Griffiths, 2000). Now there is growing evidence thatmany mammal species have suffered serious declines in their ranges in northern Australia andan inability to identify the reasons of the decline has reduced the ability to manage theproblem. A changed fire regime is a potential factor contributing to the declines (Griffiths,2000). In order to maintain the current intact biota it is necessary to maintain theheterogeneity of the savanna, which is affected by the fire regime. The mammals are thegroup that appears to be most vulnerable to extinction (Braithwaite, 1994).The terrestrial mammals of the savannas are mainly small marsupials and rodents. Thedispersability of these species is low and the life cycle is relatively short (1-3 years) for manyspecies (Williams et al., 2000). The richness of mammals is positively related to habitatdiversity at both canopy and ground levels (Braithwaite, 1994), but also strongly related tolong-term variations in the spatial distribution of permanent water (Williams et al., 2000). It isclear that good habitat diversity is essential to their persistence and probably the persistenceof most groups and thus biodiversity (Braithwaite, 1994). Habitat diversity at the local level isa primary determinant of the distribution and abundance of small mammals as it influencesthe availability of food and shelter (Williams et al., 2000). What ever the requirements of anindividual species may be, habitat diversity created by a range of fire regimes is necessary ifan area is to cater for the needs of them all (Russell-Smith and Start, unpublished). Besideshabitat diversity, fires have other effects on the resources needed by animals. For example,fires reduce flowering and fruiting of savanna trees, particularly in the season following a late,hot fire (Russell-Smith and Start, unpublished).In general, frequent fires reduce the number of small mammals in tropical savannas. Of allmammal species at Kapalga, Northern Brown bandicoots (Isoodon macrourus) showed themost negative response to fire (Griffiths, 2000). This species appears to require fire- freeintervals of 2-3 years for its persistence (Williams et al., 2000). In contrast, the NorthernQuoll (Dasyurus hallucatus) appeared to benefit from annual early dry season fire, decliningin both the annual late dry season fire regime, and the unburnt treatment (Williams et al.,2000; Griffiths, 2000). Also the Grassland Melomys (Melomys burtoni) showed the highestsurvival in the unburnt regime. The only exception from this pattern was the NorthernBruschtail Possums (Trichosurus vulpecula). The frequency of fires is obviously an importantaspect of fire management for small mammals (Griffiths, 2000).BirdsBird diversity in general is positively correlated with structural diversity in the savannas. Thediversity of birds may be lower in frequently burnt savannas than in unburnt savannas,because of the increase in structural diversity over time in unburnt savanna. Time since lastfire, as a determinant of vegetation structure, is also important in determining the compositionof bird communities in semi-arid woodland (Williams et al., 2000).The bird fauna in northern lowland woodlands is very mobile in response to the highlyseasonal nature of food resources. Fires may affect the availability of food resources for manybird species (Williams et al., 2000). Especially fires that occur over extensive areas affect thefood resources for nectar and fruit-eating birds, (Russell-Smith and Start, unpublished).Granivores gain improved access to seed after early dry season fires following the removal ofdry grass. Late dry season fires can reduce seed resources for species such as the GouldianFinch (Erythura gouldiae) and Partridge Pigeon, by destroying the seeds lying on the ground.Insectivores and raptors may increase in abundance for up to six months following individualfires (Williams et al., 2000).13
The Magpie goose is a high profile bird of the floodplains in northern Australia. Late dryseason fire increases the abundance of annual wild rice, an important food source for juvenileand adult geese. This species also tends to nest in areas burnt late in the previous dry season,which means that exclusion of fires on the floodplains may reduce local nesting sites for thisspecies (Williams et al., 2000).Another example is extensive and frequent burning on semi-arid stone landscapes, whichreduces the availability of long-unburnt, mature stands of spinifex. Populations of Whitethroatedgrasswren (Amytornis woodwardi) and Carpentarian Grasswren (Amytornisdorotheae) exist on isolated ranges and massifs, and frequent fires may threaten thesepopulations (Williams et al., 2000).Insects and other invertebratesInvertebrates represent most of the world faunal biodiversity, and drive many of theecological processes that are responsible for ecosystem health (Andersen, 2000). In thesavannas of northern Australia is the diversity of invertebrates high (Williams et al., 2000).Fire often has a little long-term effect on the overall number of insect and other anthropodspecies or their abundance, but it can change species composition. It is more important toknow how long time the last fire was, than in what season the last fire occurred. Many insectgroups and most invertebrates groups are extremely resilient to fire. Fire has a particularlyreducing effect in the context of the high levels of variation shown by invertebrates, whosedynamics are clearly driven by other factors, especially rainfall (Andersen, 2000; Russell-Smith and Start, unpublished). On the other hand, season of burn is important to manyground-active insects such as ants that are affected more by intense, late season fires(Williams et al., 2000).Ant communities are probably the most fire-responsive of the invertebrate groups (Williamset al., 2000). Further, fire regimes in savannas have relatively little effect on grasshopperabundance and diversity. Other like grass-layer groups, are influenced more by whether or notfire occurred, and not influenced by fire intensity (Andersen, 2000). The abundance of grasslayerbeetles declines in the unburnt regimes, with little difference between annual early- andannual late dry season fire regimes (Williams et al., 2000).At Kapalga, fire exclusion resulted in marked reductions in ant abundance and diversity. Aridadaptedants such as Iridomyrmex and opportunistic Rhytidoponera dominated annually burntsavannas whilst long unburnt savanna contained greater number of cryptic species (Williamset al., 2000). Of the eleven groups of ground-active invertebrates considered, only fiveshowed any change in total abundance in relation to fire. The abundance of homoptera,silverfish, spiders and beetles all declined under late fires (Andersen, 2000).3.3 Fire management3.3.1 IntroductionThe management aspects of fires are mainly two; the economical and the ecological. Theecological impacts of fires were outlined in the previous chapter, but not really the strategicmanagement side of the issue. A typical strategic application is the preparation of firehistories based multi-annual fire scar maps that allow for assessment of impacts/effects of14
different fire and burning regimes. They also allow for development of economically andecologically sustainable fire management strategies (Langaas et al., unpublished).Fire is such an important part of the northern Australian environment, with half or more of theTop End burnt each year. People, including conservation managers deliberately light most ofthe fires (Andersen, 2000). Land managers and scientists all agree that fire here needs to beactively managed. The question is not ‘should the country be burnt?’ but ‘How, when andwhere should it be burnt?’3.3.2 Fire management strategiesOne of the key questions that influence management of fire in the savannas is: How have thefire regimes changed over time? Prior to the arrival of Aboriginal people in the savannas, atleast 40 000 years ago fire was most likely to have occurred during the dry season transitionperiod. Aboriginal people modified the timing of fire, by burning earlier in the dry season(Williams et al., 2000). Purposes of aboriginal burning were among other things;• Resources management. Burning in order to increase the abundance of desired species.• Resource harvesting. Burning in order to improve the efficiency of hunting or harvestingof desired species.• Control of the landscape. Ultimately burning gave people control of the landscape,whereby they would not be surprised by unplanned fire and could do particular burningactivities as a matter of choice. They were in charge and burning probably came tosymbolise being in control. The sight of long unburnt country was disturbing and thesight of well-burned landscape was a source of satisfaction (Bowman, 1994).To examining the purposes and affects of the aboriginal burning, it is possible to set upassumptions for the time patterns of different fire regimes and planning fire strategiesapplications. The late dry season fires are in general more intense (and harmful) than the earlydry season fires, because of the higher fuel loads. The prevention of repeated, intense,extensive late dry season fires and hence their unwanted effects on the savannas. The solutionmay be reducing the fuel in the early dry season (Williams et al., 2000). Therefore, thedominant fire management practice is to burn extensively in the early dry season (May/June),when the country is still relatively moist, and fires tend to be low in intensity, patchy, andsmall in extent. This reduces the extent of higher intensity wildfires that inevitably occur laterin the dry season (Andersen, 2000). Early dry season fuel-reduction burning in savannas willcontinue to be used as a general management tool. The effect of early dry season fires appearsto be relatively harmless for many elements of the biota (Williams et al., 2000).15
Figure 3.1. Pandanus and spear grass fire typical of intensive later dry season outbreaks in the Top End(http://www.nt.gov.au/bfc/bushfire.htm).The control of exotic grassy weed species is a critical management issue for pastoralists.These species are spreading in the savanna, particularly the mesic savannas. They are capableto invading native savannas, both on and off conservation reserves. They also cure later thannative species thereby making intense, late dry season fires more likely (Williams et al.,2000). Moreover, many species retain dormant seed in the soil for more than one year.Despite these survival strategies, managers can use wet season burns to control some problemplants such as annual sorghum grasses which proliferate under a regime of frequent hot fires,generating fuel loads that perpetuate the regime (Russell-Smith and Start, unpublished). Fireexclusion is otherwise the dominant management regime of pastoralists, who manage most ofthe biome. But, not all late dry season fires are unwanted or detrimental. They are sometimesused in pastoral country to control tree growth (Williams et al., 2000).3.3.3 Future scenariosThe basic problem facing fire managers and researches in the savannas in the coming decadesis the determination of the optimal mix of fire regimes from all perspectives, andcharacteristics of individual fires. As with elsewhere in the continent, further research isrequired to integrate point-based studies of fires impacts with a spatial understanding of firebehaviour and ecosystem dynamics (Williams et al., 2000).The ecological effects of different fire regimes are inadequately understood, so there isuncertainty over precisely what fire regimes are best for nature conservation (Andersen,2000). Anyway, an ideal fire regime from an ecological point of view may be one that willoptimise biodiversity, variety and variability. That means where the individuals can pick andchoose areas that meet all their various requirements. (Russell-Smith and Start, unpublished).Most of the vertebrate species in the mesic savannas occur in at least one conservationreserve, and relatively few species are endangered. Given that the range of some mammalgranivorous birds has contracted across northern Australia, then the role of fire in creating andpreserving critical habitats for these faunal elements in the landscape requires further research16
(Williams et al., 2000). It is not always clear what are good or bad ecological outcomes.Moreover, management needs to approach from a regional scale, such that the ‘generally’ bestfire regime is not necessarily best at all (Andersen, 2000). Therefore, there is a need to retainand sustain some long unburnt areas and allows others to develop. In some pastoral lands inNT, there is a need to re-introduce some burning to create a mosaic of habitats within theselandscapes (Russell-Smith and Start, unpublished).Should we try to exclude fire from the savannas over longer periods of time and over greaterspatial scales? Decadal-scale absence fire can certainly result in a more diverse tree stratum.Herb diversity may decline in the longer-term absence of fire. Excluding fire from thesavannas, because fuel loads can effectively double to maximal loads within 2-3 years of firesexclusion. This can predispose savannas to high intensity fires, spatially extensive fires ifignited in the late dry season. Some unburnt country needs to be maintained for several yearsto allow effective recruitment of some plant and animal groups (Williams et al., 2000). Also,attitudes to fires are changing, and the judicious use of prescribed fire may even in the futurebe the key to maximizing habitat heterogeneity and conserving biodiversity in these systems(Williams et al., 2000).At the Kapalga Fire Experiment, the effects of the experimental fire treatments (relative tounburnt) can be broadly characterised as followsLate - increased tree mortality (potential reduction in tree density by up to 20 %),significant but surprisingly limited effect on biodiversity;Early - little effect on tree mortality, but significant effects on biodiversity;Progressive - few unique results;(Andersen, 2000).There are two clear management implications from these results. First, the overall resilienceof the savanna biota in relation to fire gives managers considerable flexibility. The savannabiota is fundamentally driven by other factors (such as pattern of rainfall), so it is not a case ofone ‘mistake’ with fire causing long-term or possibly irreversible damage. This is unlike thesituation for particularly fire sensitive habitats, including riparian vegetation (Andersen,2000). Despite such general resilience, fire still has important effects on the savanna biota,and needs to be managed accordingly. The second management implication from Kapalga isthat fire frequency needs to be given more consideration than has previously been the case(Andersen, 2000).Kapalga has provided important information for conservation managers, but many questionsstill remain. There will always be more to learn about the ecological effects of fire in northernAustralia, which means that conservation managers can never be totally confident that theyhave got it right. It is therefore critically important that effective monitoring strategies areimplemented, such that managers are continually refined by new information in an adaptivemanagement framework (Andersen, 2000).17
4 Satellite remote sensing of savanna fires in Northern Australia4.1 IntroductionThe most practical, feasible and relatively objective and cost effective way to quantify andmonitor fire events at national to regional scales is to utilise Earth remote sensing and GIStechniques (Flasse et al., 1996). Many studies have demonstrated the potential usefulness ofremote sensing techniques to monitor the Earth’s surface and fire related information(Kaufman et al., 1990; Prevedel, 1995).18
Fire mapping in northern Australia has used remote sensing techniques for a number of yearsand the results have been used among other things in park management (Allan, 1984; Lant etal., 1995; Allan and Baker, 1990). Techniques of enhancement, classification and mappingfrom satellite imagery are now routine (O’Neill et al., 1992).Mapping of fire scars using high-resolution satellite imagery such as Landsat MSS & TM inthe Northern Territory has a long tradition and several different approaches have been applied(Langaas, 2000). The Landsat satellite sensor series began in 1972 with the Landsat MSS.This data source has been used widely for land cover change assessment including fire scarmapping in northern Australia (Byrne et al., 1980; Chavez and McKinnon, 1994). Sensorsonboard on different editions of the Landsat satellite exclusively provide the remotely senseddata used in this <strong>MSc</strong> <strong>thesis</strong>.In the section reviewing currently used approaches, a paper by Edwards et al. (1999) hasprovided a good starting point. The paper presents a comparative assessment of five firemapping techniques and user interpretations using Landsat imagery conducted by the authors.4.2 Principles and theory4.2.1 Remote sensing theoryRemote sensing is the observation and establishment of a permanent record of an objectwithout actually touching it (Curran, 1980). Henkel (2000) gives a more detailed definition ofremote sensing as the science or art of obtaining information about an object, area orphenomenon by the analysis of data acquired at distance, therefore the term “remote”. Usingvarious sensors, data remotely collected may be qualitative interpreted and quantitativelyanalysed to obtain information on various aspects of the environment.The sensing link in remote sensing techniques is provided by electromagnetic energy,originally emitted from the sun and appearing in the whole spectrum of wavelengths.Electromagnetic energy reaching the Earth’s surface may be reflected, transmitted orabsorbed. Reflected or emitted energy travels upward through the atmosphere, interacts withit, and when a satellite receive the energy, it is detected and converted by a sensor into anumerical value. The amount and spectral distribution of the reflected energy is used inremote sensing to infer the nature of the reflecting surface (Mather, 1987). The radiation(energy) is registered by a sensor (e.g. Landsat TM), within spectral “bands”, where eachband corresponds to a specific wavelength interval.The nature of the interaction between the radiation and the material at the Earth surface varieswith the wavelength. One example of this variation (for green vegetation) is shown in theFigure 4.1 How green vegetation interacts with the EM- radiation is a central issue in thisstudy.19
Figure 4.1. The relation between wavelength and reflectance for green vegetation (ACRES, 2000).A basic assumption in remote sensing theory is that individual surface features, for instancedifferent soil types, rocks with different mineral compositions or various vegetation types,have individually or characteristic properties with respect to the response of the reflectedenergy (radiation). Numerous experimental studies and experiences with multi-spectralsatellite imagery have shown that the assumption is generally acceptable (Mather, 1987). Still,most features on the ground exhibit a dynamic spectral behaviour and change over time thevarious fractions of the electromagnetic energy that are reflected, absorbed, and transmitted,respectively (Langaas, 2000).Remote sensing theory for fire scar mapping purposes assumes that the land surface changesits interaction with the incoming radiation after a fire has ravaged, so that its spectralcharacteristics differs significantly from its surroundings. How accurate the assumption is forburned area discrimination depends on various factors, such as vegetation types, altitude andthe intensity of the fire. With respect to the chemical transformation and changes of externalappearance of flammable vegetation due to a fire, is this assumption reasonable?4.2.2 Spectral properties of burnt savanna areasSpectral characteristics of the reflectance from the post- fire land surface were the startingpoint for research on remote sensing of the burnt areas (Pereira et al., 1999). The spectralcharacteristics of burnt surfaces are prone to confusion with various land cover types,affecting the accuracy of burnt area estimates derived from remotely sensed data (Justice etal., 1993).Spectral properties of recent burns may be characterized, in the visible, near infrared (near-IR), mid infrared, thermal infrared, and microwaves spectral domains. Fire-inducedreflectance changes are also compared for various ecosystems and biomes. The spectralsignatures of combustion products and of burnt areas are compared with those of various landcover types, in order to graphically show relevant characteristics of burnt area spectralproperties (Pereira et al., 1999).20
This study uses the spectral bands 1, 2, 3 and 4 from the Landsat MSS, bands 1-7 from theLandsat TM and bands 1-8 from the Landsat ETM+. The spectral range of the MSS bands islimited to the visible and the near IR wavelength interval. Thus, the examination of thespectral properties of burnt areas in this chapter focus upon these wavelength domains (seesection 4.3.1 for more detailed information about the bands).Visible wavelengthsThe visible spectral domain (0.4 – 0.7 µm) is one of the better known and more extensivelyused for the purpose of burnt area mapping (Pereira et al., 1999). The bands 1 and 2 inLandsat MSS (green to red) and band 1, 2 and 3 in Landsat TM and ETM+ (blue-green-red)are located in the visible domain. Spectral reflectance signatures of fire-affected materials areshown in Figure 4.2, at a spectral resolution of 10 nm. The spectral scale covers the visibleand parts of the near IR domain. The data were collected with a portable spectroradiometerunder field conditions.Figure 4.2. Spectral signatures of fire affectedmaterials in the visible region and parts of the near-IRregion, compared to green needles (Pereira et al.,1999).There are several studies of the spectral properties of burnt surfaces in tropical savannas in thevisible region. Hlavka et al. (1996) study in the wavelengths around 0.63 µm (AVHRR band1, orange) of tropical savanna resulted in a variable spectral change. The variability was dueto that burns were darker than bare soil but similar to vegetation.Langaas and Kane (1991) and Fredriksen et al. (1990) present two relevant field studies ofWest African savanna conducted by field radiometry in the red and IR spectral region. Theseauthors measured the reflectance of very recent fire scars in tropical savannas during the dryseason. They observed in these cases that darkening of the surface is relative to dry grass,which has much higher visible reflectance than green forests and shrub lands. Thisobservation resulted therefore in decreased reflectance of burnt areas.21
Fredriksen et al. (1990) also examined the temporal dynamics of spectral characteristics of afire scar. The findings were that the spectral reflectance quickly increases, after has beenreduced to the half of the value for the red channel and a third of the value for the IR channelcompared to how the reflectance was before the fire. After eleven days was the reflectance inthe red channel almost the same as before the fire occurrence. The authors mean that it isreasonable to assume that the evolution of the red and near- IR reflectance of a burned surfaceprimarily is related to post-fire wind activity and micro-topography, which may varyconsiderably both temporally and spatially.Despite these results, the typical fire- induced increase in visible reflectance reported by mostother studies. This is possibly due to the fact that green vegetation in forest and shrub lands isconsiderably dark in this spectral domain. On the other side, recently burned surfaces tend tobe relatively dark in the visible, and their reflectance seldom exceeds 0.1 (10%). But even ifmoderately bright soil exposed due to the fire, the overall surface reflectance will increase(Pereira et al., 1999).It is important to consider all influencing factors when concluding the spectral properties of aburnt area. The mismatches about assumptions of how spectral characteristics of fire scars are,and how they actually are, is a main reason why mapping sometimes fails (Langaas, 2000).With respect to the scope of northern Australia savannas in this <strong>thesis</strong> are the studies ofFredriksen et al. (1990), Langaas and Kane (1991) and Hlavka (1996) probably more relevantthan studies of other ecotypes.However, several authors indicate that the visible spectral range is not very effective fordiscrimination burns (Tanaka et al., 1983; Ponzoni et al., 1986; Lopez and Caselles 1991;Periera and Setzer 1993; Koutsias and Karteris 1996; Silva 1996; Pereira 1999). A fewreasons for this are suggested by Pereira (1999), namely;1) Like recent burns, several common land cover types, for instance water bodies, wetlands,dense conifer forests, and many soil types are quite dark in the visible domain. Thesesimilarities reduce the possibility of using the visible range to discriminate burns;2) The dynamic range available with Earth observations satellites for discrimination betweenthese different types of surfaces, all of which are dark in the visible, is narrow;3) Path radiance, an important component of the atmospheric effect, predominant in thevisible ranges especially over dark surfaces, and causes a loss of contrast betweendifferent land cover types.(Atmospheric path radiance is an undesired effect that in a simplified form means that asensor above the atmosphere receives redirected radiance from the sun or the ground,scattered within the atmosphere. All of the signal appears to originate from the specific point,but in reality it comes from that point, the sun and other surrounding areas at the surface(Mather, 1987).)Near infrared wavelengthsThe near IR spectral region (0.7 –1.3 µm) has also been extensively used to analyse burntsurfaces (Pereira et al. 1999), and corresponds to the bands 3 and 4 for Landsat MSS (0.7-1.1µm) and band 4 for Landsat TM and ETM (0.76-0.90 µm).The near IR is the spectral region where the signal of recent scars is strongest, and is generallyconsidered as the best spectral region for burnt area detection and mapping by the majority ofauthors. It is especially good when pre-fire fuel loading is high and combustion produceslarge amounts of charcoal that are deposited on the ground. Charcoal is very dark throughout22
the entire spectral range, while ash is very bright and displays a monotonically increase inreflectance with wavelength (Pereira et al., 1999).There are several studies of the spectral properties of burnt surfaces in tropical regions in thenear IR region. According to Langaas and Kane’s (1991) and Fredriksen et al. (1990) studiesof West African savanna (both recorded the same day or the day after a late dry season fire),decreases reflectance of the burnt areas. Ponzoni et al. (1986) and Hlavka et al. (1996) studiesof tropical savannas (with TM band 4 and AVHRR band 2 respectively), resulted also in adecreased reflectance. In the previous study was only water darker than burns and in the laststudy were burns darker than bare soil and vegetation, and similar to water.Since green vegetation is very reflective in the near IR, burning typically causes more or lesssignificant decreases in reflectance. Both green and dry vegetation has substantially higherreflectance than recent burns, and therefore darkening of the burnt surfaces in the near IR issystematic (Pereira et al., 1999).The conclusions for the near IR region are that there is no distinction between boreal andtemperate ecosystems on the one side, and tropical ecosystems on the other side, with respectto post-fire spectral response, (in the opposite to the visible region). It also provides thestrongest and less equivocal discriminant ability to identify burns in satellite imagery (Pereiraet al., 1999).4.3 Remote sensing of fires in northern Australia4.3.1 The Landsat satelliteIn northern Australia, the Landsat satellites with its MSS (Multi Spectral Scanner) and TM(Thematic Mapper) sensors have been the most popular source of remotely sensed data for thefire management purposes (Allan, 1993a; Russell-Smith et al., 1997; Edwards et al., 1999). Itspopularity is based upon several qualifying factors;Firstly, this was the first operational earth resource satellite launched in the 1970’ies.Secondly, it has an operational and long-term nature with a succession of similar Landsatmissions (Langaas et al., unpublished). The orbital pattern was such that it repeated for thestudy of changing features of the Earth surface, such as burning of vegetation (Mather, 1987).Thirdly, because of the sensors’ spectral, coverage and spatial characteristics’ suitability toaddress some of the questions posed above for example the scale of national parks (Langaas etal., unpublished). There have been seven editions of the Landsat satellites, since the first waslaunched in July 1972. Table 4.1 shows an overview of the different editions.Table 4.1. The series of Landsat satellites (ACRES, 2000).Satellite Launched Date NotesLandsat 1 23 July 1972 Decommissioned 6 January 1978Landsat 2 22 January 1975 Decommissioned 25 February 198223
Landsat 3 5 March 1978 Decommissioned 31 March 1983Landsat 4 16 July 1982Satellite turned off in August1992 and kept in standby modeLandsat 5 1 March 1984 OperationalLandsat 6 October 1993 Failed on launchLandsat 7 15 April 1999 OperationalThe decision to use Landsat (TM) imagery for detection of burnt areas is often based on itsspectral and spatial resolution. The spatial resolution is 30 m on the ground for the Landsat 5TM sensor (120 m in band 6), and resolves most small fires in the region. Multi-spectral TMimages have seven bands and the spectral resolution has also been shown to be particularlyuseful for quite detailed identification of vegetation types in northern Australia (Kay et al.,1990). The earlier edition Landsat 5 MSS, has a spatial resolution of 79 m in the direction ofthe satellite and 56 m in the cross track direction, and four spectral bands. Also theradiometric resolution is lower for MSS. The newest edition Landsat 7 ETM+ has eightspectral bands and the spatial resolution is 30 m on the ground for the bands 1-5 & 7 (60 m inband 6) and only 15 m in band 8. Tables 4.2 and 4.3 present a brief overview of facts aboutthe Landsat satellites and sensors.Table 4.2. The sensors carried by Landsat (Mather, 1987; ACRES, 2000).MSS TM ETM+Band no. Wavelength (µm) Wavelength (µm) Wavelength (µm)1 0.5-0.6 0.45-0.52 0.45-0.522 0.6-0.7 0.52-0.60 0.52-0.603 0.7-0.8 0.63-0.69 0.63-0.694 0.8-0.9 0.76-0.90 0.76-0.905 1.55-1.75 1.55-1.756 10.5-12.5 10.5-12.57 2.08-2.25 2.08-2.2580.52-0-90(Panchromatic)Table 4.3. Facts about the fifth and seventh edition of Landsat (Mather, 1987; ACRES, 2000).Landsat 5 Landsat 7Orbit: near-polar, Sun-synchronous Orbit: near-polar, Sun-synchronousAltitude: 705 kmAltitude: 705 kmInclination: 98.2º Inclination: 98.2º24
Period: 99 minutesPeriod: 99 minutesEquatorial crossing: 09.46 Equatorial crossing: 10.10Repeat cycle: 16 days (233 orbits) Repeat cycle: 16 days (233 orbits)It is the combination of the visible red band and the infrared bands which have been shown tobe most useful for mapping different vegetation in relation to aspects such as species mix,canopy density and leaf moisture content (Kay et al., 1990; O’Neill et al. in press). InAustralia, Landsat MSS has been used to map vegetation change associated with bushfires(Richards et al., 1984; Graetz, 1990). Similarly, Landsat TM has been used for fire detectionand mapping, forest fire hazard and risk mapping fire severity and analysing the post-firerecovery of ecosystem (Chavez et al., 1989; Chuvieco et al., 1989; Maselli et al., 1996; Whiteet al., 1996; Viedma et al., 1987). In Kakadu National Park, Landsat MSS satellite imagerywas used to derive a fire history from 1980 to 1994 (Russell-Smith et al., 1987).The Figure 4.3 successfully presents the spectral reflectance of several different types ofsurfaces, using data from the Landsat 5 TM. The spectral signatures displayed represent meanvalues of several training areas extracted from over 20 Landsat scenes of Portugal (Pereira etal., 1999).Figure 4.3. Spectral signatures of diverse land covertypes, extracted from Landsat TM imagery. The datawere not corrected for atmospheric effects. TOA = Top-Of-Atmosphere (Pereira et al., 1999).4.3.2 Remote sensing future in northern AustraliaSince there is a complex relationship between fire frequency, intensity and distribution withnorthern Australia vegetation, satellite imagery is one of the best dynamics techniques that25
allow for the mapping of fires in space and time. When other data such as settlements, landsystem, soils, vegetation, slope, altitude and moisture regimes are added, the user has a greateropportunity to understand vegetation response and ecological effects of fires (O’Neill et al.,1992).Research in remote sensing techniques will develop a powerful tool, which allow ecologistsand land managers to better predict and detect environmental changes more detailed thanbefore (O’Neill et al., 1992). Tropical savannas CRC is a research centre within this scientificarea, which will utilize remote sensing and GIS to scale-up its research and model keyecological and management systems (Hill, 1995). One example of the application fields forthis modelling is the development of remote sensing tools in management of the nationalparks in NT such as Kakadu, Litchfield and Nitmiluk. Among others they are importanttargets for the fire management purposes facilitating satellite-based data.One of the problems met in remote sensing is that the spectral reflectance of a given earthsurface type is influenced by variety of factors, global or local, for instance climaticfluctuations. The development of methodologies capable of producing more accurate burntarea estimates from remotely sensed data is therefore an active topic of research at geographicstudies at all levels in the future (Justice et al., 1993).Remote sensing and GIS therefore have a crucial role to play in the scaling up facets of theresearch. Unfortunately, in some research agencies in the region, knowledge of thesetechniques is very limited. This situation needs to change if there is to be growth inapplication of RS/GIS as well as the research required to address the problems andenvironments of northern Australia (Hill, 1995).4.4 Satellite based fire scar mapping methodologies used in the Northern Territory4.4.1 IntroductionSatellite fire scar mapping has a long history in Northern Territory and many of the wellestablishedmethods have been used. In this chapter we examine some of the approaches forsatellite based fire scar mapping used in Northern Territory. Visual interpretation methodswill be explained as well as digital techniques, together with a review of different applicationstudies, among other one from Litchfield National Park.In the above-mentioned study, Edwards et al. (1999) compared the result obtained from fivedifferent satellite remote sensing experts, each using their preferred technique to delineate thearea burnt for two image dates in 1998. In addition each operator (expert) recorded the timespent processing the images to produce the output fire scar map. It was assumed that the fiveoperators had comparable levels of skill in remote sensing, GIS, and fire mapping in northernAustralia and familiarity with the landscape. Despite the comparable skills between them, thepercentage of the Litchfield National Park area burnt ranged from 34 to 53 %. The meanagreement was 90 % for the fire events themselves.The agreement of the proportion burnt for each operator as compared to each other operatorwas presented. An average agreement for each operator compared to each other operator iscalculated, and showed under each method as an indicator of the classification accuracy. Ofcourse, this is not a very good indicator because it is surely possible that the operator who hasthe lowest agreement did the best classification.26
The Landsat -images utilised in the study covered Litchfield National Park, situated about 500km northeast from the Sturt plateau region. The bands used were TM band 3, the redwavelength; TM band 4, the near infrared wavelength, and TM band 5, the middle infraredwavelength. The images were registered on the 28 th of May and the 31 st of July 1998. Thearea and the images used in the Litchfield study are comparable to the area and images used inthis <strong>thesis</strong>. Another study of the East Kimberley region, situated in the north-east part ofWestern Australia, used Landsat TM imagery from 1988-1991, with the bands 1, 2, 3, 4, 5and 7, should also be useful as comparison.4.4.2 Visual interpretationVisual interpretation means that the user does not directly use the analysing operations of thesoftware, or does not use the software at all. Instead, the interpreter uses his/her own visualability to interpret and classify the image. Due to the fast development of the digitalapproaches and their advantages, the use of visual interpretation methods has decreased therecent years. However, they are basically cheaper than the digital methods and may haveconsiderable importance even in the future.Hard copyImage classification using hard copies is probably the classification method with the longesthistory. Before the appearing of the developed computers and therefore the digital techniques,the hard copy method was the normal way to classify an image. Practically, the classifier hasthe data (image) in the form of a hard (paper) copy and by hand discriminates the areasdirectly on the hardcopy, normally performed by a usual pen. The scale of the hard copy has aconsiderable significance of how accurate this can be done, since it is easier to interpretprecisely and accurately on a larger scale picture copy. On the other hand, the resolutionappears more “blurred”. Later the image or the map can be put on a digitising board and betransferred into a digital system.On- screen vector digitisingThe process consists of displaying the image and zooming in to an appropriate scale, anddrawing a vector polygon around the desired areas “manually”. Each polygon can beperfected using the vertex edit tool if necessary, or by appending other burnt areas to theoriginal polygon. Large areas are generally easier to digitise in stages, with successive areasto the original polygon. Once a polygon is completed to satisfaction, it is best to zoom out tothe full extent of the study area, select the next feature to be digitised, zoom in and repeat theabove procedure (Drenen, 1999). It is an advantage if there is an opportunity to go into thefield to verify the decisions and also have ancillary data such as maps and GPS points of thecurrent area (Edwards et al., 1999).Operator 3 performed on-screen digitising in the Litchfield National Park study. Hisagreement of the proportion burnt for each operator as compared to each other operator was inaverage 65.75 %. To be a visual interpretation method, this percentage must be considered asa rather high agreement.4.4.3 Digital techniquesA classified remotely sensed image is a form of a digital thematic map. If the geometry istransformed to match a recognised map projection, it is in a form suitable for incorporationinto a digital GIS (Mather, 1987). Automatic (digital) classification of the pixels making up aremotely sensed image involves associating each pixel in the image with a label describing areal- world object. In classification, areas in the image are assigned to the object classes. The27
segmentation can be based on naturally occurring differences in the data (spectral classes) orimposed categories (information classes), which are of interest for the analyst (Henkel, 2000).The classification can be made multi-spectrally or multi-temporally, i.e. at the same time forseveral different spectral or temporal channels. The measured EM–radiation in n-channelsdefines the n-dimensional feature space in which the classification is performed. The obtainedobjects are homogenous when the pixels within the classes are more similar to each other thanto pixels in other classes (Henkel, 2000).Unsupervised classificationThe method defines, identifies, labels and maps the occurrence of spectral objects. No earlierknowledge about the spectral properties of the objects is needed. Hence, the influence ofhuman errors is minimised. Each unique class is recognised as a distinct unit. However, theunits’ connection to information classes (real-world objects) remains unclear (Henkel, 2000).An unsupervised classification means that the software through a known algorithm does thediscrimination of the pixels into different classes automatically, without involving an analyst.The number of classes and the classification algorithm are, however, decided manually.The relationship between the labels allocated by the classifier to the pixels making up themulti-spectral image. Land cover existing in the area covered by the image, is determinedafter the unsupervised classification has been carried out (Mather, 1987). This means in somecases that the analyst must provide previous knowledge about the current area, which (ideally)is independent from the remotely sensed image or, knowledge about the spectral signatures ofthe land cover types. In this case of fire scar mapping, the determination of the classes ismerely based on the visual interpretation.Operator 5 performed unsupervised classification in the Litchfield National Park study. Visualinterpretation was then used to select the classes corresponding to the burnt area within eachimage. Additional filtering was used to remove speckle and infill the burnt areas. Hisagreement of the proportion burnt for each operator as compared to each other operator was inaverage 62.5 %, which is fairly low.Advantages with unsupervised classification are+ No extensive knowledge needed;+ Human error is minimized;+ Unique classes are recognised as distinct units.Disadvantages with unsupervised classification are- Unclear correspondence to information classes;- Limited control of menu of classes;- Spectral classes are not constant.(Mather, 1987; Henkel, 1998)Supervised classificationThe method for supervised classification requires prior knowledge about the spectralproperties and/or the statistical nature of the information classes to be determined (Mather,1987). The method requires also some input from the user before the chosen algorithm is28
initiated. This input is derived from fieldwork, air photo analysis or from the study ofappropriate maps.The method is based on areas with known identity or property, comprising the training data.Practically, the analyst draws a polygon or a circle in an area with known identity (trainingdata), and therewith defines the identity of that class to the same statistical characteristics andspectral properties as the pixels inside the chosen area. By an algorithm will the softwareexamine the entire image and define each pixel, which fulfil the statistical and spectralrequirements, to the same class as the training data.An algorithm requires that the number of categories be specified in advance, and that certainstatistical characteristics of each class are known. Among these algorithms, the maximumlikelihood classification is one of the most frequently used.The training data provide control of the menu of classes and allow an accuracy assessment ofthe classification to be made. The histograms of the training classes are inspected and can beedited when necessary. The boundaries of the training areas can be modified in order toachieve the characteristics of the information as homogenous as possible. The interpretation isimposed on the data and the classification depends on the selection of training data and howrepresentative they are for the classes. Also unrecognised spectral classes may occur (Henkel,2000).Operator 4 performed supervised thematic classification in the Litchfield National Park study.Additional bands (combinations of current bands), including NDVI (see section 5.6.3) and thedifference between each image were generated. The selected pixels were then filtered toremove the speckle of unburnt pixels associated with shadow areas. The agreement of theproportion burnt for each operator as compared to each other operator, was in average in thiscase 67.5 %.A study of East Kimberley (O’Neill et al., 1992) for the analysis over four years period of firefrequency and fire distribution of different years, used a supervised classification with aminimum distance to means procedure. The statistics of the resultant classes were examinedfor between and within class variation. Together with field information, these data were usedas the decision factors for merging and labelling classes. To assess the accuracy of using justone image per year to monitor fire patterns was an image from June 1988 classified. A 2 kmwide transect along a road was subset and this was compared to the field mapped firedistribution along the same stretch road. There was strong agreement between the two. Whenthe same stretch of road was examined in late dry season 1988, light early dry season firesbecame classified as a vegetation class.Advantages with supervised classification are+ Control of menu of information;+ Based of areas of known identity;+ Better control of classification.Disadvantages with supervised classification are- Interpretation structure imposed on data;- Training data are based on information classes;29
- Selection of training data may not be representative;- Unrecognised spectral classes.(Mather, 1987; Henkel, 1998)Seed-growing toolOne of the alternative approaches of image classification, which has grown in popularity therecent years, also in Northern Australia, is the seed growing technique. The seed growingfunction is available in many modern GIS and remote sensing related softwares.This tool is used to identify areas that have similar characteristics in an image. The seed tooluses only the bands that are currently displayed in the view to create a polygon. The principleis that the analyst chooses an area with similar characteristics (or just click somewhere in theimage and the software creates an area by default), and the chosen area will grow and includesimilar adjacent pixels until it stops (Langaas, 2000).An algorithm that approves some pixels to be a part of the growing area and avoid othersupervises the including process and it uses the pixel values contained within the original areaas a base for the discrimination. Typically, the polygon returned from the original areaincorporates more variations in the data and includes more pixels in the resulting polygon(ArvView help-function, version 3.1).In the Litchfield National Park study operator 1 performed classification with the seedgrowingtool. Only areas visually identified and selected with the seed-growing tool weremapped. The agreement of the proportion burnt for each operator as compared to each otheroperator, was in average in this case 70,5 %, which is the highest agreement in this study.According to the agreement values in Edwards et al. report, the seed growing techniqueappears as the most accurate classification method.Combined approachesWith combined approaches means that the analyst use two or more of the above describedmethods (or other), in order to improve the classification result compared to a single approachused. Normally, this goes about it that first is one approach used with one special result, andthen is a second (and a third) approach used at the top of the first. Integration of two or moreapproaches works as well.In the Litchfield National Park study was a combined approach performed by operator 2. Hefirst used the seed-growing tool as operator 1. Additional burnt areas were added by on-screendigitising. The agreement of the proportion burnt for each operator as compared to each otheroperator, was in average in this case 69.8 %. That is a rather high agreement but lower thanoperator 1 who merely used the seed growing tool (!). This surprisingly result is leading to thesuspicion we already had before; the agreement measurement may not be a good indicator forclassification accuracy, unless operator 1 is a much better classifier than operator 2.OtherAnother classification method as may be mentioned is the Box classification. This is a simplesupervised method for segmentation uses preset limits for the pixel values to define the objectclasses. This can be done for each of the channels that are involved in the classification. Suchregions in a multi-dimensional feature space are comparable to boxes in a 3-dimensionalfeature space. The box limits can be determined by inspecting the histogram of each of thechannels, and usually local frequency minima are used as box limits (Henkel, 2000).30
5 Methodology5.1 IntroductionThe methodology consists in brief terms of image processing of Landsat imagery and ananalysis and a completion of the result in a GIS. Further, reference data was also collected byvisiting transects in the study area in order to make an accuracy assessment possible. Imageclassification was done with the image processing software ERmapper, and refinement of thedata and accuracy assessment were performed in various other GIS softwares.The chapter also explains and outlines the theoretical considerations, which are integrated inthe methodology. For instance, confusion problems when discriminating fire scars from theirunburnt surroundings are central in the image processing steps. Knowledge about theseproblems and how to treat them is mainly gathered from previous studies. Fredriksen et al.32
(1990) study of fire activity in Senegal gives notes about spectral responses of areas intropical savanna. Based on fieldwork in September 2000 and image processing of imageryfrom 1995 –2000 dry seasons, it can be stated that assumptions about burnt areas derivedfrom these findings are applicable for north Australian savanna as well.Before starting this chapter, a few concepts have to be explained. For instance, how long timehas to have lasted since the last fire ravaged, to call an area burnt? In northern Australia occurthe most fires in the dry season (May- November) and the vegetation recovery is very fastduring the wet season (December-April). This means that it is normally not possible to detecta burnt area from the dry season last year, and can therefore not be called a ‘fire scar’. Twofires at the same place are not possible if a wet season has not past between them. Thecommonly used terms ‘late’ and ‘early’ dry season, are also prone to confusion. It is difficultto define where the limit is between ‘late’ and ‘early’ dry season fires. In this project is twoimages used for the most years, and the first is then called ‘early’ and the second ‘late’. Anatural limit may be somewhere in the middle of August.The practical work was introduced by a pre-processing step where the imagery was preparedfor further analysis. After the pre-processing was done, the first step in the methodology wasto investigate the spectral properties of burned surfaces and other land cover types that can beconfused with burned surfaces. The second step was to perform fieldwork in order to collectvalidation data and improve the understanding of the landscape. The third step was to classifythe images based on previous steps. The fourth step was to create a fire frequency and aminimum fire interval facilitating a GIS. The fifth and final step was to perform an accuracyassessment of the image acquired in 2000. The complete schedule of working phases in themethodology is viewed in Figure 5.1 as a flowchart of steps.33
Figure 5.1. Flowchart of steps.34
5.2 Selection of case area and time period5.2.1 Why the Sturt Plateau?The study was undertaken as a part of the Northern Territory Bushfires Council research workto map fires at the Sturt Plateau. This is a region undergoing much research at the moment,and the fire mapping data and derived information would be valuable to many governmentagencies (Russell-Smith, 2000).First, the region is undergoing rapid pastoral development for beef cattle production. Fires area main management issue, and information about fire on Sturt Plateau is of major importancefor pastoralists who are active in the area. Knowledge about the fire frequency and fireintervals strongly influence of the possibilities of managing profitable cattle farming (Yates,2000).Another reason of choosing Sturt Plateau is that a lot of new ecological projects are startingup in the region at the time as this project was done. The newly formed Sturt Plateau PracticeGroup with various landholders, is interested to know the location and frequencies of fireoccurrences. This is needed for better land management practices and for the use of strategicfires. Knowledge about the Fire history of an area is extremely important for site selection ofecological experiments, for example for biologists who capture animals (Yates, 2000).5.2.2 The study area35
The Sturt Plateau is situated in the northern part of the Northern Territory, Australia, as seesin Figure 5.2.The Sturt Plateauin NorthernTerritory,AustraliaFigure 5.2. Map over the Sturt Plateau image scene showing major settlements and the national highway.Sturt Plateau lies in the central north of the NT. The terrain is gently undulating, somewhatfeatureless plain about 250 m above sea level. Most of the surface is deeply weathered andcovered with thick lateritic soils. Although the species composition of the plant communitiesvaries from east to west and north to south, it is predominantly monsoon woodland withgrassland under storey. Grazing is the most important land use in the region, with about 80 %of the area having been granted as pastoral leases by the federal Australian Government(Kerke, 1996).The Sturt Plateau region is flanked to the south by the Tanimi Track, in the east by theMitchell Grass Downs and Gulf Fall and Uplands, the Daly Basin in the north and Ord-36
Victoria in the west. It lies within the area bounded by 131 o to 136 o E and 15 o to 18 o 30’S. Thelargest settlements are Mataranka (population 200) on the northern boundary, Larrimah(population 40) and Daly waters (a few houses) (Kerke, 1996).The climate can broadly be described by monsoonal climate with uniformly high daytimetemperatures and solar radiation. Annual rainfall varies from a mean of 532 mm to 812 mmand is strongly seasonal with almost all rain falling from November to April. Meantemperatures at Daly Waters near the centre of this region range from a maximum of 37.6 o C(Dec) to 11.1 o C (July) daily minima (Kerke, 1996).The Sturt Plateau is a flat gently undulating plain with little local relief. There are someancient steep-sloped sandstone monad nocks, capped in areas by deeply weathered materialthat may be remnants of early tertiary or late cretaceous land surface. Besides the lateriticsoils, there are deep sands occur in the south and there are deep cracking clays in the southeast and to northwest of Newcastle Waters. There are numerous watercourses that aregenerally short and often braided including Newcastle Waters, Birdum, Elsey, Sunday andDaly Waters Creeks (Kerke, 1996).5.2.3 Selection of time periodLandsat images ranging some 10 years back in time were available at the NT BushfiresCouncil. We decided to start with the most recent ones and work back-wise as long as timeallowed. This also allowed for including the most recent image for which accuracyassessment would be carried out. Given the time period of this <strong>MSc</strong> project this resulted in sixyears end-of-season fire scar maps from year 2000 back and including 1995. This isconsidered as a good database for analysis (Langaas, 2000).5.3 Data5.3.1 ImageryThe image database for the six year period consisted of 10 images, essentially cloud-free,covering Sturt Plateau from July 1995 till September 2000; two images for some years andjust one for others. Six of the images are Landsat-5 MSS, two Landsat 5-TM and two Landsat7 ETM+. Satellites on an altitude of 705 km digitally registered them all. For more detailedinformation about the Landsat satellite see section 4.3.1.The Landsat images are acquired and stored in Alice Springs, centre Australia, at one of theLANDSAT international ground stations. They are purchased from the Australian Centre forRemote Sensing (ACRES). Table 5.1 presents the temporal distribution of the images. Thenumber in the cells stands for the date of registering.Table 5.1. Temporal distribution of the digital image data.Year May June July August September October1995 9 271996 11 2937
1997 14 21998 51999 17 302000 2The number of images per year was limited to the image data provided by the Bushfires NTdependent on economical and other reasons, of course more images was desirable. To chooseone for the early dry season and one for late dry season for the two-image-years, isappropriate when considering the seasonal fire activity.5.3.2 Field reference dataThe field reference data consists of 305 validation points with attached geographical coordinatesand attributes, collected from on ground- and airborne helicopter sampling by visualinterpretation, and saved into a log-file using the MapMaster software.5.4 Pre-processing5.4.1 GeocodingBefore the analyst starts the classification of the current image, he must ensure himself thatthe geographical positions of the map are defined. In other terms, the image must have coordinatesand these co-ordinates must have an acceptable accuracy.The images analysed had not map projection co-ordinates, since they are purchased as rawdata. Accordingly, the first practical work that must be done is rectification to fit the imageinto real world map coordinates, and therefore relates visual features to a geo-referencedposition. The pre-processing step for allocating the raw image map projection co-ordinates iscalled geocoding. The projection used in the geocoding was the "SUTM53" (SouthernUniversal Transverse Mercator Zone 53) and the Datum the "AGD66" (Australian GeodeticDatum 1966).The basic principal in geocoding is that the uncorrected image is compared to a geometriccorrect image (with known co-ordinates) that covers the same area. It is of less importance ifthe corrected image does not cover the entire area of the image that will be corrected, but incase of too bad fitting between them, it will reduce the credibility of the correction. TheERmapper Geocoding wizard is a tool into which geocoding and orthorectification facilitieshave been integrated. It provides many different geocoding methods. Triangulation,polynomial and orthorectification rectify the image by geometric correction and graphictransformation; they correct geometric distortions and associate the image to spatial location.Polynomial rectification is used when one wants to reduce distortions that affect the entireimage (rather than just a localized of it portion), and was therefore the method used in thisstudy. The linear polynomial order was also used, which gives a simple or sharp fit (Cheng,1998).38
Correct image(s) Uncorrected imageFigure 5.3. The uncorrected image is compared to the correct image, and allocates coordinates from specialdefined GCP’s.Practically, the rectifier zoom in the same area on both the corrected image and the imagewhich will be corrected, and tries to find a sharp small-scale feature, edge or pike that arecharacteristic distinguishable on both images. Then, he/she somewhere defines a point, aground control point (GCP), with a special geographical location on the corrected image andtries to find the same location on the other image where he defines the corresponding point.The GCP on the uncorrected image allocates the same geographical coordinates as the GCPon the corrected image. After that the rectifier continues with the next GCP and so on till hehas defined the desired number of points.When four points are defined, the polynomial equation calculates the Root Mean Square(RMS) value, which is an error measure of the location of the GCP’s. The RMS error is astandard statistical measure that attempts to describe the difference between the actual pointlocation defined and the mathematically estimated point location. The RMS error is calculatedas the square root of the added square differences in X and Y between the actual GCP locationand the mathematical estimated location, given by the fitted polynomial equation (see Figure5.4). In general terms the RMS error should be less than 1. This means that the average errorin X and Y is less than 1 image cell (Cheng, 1998).RMS =2x +y2Y• Defined pointRMSMat.estimated point • XFigure 5.4. Graphical presentation and formula of Root Mean Square.The linear polynomial order requires at least three GCPs to create a plane in the 3-dimensional space. How many GCPs that are needed to achieve an “acceptable accuracy” is acontroversial issue. Some experts say that 12 or even 6 are enough, other say at least 50. At39
the Bushfires Council, Darwin, the policy is that around 40 points are satisfying. How thedistribution of the points is over the entire image is something influencing on the accuracy aswell (Yates, 2000). What we will call “acceptable accuracy” is another discussion, and itshould also be dependent on the purpose of the final map or image.5.5 Field verification method5.5.1 IntroductionField verification (or “ground truthing”) is of vital importance as it forms the basis forassessing the accuracy and credibility of the fire scar mapping (Yates et al., 2000). Theverification exercises were conducted 19-21 of September to assess fire-mapping accuracy foran image registered the 2 nd October 2000. Ideally, reference data collection should be done onthe same day as the satellite overpass or immediately afterwards. The two-week gap betweenimage registering and reference data collection may result in some inaccuracies. A correctionto treat this problem was done and explained the section 5.8. It is obviously impossible tocollect reference data for previous years, and Bushfires had neither no earlier reference datafor this area.The field data collection phase of the methodology was conducted by flying helicoptertransects and on ground car transects over representative parts of the study area, and recordinglocation and attribute data along these flight- and road transects. The conducted alignments ofthe field data collection are clear from the reference data map in section 6.4. The analysisphase incorporated computer image processing techniques and spatial statistical analysis todetermine the accuracy of the Landsat TM fire interpretation. All these steps are furtherdetailed explained in section 5.6.5.5.2 On ground samplingThe on-ground sampling was a series of transects through different portions of the SturtPlateau area. The specific locations of the transects, and the sampling logistics was based onthe number of individuals involved (2), and the locations and accessibility of the area.The mapping software MapMaster was used on a laptop computer, connected to a GlobalPositioning System (GPS). The GPS was used to provide positional fixes, while MapMasterlogging software was used to record location and ground attributes. Attributes were recordedevery 60 seconds, and the velocity of the vehicle was ca 100 km/h. Two attributes wererecorded; burnt or unburnt, and were decided by visual interpretation. The ground verificationinformation was subsequently transferred into a GIS. Figure 5.5 shows the sampling principleof field data.Time ObservationClock INTERPRETER EnvironmentAttributes40
Geo. Coordinates Data MappingGPS Computer SoftwareCar BatteryPowerPowerInverterFigure 5.5. Principle for field reference data collection.5.5.3 Airborne helicopter samplingThe principles for the airborne data collection were the same as for the ground sampling, witha few exceptions. The transects were done by a ‘loop’ over representative parts of the studyarea. They were done by flying continuous transects at approximately 500 feet and a velocityof 60 knots (ca 100 km/h) with a helicopter.An experienced interpreter did the visual interpretation in the “area” between the righthelicopter ski and the right side of the helicopter. This ‘hole’ corresponds to around 30 times30 meter on the ground, which is one pixel in Landsat TM system. The visual interpretation isconsidered as accurate or more accurate then the on ground sampling, if it is done by anexperienced interpreter (Yates, 2000). The possible attributes were again two; burnt orunburnt and they were recorded each 30 th seconds.5.6 Method used for image classification5.6.1 IntroductionAfter the geocoding of the images they were ripe to go through a complete classification. Theclassification is the most important step in the methodology and is the central part in the firstobjective of the whole project. Image classification means that the pixels that make up theimage are divided into different groups (classes), and from that label each group to be a landsurface type with special defined properties. In this study only two land cover classes areconsidered, namely burned or unburned surface.The classification method used for this study was unsupervised isoclassification, (for moreinformation see section 5.6.3). The unsupervised classification was prepared by digital outmaskingof the areas that were suspected containing burnt areas. This method used is fairlysimple and fast to perform compared to many other classification methods that can be muchmore complex and complicated. Although this fact, the method can be called combined due tothat two different approaches are used. The method can be described in four main steps;1. Each image was displayed and areas of suspected fires were masked on-screen to form arough image of fires.2. The masked image was classified into 100 classes using an unsupervised classification inERmapper.3. Visual judgments of the classified image by highlighting each class. The image was thenpainted into areas that contained fires and those areas that had no fire, resulting in a twocolouredimage, corresponding to burnt and unburnt areas.41
4. An adaptive median filter was run on the classified fire image.The classification process also includes a number of theoretical steps where one has toconsider the spectral characteristics of different land surfaces, simplifying assumptions,subjective judgments and generalizations. All these parts of the work are more detaileddescribed in the following sections.5.6.2 Considering factors of burnt area classificationWhen classifying images of an area like Stuart Plateau, there are a number of factors andcircumstances that may influence on the result, and should be taking into account. Thedifficulties that can appear of classification of burnt and not burnt areas are mostly connectedwith interpretation confusions of the visual colours when displaying the image on the screen.If the entire area of classification was covered with only one type of flammable vegetationand if in every case the vegetation was entirely burned to 100 % of the biomass, then theclassification would be a simple task. Obviously this is not the case, why some of theseproblems that may have influence on the classification accuracy are explained below.Firstly, when it is burning, the amount of biomass is not entirely burnt. A low intense fire in afairly heavy vegetated area may be difficult to separate from an unburned sparse vegetatedarea next to the burned area. Some areas regenerate quickly after a fire and can after a whilelook like an area with poor vegetation.Secondly, there can also appear areas that are totally unburned but have similar spectralcharacteristics as some of the burned areas, for example dark coloured rocks, hill shadows(Langaas, 2000) or land cover types other than grassland areas, such as agricultural, baresoils, rocks, and water surfaces.Thirdly, not all burned areas are completely burned geographically. Inside the area there arealways spots with unburned vegetation. Patches (spots) of grass are left unburned due to windchanges during fire, natural borders such as tracks and roads or too high fuel load moisture.These patches are isolated from the continuously unburned areas and vary in size, and may ina small scale perspective be tiny and numerous. To handle this problem, the analyst has togeneralise his classification estimations, which of course result in decreased classificationaccuracy.Fourthly, the resolution with respect to the pixel size and the number of bands and theirspectral range also set up some natural limitations of how accurate the classification can bedone.Another problem the classifier can face is that pixels with approximately the same spectralcharacteristics in some areas definitely are burned and in other they are definitely not. Theclassifier must then make distinctions in the interpretation between different parts of theanalysing area. At last, clouds are an undesired object that infect some of the images andshadowing parts of the satellite scene, and make it almost impossible to classify those areas ina satisfying way.5.6.3 The classification approachDisplaying the imageThe first practical step, and the first problem appearing, is to display the image in the best waywith respect to visual discrimination possibilities of burnt and not burnt areas. First, one has to42
set up assumptions for the spectral properties of land with burnt vegetation in contrast to allother kind of land surfaces.An often used idea when dealing with vegetation is to utilise the difference in reflectancefrom green healthy vegetation between visible and IR wavelengths. The reflectance differsfrom around 10 % in the visible red domain to over 50 % in near IR, and no other naturaloccurring features show these big differences in reflectance in the same spectral range. In theLandsat MSS system this difference corresponds to the ratio of band 3 and 2 and in the TMand ETM+ system band 4 and 3. Ratios of spectral bands are commonly used because theyhighlight the spectral differences between material, and at the same time decreasing thevariations in surface brightness due to topography. The ratio used in this case was the wellknownNDVI (Normalized Difference Vegetation Index), which is described by the formula(i1 - i2) / (i1 + i2)where i1 = spectral band in the IR domain and, i2 = spectral band in the visible red domain.The NDVI derived by Tucker (1979) has been used to monitor vegetation condition andchange for multi-temporal land cover studies (Townshend et al., 1995; Chilar et al., 1991) andto map fires globally (Chuvieco and Martin, 1994). The ratio gives an output value between -1and 1, where the closer 1 the output is, the greater is the increase in reflectance from visiblered to IR from the feature. The output for healthy green vegetation is relative high (close to 1)which means that those areas will be displayed rather light on the screen, while other areas forexample burned vegetation will be dark displayed. A necessary assumption for this reasoningto be valid is that the land surface is totally covered by healthy, green vegetation. This isobviously not the case in reality, especially on areas with dry or sparse vegetation like largeareas of the savannas, which are target for the study. Instead, the soil and the bedrockinfluence much on the spectral response.Like the most other image processing software, ERmapper works with three-colour gunsnamely Red, Green and Blue. Combinations of these three guns can create a wide variety ofdifferent colours. A 3- dimensional diagram can describe it with one colour (R, G or B) oneach axis, where all possible points in the 3- dimensional space are special colourcombinations. In this study the red gun was used to display the NDVI, and the green and blueother single spectral bands, different from image to image or area to area. Different operatorsdisagree which is the best combination. Thus, there is no single combination that can be called“the best”.The last refinement of displaying the image was the stretching. The data containing the imageare often compressed in a relative small interval compared to the full dynamic range of asensor, and the pixel values are therefore clustered in a narrow section of the colour-scale.The colour display was accordingly limited to the actual limits, and stretched to the fullpossible colour range within these limits. This operation enhances the contrasts, and thereforeoptimises the visual impression.Vector polygon out-maskingWhen a reasonable way of displaying the image was found, the whole image was visuallyinterpreted. As discussed before, burnt areas may look very different from each otherdepending on various factors. Burnt areas often have characteristic spatial and texturalappearance, and these facts can be used when visual interpreting the image, and thereforeidentify the boundaries of fire scars.43
Vector polygons were drawn around those areas that were suspected as burned in order tomask out them from the rest of the image and therefore reduce the amount of data involved.Some of the surrounding areas of the fire scars were included inside the polygons, to be on thesafe side that no burnt areas were missing. When all the vector polygons were determined,they were projected on the raster image and converted to independent raster regions. The newimage consisting of just these regions was saved and the rest of the data outside the polygonswere further not involved in the analysis.For some of the years in this study (1995-2000) two images for the same year were classified.It is logical to start with the early season image, and to avoid that the same fire scars weremapped two times, burned areas from the early dry season image were not considered in thelate dry season image.The point with this first step was that it is always desired to reduce the amount of datainvolved in the processing. The automatic classification process will also be easier (andfaster) to complete with determined number of classes and statistical conditions, since thenumber of pixels and spectral differences between them are lower.Classification processAfter the fire scars were masked out, a statistical calculation was done on the remainingpixels. To allocate the image statistical values is necessary to prepare it for the classificationprocess. An unsupervised ISOclassification was run on the image, with the intention to create100 classes. An unsupervised classification automatically groups multi-band spectral responsepatterns into clusters that are statistically separable (Drenen, 1998), and each pixel in theimage will be assigned to the clusters it is most spectrally similar to. The word ‘ISO’ standsfor the split and merge procedure known as the ISODATA algorithm. Tou and Gonzales(1974) give a full description of the algorithm while the standard reference is Duda and Hart(1973). For more information about an unsupervised classification see section 4.4.3. Beforestarting the process, the classifier has to decide a few statistical inputs. The box in Figure 5.6shows the values the unsupervised process used.44
Figure 5.6. Inputs to ERmapper unsupervised classification process.Maximum standard deviation and Min. distance between class means decide the requirementsthe user has on the homogeneity of the pixels within each class. Minimum members in a class(%) is the minimum percentage of all pixels that is required to create a class. Desiredpercentage unchanged means that 98 % of the data is desired to be unchanged. This basicallymeans that the classification will not finish until 98 % of the data has been classified;therefore 2 % of the data may not be classified and can have null values (Yates, 2000).Alteration of these values was necessary for many of the images because the processotherwise end up into a loop, since it was statistically impossible to create 100 classes fromthe special dataset. One can ask why just 100 classes were used in this case. To split theimages into 100 hundred spectral classes is praxis at the Bushfires Council and at many otherinstitutions. It can be considered rather many but more classes is often but not necessarilybetter for the classification accuracy, since it discriminate the spectral differences morecarefully.Pixel discriminationA special number of classes was created and displayed in the output image in a defaultgreyscale. The method to label them into the land surface types burnt/unburnt was quitesimple. The original image of Sturt Plateau for the same date was displayed behind theclassified greyscale image. After that, each class was highlighted separately on the screen in acharacteristic colour. The ERmapper transparency tool was used to make the classified imagetransparent, and by this interpret if the highlighted pixels (one class) could be labelled“burnt”, when comparing them to the underlying pixels with the same location. All classesthat were given the identity of burnt were labelled in the same colour, and these that wereidentified as unburnt in another colour.In some cases, it was serious problems to give one class the colour of burnt or unburntbecause it appeared to look burnt in some parts of the image and unburnt in other parts of theimage. In these cases, it was necessary to make distinctions about the class identity indifferent parts of the image by creating something called “exception regions”. A vectorpolygon was drawn around the area that had pixels in the highlighted class, which appeared tohave the opposite identity, compared to the image in general. There were several exceptionregions created in all images. These regions were then projected on the classified image.When all the classes were labelled, the ERmapper Formula Editor was used to create twodifferent results of the image; one “usual” image and one “exception” image. A simpleprogram code (syntax) was written to define the labelling of the images. The code for theusual image was just allocating the classes values of burnt and unburnt, i.e. the same as how ithad been labelled, for exampleIf i1>=1 and i1=6 and i1
where rx = region no.x; i1 = class number; 1 = ‘not burnt’; 6 = ‘burnt’. This image shows onlythe pixels that were exceptions from the rest of the image, no matter if they were burnt orunburnt. The exception image was then displayed on the top of the usual image, that meansthe exception pixels covered some of the usual pixels, (which was the point with theoperation). This combined image was saved and the result was a classified image with burntand not burnt information, with all the exceptions taken into account.AfterprocessingThe image looked after classification rather messy due to single pixels of opposite value thanthe surrounding, were scattered over the most areas. These pixels should in some cases becorrectly classified, but in many cases be wrong classified by coincidence, a result of themethod. By letting a digital filter wrap over the image, much of this speckle disappeared andmade the fire scar regions more distinct. The filter type was a 3×3 adaptive median filter andit is smoothing the image. A median filter works like a 3×3 “window” moving over the imageand allocates each centre pixel the same value as the median value of all pixels within thewindow. In this case, the classified image just consists of two different pixel values, so thecentre pixel allocates the same value as the majority value in the window. Figure 5.7 shows anexample.5 5 11 5 11 1 1Figure 5.7. Example of a digital filter covering a 3×3 pixel area.In this example; three 5 and six 1 à centre pixel = 1.The areas containing data will also decrease slightly because when the filter deals with cellvalues of null (no data) the centre pixel will always become null. Adaptive means that thefilter adapts their calculation to each window position, based on the mean and variance of thecolour scale in the area underlying the window (Mather, 1987). This had obviously noinfluence on the filtering in this case, since the image just had two values.At last, before the image was exported to a GIS, the areas classified as unburnt were excluded.Applying a simple formula in the ERmapper Formula Editor, this was done in the same wayas before;If i1=2 then 2 else nullwhere i1= class number; 2 = ‘burnt’.The final image obtained from image processing in ERmapper had just areas of one class(burnt) with a specific integer value surrounded by null. The same classification approach wasused for all the ten images. A fire history database was achieved when all images werefinished, consisting of ten classified images with respect to burnt/unburnt areas.5.7 Method used for creation of fire information maps5.7.1 GIS methodology46
When the image processing was finished, the files were transferred from the ERmapper intoArcGrid, which is a module in the software of ARC/INFO. There were a few problems withthe images, which had to be corrected, before the analysis could start. First, since the satellitemoves (trembles) in its path, the registrations are not covering exactly the same area.Therefore, it was necessary to find the “largest common area” for all images. Figure 5.8explains the problem in an exaggerated way.Largest common areaFigure 5.8. Extracting the largest common area of all images.Without respect to this problem, the fire analysis would have missing data in the outer regionsof the scene. Second, there were two images for some years and only one for other. The twoimages for the same year were combined by an overlay operation (since the same area cannotburn two times in the same dry season), which however made an image with four differentvalues. Third, all images had different values of burnt and unburnt area from the ERmapperprocessing. By easily allocate for all images the values of 1 (burnt) or 0 (unburnt) and noother values, they were prepared to the last step for obtaining a fire frequency and minimumfire interval.The fire frequency was created by an adding overlay operation where the fire information inall images was added on the top of each other. The result is a final grid with pixel valuebetween 0 (six years of no fire) and 6 (fires every year in the study period). The Figure 5.9below shows the principle.MergingFigure 5.9. Principle for creating fire frequency and fire interval maps.47Accumulated imageAn appropriate and powerful colour scale was applied on the seven categories of the firefrequency map that is viewed in the section 6.2.Minimum fire intervals for the whole area were then examined, which means that theminimum fire interval ranges from 1 to 5 years. For these minimum fire intervals to becorrect, the reasoning including the assumption that no fire would occur 5 years before 1995
or 5 years after 2000, which obviously not is true. But since there are no relevant data (orinformation) about that, this is the only way to do it.Several separate steps created a minimum fire interval map. For the one year interval theimage for 2000 was added at the image for 1999, the image for 1999 at the image for 1998etc. All areas at the added images that had burnt both years got a value of 2, which wasallocated to 1. After that, these images were added together and the result was an image withvalues between 0 and 6. All values except 0 were allocated the value of 1, which means thatthese areas have a minimum fire interval of one year.The same approach was applied at the rest time intervals but the adding in the first step waseach second year images for two-year interval, each third year images for three years intervaletc. Merging all these images together, with the one-year interval covering the two-yearinterval covering the three-year interval and so on, created the final map. This map is viewedin the section 6.2.5.8 Accuracy AssessmentAccuracy assessment means that the classifier tries to examine how accurate his/herclassification is done, and how good the resulting map is. Other conclusions and statisticalvalues can also be derived from the accuracy assessment. The validation data (reference data),which the accuracy assessment is based on represents “the truth”, and is compared to theremote sensing data (classified data). It is discussed in section 7.3, how true these dataactually are.The file with the reference data points was exported from MapMaster and added as an eventtheme to ArcView and converted to a shape file. When these data was displayed together withthe classified data, it was obvious that some of the areas classified as burnt were fires that hadoccurred after the reference data collection was performed. Accordingly, some of the pointsrecorded as burnt were suspected not valid for the accuracy assessment. This suspicion wasconfirmed when examining the NOAA-AVHRR Hotspot Detection maps over the currentarea, from the date of the field collection till the date for the satellite overpass (informationavailable at the http://www.rss.dola.wa.gov.au/noaafd/2000/SEP/NOAAfd.html web site). Anumber of points (32) through burnt areas were therefore deleted.The reference data shape file overlies the image from 2 October 2000. Each recorded pointwas used as an absolute geographical fix with specific coordinates obtained from the GPS.The program calculated four combinations, with respect to how the points were targeting inrelation to the two classes, see Table 5.2.Table 5.2. Reference data result compared to classificationAttribute Classification Frequency Agreementburnt 1 33 Yesunburnt 0 225 Yesburnt 0 43 Nounburnt 1 4 Nowhere 1 = burnt; 0 = unburnt.48
Making significance of these numbers is desired, and four well-established measures weretherefore calculated; producers’ accuracy, users’ accuracy, overall accuracy and Kappaindex of agreement (KIA or ?), all derived from the error matrix. The error matrix is ideally an×n matrix in which the n categorical classes classified are compared to an unbiased sampleof reference data, commonly with the classified map derived remote sensing data shown onthe rows, and the reference data shown in the columns (Congalton and Green, 1999). Theerror matrix is shown in Table 5.3.Table 5.3. Error matrixReference databurnt unburnt Row totalRem.Sen. burnt 33 4 37Data unburnt 43 225 268Column total 76 229 305Producers’ accuracy is a measure of omission, and can be interpreted as the probability thatthe methodology has mapped correctly given that the actual class is burnt. It is calculated bydividing the reference data that agree with the remote sensing data, by the total reference data.Users’ accuracy is a measure of commission, is indicative of the probability that a pixelclassified on the image actually represents that class on the ground. It is calculated bydividing the remote sensing data that agree with the reference data by the total remote sensingdata. Overall accuracy is a kind of average value of the classification, calculated bysumming up the diagonal of the n×n matrix (all samples that agree) and dividing this valuewith the total number of samples.Kappa index of agreementA further point to be made about interpreting classification accuracies is the fact that even acompletely random assignment of pixels to classes will produce percentage correct values inthe error matrix. The Kappa Index of agreement, KIA (?) is a measure of the differencebetween the actual agreement between reference data and an automated classifier and then thechance agreement between the reference data and a random classifier (Lillesand and Kiefer,1994). In other words, it is a measurement of the agreement achieved by skill, chanceexcluded. The overall KIA (?) is calculated by the equation?Νn∑∑iii=1 i=1=n2Νx−−( x ∗ x )∑( xi+∗ x+i)i=1ni++ iwheren = number of rows/columns;x ii = sum of observations in the diagonal cells;x i+ = total of observations in row i;x +i = total of observations in column i;N = total number of observations in the matrix49
(Lillesand and Kiefer 1994; Congalton and Green, 1999).The ?- value ranges from -1 to 1. However, since there should be a positive correlationbetween the remotely sensed classification and the reference data, positive ?- values areexpected (Lillesand and Kiefer, 1994). 0 means total agreement from chance, 1 is perfect‘true’ agreement. A ? of 0,50 could be thought of as 50 % better agreement than just bychance (Langaas et al., 1998). The KIA can also be calculated for each category like theusers’ and producers’ accuracy, and is then called conditional kappa. However, it has beenargued that the concept of chance agreement may be misleading since it also includes someactual agreement or agreement by cause thus leading to underestimation of the actualagreement. (Congalton and Green, 1999).6 Result6.1 Classification resultThe ten classified Landsat images are displayed in Figure 6.1. The darker colour representsthe fire scars, and the lighter colour the unburnt areas.Landsat –5 MSSAcquired: 9-JUL 1995Centre: 15:26:57/E132:58:35Format: CRS BILLevel: 4 Bands: 123450
Landsat –5 MSSAcquired: 27-SEP 1995Centre: 5:26:51/E132:55:30Format: CRS BILLevel: 4 Bands: 1234Landsat –5 MSSAcquired: 11-JUL 1996Centre: S15:26:51/E132:54:38Format: CCRS BILLevel: 4 Bands: 1234Landsat –5 MSSAcquired: 29-SEP-1996Centre: 15:26:42/E132:55:48Format: CCRS BILLevel: 4 Bands: 123451Landsat –5 MSSAcquired: 14-JUL- 1997Centre: 15:26:59/E132:56:00
Landsat –5 MSSAcquired: 2-OCT-1997Centre: S15:26:47/E132:56:25Format: CCRS BILLevel: 4 Bands: 1234Landsat –5 TMAcquired: 5-OCT- 1998Centre: 15:27:17/E132:57:07Format: CCRS BILLevel: 4 Bands: 3452
Landsat –5 TMAcquired: 17-MAY 1999Centre:15:25:49.54/E132:55:41.86Format: CCRS, BILBands: 1234567Landsat –7 ETM+Acquired: 30-SEP 1999Centre: S15:25:59.35/E132:53:27.79Format: FastL7A, BSQBands: 123456L6H78Landsat –7 ETM+Acquired: 02-OCT 2000-10-23Centre: 15:26:11.28/E132:55:01.64Format: FastL7A, BSQBands: 123456L6H7853
Figure 6.1. The classification result from the ten Landsat images. The borders between burnt and unburnt are insome cases really sharp. They have arisen due to physical obstacles such as roads, fence lines, dikes etc. thatare able to stop the distribution of a fire, or very distinct borders between different vegetation types.6.2 Fire information maps54
The annual frequency with which different areas of the Sturt Plateau has burnt over the period1995-2000 is given in Figure 6.2.Figure 6.2. Annual frequency distribution of burning at the Sturt Plateau 1995-2000.Given the ecological significance of the fire return period (Yates et al., 2000), the informationis presented for the minimum mapped fire return periods for the Sturt Plateau, in Figure 6.3.55
Figure 6.3. Minimum fire-return periods for the Sturt Plateau, 1995-2000.The annual frequency distribution of burning on the Sturt Plateau is given in a diagram formin the Figure 6.4, and Figure 6.5 shows the comparison between early and late dry seasonburnt areas for all the years in the study. The fire frequency information indicate that 14 % ofthe Sturt Plateau has been burnt at frequencies of three or more years out of six.56
The minimum fire interval map indicates that around half of the area burnt any time over thesix years period, has a minimum fire interval of only one year. This information has a veryhigh ecological significance, especially for obligate seeders woody species. Some plants arekilled by fire but they have seed, which can survive and start to grow next season. But, if fireravages two years in a row it can burn the seeds as well, and the plant is gone from that area.6.3 Fire information diagrams57
Figure 6.4. Annual frequency distribution of areas burning at the Sturt Plateau 1995-2000.Figure 6.5. Area (km 2 ) of the Sturt Plateau burnt in the early dry seasons 1995-2000.6.4 Accuracy Assessment resultA visual comparison between the reference data attributes and the image classification isshowed in Figure 6.6.Figure 6.6. Result from the reference data collection. The image classification is displayed in the background. Ahelicopter did the “loop” in the very top of the map with denser attributes, the rest of the alignments were doneby a car. Some areas in the north, west and east of the scene are cut off, in order to bring out the visited areas.Burnt reference data, classified burnt58Unburnt reference data, classified unburntFire scarsBurnt reference data, classified unburntUnburnt areas
Accuracy measurements calculated from the error matrix in section 5.8 are presented in Table6.1.Table 6.1. Accuracy measurements of the classification over Sturt Plateau (image 2000).Sturt PlateauBurnt Unburnt OverallOverall accuracy - - 0.85Producers accuracy 0.43 0.98 -Users accuracy 0.89 0.84 -KIA (?) - - 0.50An example can explain the meaning of the values; The producer of this map can say that inSturt Plateau 98 % of the time an area that was classified as unburnt was unburnt, but a userof this map will find that ‘only’ 84 % of the time will an area on visits actually be unburnt(Congalton and Green, 1999).59
7 Discussion7.1 Image data shortagesBearing in mind that this study does claim to create a six years fire frequency (and firehistory), there are without hesitation some extensive shortages with the images data. The firstand the most remarkable shortage is that there is only one image for some years (and two forother). For the one-image-years is that image registered in the turn of the monthSeptember/October, which means that there is an uncertainty if the early dry season fires havebeen mapped. In some cases they have, but in other has the fire scar possibly become changedin spectral properties to the extent that they almost look like the unburnt surroundings due todifferent reasons (see sections 4.2.2 and 5.6.2), and therefore has not been considered as firescars.Another shortage in the image data, perhaps more serious then the previous explained, is thatthe last image for all years is registered between the 27 th of September and 5 th of October.Many fires in the NT occur during October or November and even later, accordingly afterthose dates. With respect to these solemn shortages, the classification database may be calledthe not so flattering name “quasi fire history”.There are however some ways to improve the credibility of the fire history using the existingdata. One idea suggested by Langaas (2000) to treat the first mentioned shortage (one-imageyears)is; for each of the single image years, the pixels of the case area that are still mapped asunburnt (and are potentially flammable) could given a ‘fire occurrence probability’ accordingto the number of times the pixel has been (mapped as) burnt for the years when the entire fireseason has been mapped divided by the number of years with mapping of entire fire season.This may be further refined per pixel by separating the ‘early-dry season fire occurrenceprobability’ and ‘late-dry season fire occurrence probability’ which together becomes ‘thetotal fire occurrence probability’. Of course is four years weak primary information tocalculate these kinds of probabilities, but it will hopefully make the fire frequency/fire historyslightly more accurate. To obtain information about the fires occurring after the latest imageregistering each year, I have no good proposal.When examining the variation in areas burnt annually, some patterns in the fire occurrenceappear. The bottom half of the scene area is almost spared from fires, while fires frequentlyexpose the upper parts. Unfortunately, any relevant land use maps were not available indigital form (and neither in paper) so the assessment of the fire patterns cannot be very deep.The fire frequencies are however regularly distributed and the differences should depend onthe vegetation type (or presence of vegetation), hydrological conditions, the level ofanthropogenic activity and perhaps other reasons. Therefore is it possible to perform a firerisk/chance analysis for different sites within the study area, if there is an interest.7.2 Classification accuracyThe quality of the classification should be one of the first aspects one think about whendiscussing the result. The accuracy measurements presented in the previous chapter was onlyderived from the image 2000. The same approach is used on all images and therefore is it60
possible to make a general statement about the classification of the images. Of course, someimages are more difficult than other to discriminate the fire scars, dependent on theappearance of the scars, occurrence of clouds and other circumstances. But these differencesshould not have a very big influence accounting the whole complexity of a satellite imageclassification involving several million pixels. However, the difference in spatial and spectralresolution for the different sensors is considerable; one MSS pixel covers more than fourtimes bigger area than one TM pixel. The spectral resolution counted in total wavelengthcoverage and number of bands, is in both cases almost twice as big for TM than MSS.Therefore we should suspect that the accuracy for the older MSS images is slightly lower thanthe result from the accuracy assessment of the image 2000.How careful I was when classifying the different classes and creating of the exception regions(see section 5.6.3) between the different images, may on the other hand be discussed. Myfeeling is that in this working phase was “the human factor” a source to arbitrary decisions.Anyway, it is almost important to examine the influences of this factor. At last, the filteringprocess generalized the classification and further reduced the accuracy.An overall accuracy of 85 % is considered acceptable or good of several authorities withinthe area (Congalton and Green, 1999; Richards, 1993; Langaas, 2000; Russel-Smith, 2000). Aremarkable result is that the producers accuracy for burnt areas is only 43 %, which is sayingus that a minority of the attributes recorded as burnt were classified as burnt. This is given astarting point of a discussion about the reference data quality (see section 7.3.), and/or a cruelsuspicion about the burnt area classification. Fortunately, as suggested by Richards (1993) theusers accuracy is the one that should normally be adopted, as this is the most relevant from auser perspective (the users accuracies are 89 % and 84 % respectively).As mentioned before, the overall accuracy does not exclude the chance agreement, but KIAdoes. The KIA value, 50 % in my case, provides a less positive picture pointing to the factthat chance agreement has a great influence when only two land covers (burnt/unburnt) areinvolved. However, my opinion is that the KIA is not a good measurement of the mapaccuracy, but the overall accuracy is a better measurement for that. My argument for thisstatement is that it does not matter for the map accuracy if the pixel is classified correct bychance or by skill, correct is correct. Instead, the KIA is a very good measurement of howgood the classification(method) or the classifier is. Landis and Koch (1977) characterized aKIA value between 40 % and 80 % as a moderate agreement. In this case was a “poormoderate agreement” achieved, and cannot be considered good but hopefully acceptable.7.3 Reference data qualityBefore giving the accuracy values too much substance, one should consider two differentaspects of thematic map accuracy assessment pointed out by Lillesand and Kiefer (1994),namely• The quality of any accuracy estimate is only as good as the information used toestablish the “true” land cover types present in the visited sites.• The accuracy assessment procedure must be designed to reflect the intended use of theclassification.When I was thinking of the first of these points, I concluded that the quality of the referencedata should have a considerable influence of the accuracy assessment result. The referencedata is sometimes called “ground truth”, but it is clear that those data not is a question about61
an absolute truth (if there anything exists something called an “absolute truth”). Instead, Ifound a number of weaknesses in the verification method used in this study, and theseweaknesses accordingly give rise to error sources (and therefore affect the quality of thereference data). These error sources are mainly1) The GPS accuracy.2) Spatial misregistering; pixel size, speed of the vehicle, time before press.3) Patchy burnt inside a pixel area.4) Defective interpretation of burnt/unburnt.5) Data entry errors by the interpreter.6) Not objective or representative reference data collections.7) Subjectivity when deleting reference data points.8) Changes in land cover between the date of the remotely sensed data and the date of thereference data.9) It is easier to record “unburnt” then “burnt”.Some of these errors are presumably small, for instance the GPS is very accurate and the dataentry errors may also be neglectable. Others are definitely not small and will affect theaccuracy assessment considerable, as the alignments of the reference data collections or themismatch between recording of reference data and the image registration. But, some of theerrors might have a positive influence and other a negative influence of the accuracy, and anoptimist could assume that these positive and negative errors would neutralise each other.This assumption is however not very scientific, and probably, the statistical error margins ofthe accuracy increase with each error source.The alignments of the reference data collections need a special discussion, and my impressionis that this is the biggest error source in the accuracy assessment methodology. Bearing inmind that only a few areas were visited, the representativity of the reference data is target forhesitation. In this study, the reference attributes had low agreement with the classification inareas with burnt attributes or classified as burnt. But the overall accuracy was despite thisrather high thanks to that many attributes were recorded where it was relatively easy to bothmap unburnt and record unburnt as an attribute. Number 3) in the error sources list is alsoimportant to outline; if a sample point hits an unburnt patch within a generally fire affectedarea, this means that an apparent mismatch between reference data and mapped fire scaractually may be correct (Langaas et al., 1998). However, the scale should not be veryproblematic in this case with high-resolution Landsat images.Anyway, the point to carry out an accuracy assessment is based on the assumption that thereference data is an absolute truth, without this assumption, the accuracy assessment would bemeaningless.How important the second point given by Lillesand and Kiefer is to discuss, I claim is beyondthe scope of this project. The fire maps will presumably be the objects of many interests, oneimportant is the ecological use. How the accuracy values are related to this and other uses, Ihand over to the experts within respective area.62
8 Conclusion63
The classification of the ten images went successfully and a six years fire history databasewas therefore created. The individual fire maps were also created from the database with asatisfying result. According to these facts, both of the prior objectives decided in the secondchapter are achieved.I have not invented the methodology in this <strong>thesis</strong>, including the image data sources, theclassification method and the GIS refinements. It is well known and has extensively been triedin Australia. Despite these facts the methodology can be criticised and I claim there are waysto improve it. In my case, more images (more comprehensive data source) could make theclassification accuracy considerably better. In particular, the acquisition of the imagery as lateas possible into the dry season would improve the annual mapping.Despite the possible error sources discussed in the previous chapter, the fire frequency andminimum fire interval maps seem to make sense. The fire patterns in both maps are regularwith respect to burnt areas year by year, and compared to each other, so they should havepractical use.My general conclusion is therefore that the individual fire maps should be considered usefulas overviews when concerned with the major fire patterns at the Sturt Plateau. Still, theyshould not be treated as a high quality reference when performing detailed ecological analysisin the small scale.64
9 ReferencesAllan GE (1999) Fire Vegetation Information Products from NOAA AVHRR Satellites forNorthern Australia. Bushfires Council NT (BFC) Version 1.0.Anderssen A, Williams D, Cook G, Douglas M, Setterfield S, Corbett L, Griffiths T (2000)65
Fire and Biodiversity – CSIRO’s Kapalga Fire Experiment, Kakadu National Park.Workshop notes, Wednesday 27 September 2000.Bowman DMJS (1998) Transley Review No. 000: The impact of Aboriginal landscapeburning on the Australian biota. Centre for Indigenous Natural and Cultural ResourceManagement &Faculty of Science, Northern Territory University, Darwin, Australia.Braithwaite RW (1994) A healthy savanna, endangered mammals and Aboriginal burning. In:Country in Flames. Ed. By D Bird Rose. Canberra and Darwin: Biodiversity Series,Paper No.3, Biodiversity Unit.Cheng WCW (1998) ERmapper 6.0 User guide. Earth Resource Mapping Pty Ltd.Congalton RG, Green K (1999) Assessing the Accuracy of Remotely Sensed Data: Principlesand Practices. CRC Press, Inc.Drenen A (1998) Research project in Geographical Information Systems: Creating a FireHistory of the Jawoyn Lands, Northern Territory.Edwards A (2000) Oral communication.Edwards A, Allan G, Yates C , Hempel C, Ryan P (1999) A Comparative Assessment of FireMapping Techniques and User Interpretations using Landsat Imagery. AustralianBushfire Conference, Albury.Flasse SP, Ceccato P (1995) A contextual algorithm for AVHRR fire detection. Int.J. RemoteSensing, 1996, vol.17 No. 2, 419-424.Flasse SP, Ceccato P, Downey ID, Williams JB, Navarro P, Raimadoya MA (1996) RemoteSensing and GIS to Support Vegetation Fire Management in Developing Countries.13 th Conference on Fire and Forest Meterology, Lorne, Australia.Frederiksen P, Langaas S, Mbaye M (1990) NOAA AVHRR and GIS-based monitoring offire activity in Senegal - A provisional methodology and potential applications. Ch.17in Ecological Studies 84, Fire in the Tropical Biota (J. G. Goldammer, Ed.), Springer-Verlag, Berlin, pp.400-417.Hasset R (1998) Fire History Ground Truthing Program –Victoria River District.Henkel H (2000) Remote Sensing and image analysis. Department of Geodesy andPhotogrammetry. Royal institute of Technology, Stockholm.Hill GJE (1995) Remote sensing GIS and the CRC for sustainable development of tropicalsavannas: what are the implications for northern Australia? Proceedings of the 2 ndNorth Australian remote sensing and GIS forum, Darwin NT, Australia.Hugh E, Lambin EF (1998) Remote Sensing of Biomass Burning in Tropical Regions:Sampling Issues and Multisensor Approach. Remote Sens. Environ. 64:292-315.Jacklyn P, Russell- Smith J (1998) Proceedings from the Northern Australia Fire ManagementWorkshop. Tropical Savannas CRC.66
Kerke JA (1996) Bioregions of the Northern Territory. Bioregions of the NT DRAFTVersion 3.Kitchin M, Reid N (1999) Fire History – what can you do without it? Deriving the context fora fire ecology study by integrating satellite imagery and local information. AustralianBushfire Conference, Albury.Langaas S (2000) Oral communication.Langaas S (1987) Weather satellites for forest monitoring? A test of NOAA NDVI in theSudan-and Guinea zones of Sub-Sahara West-Africa - The Gambia. NorwegianComputing Center report no.790, Dept. of Geography, Univ. of Oslo., 111 pages.Langaas S (1998) Visit to Satellite Sensing Services/ Department of Land Administration.Mission Report.Langaas S, Ryan P, Russell-Smith J (1998) Assessing DOLA/FireWatch AVHRR fire scarmaps of the Kimberley, Western Australia 1997-1988, using airborne transect data.Lillesand TM, Kiefer RW (1994) Remote sensing and Image interpretation. John Wiley &Sons, Inc.Mather P (1987) Computer processing of remotely sensed images- An introduction. BiddlesLtd, Guildford and Kings’s Lynn.O’Neill T, Marthick J, Head L (1992) Integration of remote sensing and GIS in the eastKimberley. Geography Department, University of Wollongong. s.58-64.Pereira JMC, Sousa ACLS, Sousa AMO, Silva JMN, Santos TN, Carreiras JMB (1999)Spectral characteristics and discrimination of burnt areas. Departamento deEngenharia Florestal, Instituto Superior de Agronomia (Portugal). Chapter 7.Russell-Smith J (2000) Oral communication.Russell-Smith J, Ryan P, Klessa D, Waight G, Harwood R (1998) Fire regimes, firevegetation, and fire management of the sandstone Arnhem Plateau, monsoonalnorthern Australia. Journal of Applied Ecology.Russell-Smith J (1995) Fire management. In: Press T, Lea D, Webb A, Graham A (eds)Kakadu. Australian Nature Conservation Agency & North Australia Research Unit,ANU, pp 217-235.Ryan P, Allan GE (1998) Discussion paper: 1998 Fire History Ground Truthing Program.Stehman SV (1997) Selecting and Interpreting Measures of Thematic ClassificationAccuracy. Remote Sens.Environ. 62:77-89.Stehman SV (2000) Practical Implications of Design- Based Sampling Inference for ThematicMap Accuracy Assessment. Remote Sens.Environ. 72:35-45.Williams GD, Ludwig JA, Tongway D (1998) Torch, trees, teeth and tussocks: disturbance inthe tropical savannas of the Northern Territory (Australia).67
Williams RJ, Cook GD, Gill AM, Moore PHR (1999) Fire regime, fire intensity and treesurvival in a tropical savanna in northern Australia, Australian Journal of Ecology 24,50-59.Williams RJ, Gill AM, Moore PHR (1998) Seasonal Changes in Fire Behavior in a TropicalSavanna in Northern Australia, The Internationell Journal of Wildland Fires 8(4):227-239.Yates C, Russell-Smith J, May T (2000) Monitoring and assessment of fire regimes and theireffects on habitat for long-term Management of Bradshaw Field Training Area,Northern Territory, Bushfires Council NT.Yates C (2000), Oral communication.http://www.epa.gov/glnpo/oak/oak95/app-a.htm #Guiding Principles for a Vegetationhttp://www.rss.dola.wa.gov.au/noaafd/2000/SEP/NOAAfd.htmlhttp://savanna.ntu.edu.au/research/projects/firsav.html#managehttp://www.auslig.gov.auhttp://savanna.ntu.edu.au/information/r0/t1/r0_t1_8.htmlhttp://www.dar.dwe.csiro.au/http://www.nt.gov.au/bfc/68
10 Appendix10.1 Datasets: Scene 104/071 Sturt PlateauLandsat –5 MSSAcquired: 9-JUL 1995Centre: S15:26:57/E132:58:35Path/Row: 104/071Format: CRS BILLevel: 4 Bands: 1,2,3,469
Landsat –5 MSSAcquired: 27-SEP 1995Centre: S15:26:51/E132:55:30Path/Row: 104/071Format: CRS BILLevel: 4 Bands: 1234Landsat –5 MSSAcquired: 11-JUL 1996Centre: S15:26:51/E132:54:38Path/Row: 104/071Format: CCRS BILLevel: 4 Bands: 1234Landsat –5 MSSAcquired: 29-SEP-1996Centre: S15:26:42/E132:55:48Path/Row: 104/071Format: CCRS BILLevel: 4 Bands: 1234Landsat –5 MSSAcquired: 14-JUL- 1997Centre: S15:26:59/E132:56:00Path/Row: 104/071Format: CCRS BILLevel: 4 Bands: 1234Landsat –5 MSSAcquired: 2-OCT-1997Centre: S15:26:47/E132:56:25Path/Row: 104/071Format: CCRS BILLevel: 4 Bands: 1234Landsat –5 TMAcquired: 5-OCT- 1998Centre: S15:27:17/E132:57:07Path/Row: 104/071Format: CCRS BILLevel: 4 Bands :34Landsat –5 TMAcquired: 17-MAY 1999Centre: S15:25:49.54/E132:55:41.86Path/Row: 104/071Format: CCRS, BILBands: 1234567Landsat –7 ETM+Acquired: 30-SEP 1999Centre: S15:25:59.35/E132:53:27.7970
Path/Row: 104/071Format: FastL7A, BSQBands: 123456L6H78Landsat –7 ETM+Acquired: 02-OCT 2000-10-23Centre: S15:26:11.28/E132:55:01.64Path/Row: 104/071Format: FastL7A, BSQBands: 123456L6H7871