Kinetics Page 1 of 4 Clock Reaction KINETICS OF A CLOCK ...
Kinetics Page 1 of 4 Clock Reaction KINETICS OF A CLOCK ...
Kinetics Page 1 of 4 Clock Reaction KINETICS OF A CLOCK ...

Create successful ePaper yourself
Turn your PDF publications into a flip-book with our unique Google optimized e-Paper software.
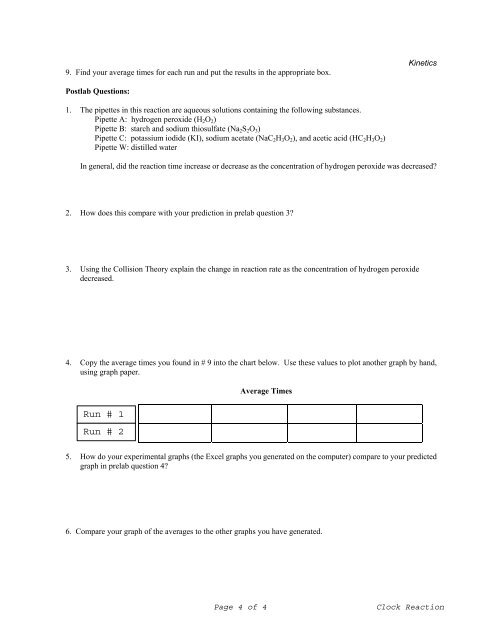
9. Find your average times for each run and put the results in the appropriate box.<strong>Kinetics</strong>Postlab Questions:1. The pipettes in this reaction are aqueous solutions containing the following substances.Pipette A: hydrogen peroxide (H 2 O 2 )Pipette B: starch and sodium thiosulfate (Na 2 S 2 O 3 )Pipette C: potassium iodide (KI), sodium acetate (NaC 2 H 3 O 2 ), and acetic acid (HC 2 H 3 O 2 )Pipette W: distilled waterIn general, did the reaction time increase or decrease as the concentration <strong>of</strong> hydrogen peroxide was decreased?2. How does this compare with your prediction in prelab question 3?3. Using the Collision Theory explain the change in reaction rate as the concentration <strong>of</strong> hydrogen peroxidedecreased.4. Copy the average times you found in # 9 into the chart below. Use these values to plot another graph by hand,using graph paper.Run # 1Run # 2Average Times5. How do your experimental graphs (the Excel graphs you generated on the computer) compare to your predictedgraph in prelab question 4?6. Compare your graph <strong>of</strong> the averages to the other graphs you have generated.<strong>Page</strong> 4 <strong>of</strong> 4<strong>Clock</strong> <strong>Reaction</strong>