Kinetics Page 1 of 4 Clock Reaction KINETICS OF A CLOCK ...
Kinetics Page 1 of 4 Clock Reaction KINETICS OF A CLOCK ...
Kinetics Page 1 of 4 Clock Reaction KINETICS OF A CLOCK ...

You also want an ePaper? Increase the reach of your titles
YUMPU automatically turns print PDFs into web optimized ePapers that Google loves.
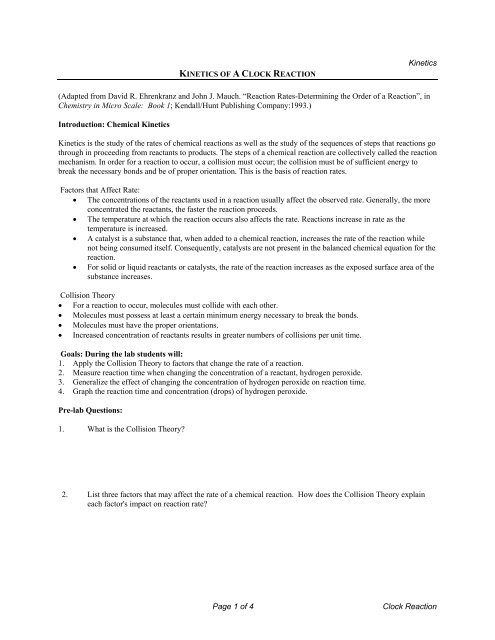
<strong>KINETICS</strong> <strong>OF</strong> A <strong>CLOCK</strong> REACTION<strong>Kinetics</strong>(Adapted from David R. Ehrenkranz and John J. Mauch. “<strong>Reaction</strong> Rates-Determining the Order <strong>of</strong> a <strong>Reaction</strong>”, inChemistry in Micro Scale: Book 1; Kendall/Hunt Publishing Company:1993.)Introduction: Chemical <strong>Kinetics</strong><strong>Kinetics</strong> is the study <strong>of</strong> the rates <strong>of</strong> chemical reactions as well as the study <strong>of</strong> the sequences <strong>of</strong> steps that reactions gothrough in proceeding from reactants to products. The steps <strong>of</strong> a chemical reaction are collectively called the reactionmechanism. In order for a reaction to occur, a collision must occur; the collision must be <strong>of</strong> sufficient energy tobreak the necessary bonds and be <strong>of</strong> proper orientation. This is the basis <strong>of</strong> reaction rates.Factors that Affect Rate:• The concentrations <strong>of</strong> the reactants used in a reaction usually affect the observed rate. Generally, the moreconcentrated the reactants, the faster the reaction proceeds.• The temperature at which the reaction occurs also affects the rate. <strong>Reaction</strong>s increase in rate as thetemperature is increased.• A catalyst is a substance that, when added to a chemical reaction, increases the rate <strong>of</strong> the reaction whilenot being consumed itself. Consequently, catalysts are not present in the balanced chemical equation for thereaction.• For solid or liquid reactants or catalysts, the rate <strong>of</strong> the reaction increases as the exposed surface area <strong>of</strong> thesubstance increases.Collision Theory• For a reaction to occur, molecules must collide with each other.• Molecules must possess at least a certain minimum energy necessary to break the bonds.• Molecules must have the proper orientations.• Increased concentration <strong>of</strong> reactants results in greater numbers <strong>of</strong> collisions per unit time.Goals: During the lab students will:1. Apply the Collision Theory to factors that change the rate <strong>of</strong> a reaction.2. Measure reaction time when changing the concentration <strong>of</strong> a reactant, hydrogen peroxide.3. Generalize the effect <strong>of</strong> changing the concentration <strong>of</strong> hydrogen peroxide on reaction time.4. Graph the reaction time and concentration (drops) <strong>of</strong> hydrogen peroxide.Pre-lab Questions:1. What is the Collision Theory?2. List three factors that may affect the rate <strong>of</strong> a chemical reaction. How does the Collision Theory explaineach factor's impact on reaction rate?<strong>Page</strong> 1 <strong>of</strong> 4<strong>Clock</strong> <strong>Reaction</strong>
<strong>Kinetics</strong>3. During this activity you will change the concentration <strong>of</strong> the reactant hydrogen peroxide. Predict how therate will change by decreasing the concentration <strong>of</strong> the hydrogen peroxide.4. Sketch the graph showing your predicted change in reaction time as the hydrogen peroxide concentrationdecreases.Safety: Always wear safety goggles on the MCL.Experimental Procedure:It is very important that you put exactly the right amount <strong>of</strong> drops in the wells. To get the feel <strong>of</strong> it, practice with yourwater pipette in one <strong>of</strong> the wells on the bottom row.Practice with the stopwatch so you know how to start it, stop it and clear it without looking. The person with thestopwatch must look at the reaction!Figure 1. Example <strong>of</strong> a 96-well plateRow 1 !Row 2 !Place your well plate on a piece <strong>of</strong> white paper to help with observing the color change during the reaction. The solutionsare already in the pipettes ready for you to use. You have a 96 well plate.1. Add water and solution A (hydrogen peroxide) to the wells in the first row <strong>of</strong> your well plateaccording to the number <strong>of</strong> drops given in the following diagram:Row 1# drops <strong>of</strong> solution A 4 4 4 3 3 3 2 2 2 1 1 1#drops <strong>of</strong> water, W 0 0 0 1 1 1 2 2 2 3 3 3<strong>Page</strong> 2 <strong>of</strong> 4<strong>Clock</strong> <strong>Reaction</strong>
2. Add solutions B and C to the wells in the second row <strong>of</strong> the well plate according to the number<strong>of</strong> drops given in the following diagram:<strong>Kinetics</strong>Row 2# drops <strong>of</strong> solution B 1 1 1 1 1 1 1 1 1 1 1 1# drops <strong>of</strong> solution C 4 4 4 4 4 4 4 4 4 4 4 43. Make sure the stopwatch is ready to use. Make sure your “water” pipette is empty. Using theempty water pipette, draw up the entire solution out <strong>of</strong> the first well in row 2. Add it to the first well in row 1.The person with the stopwatch must start the stopwatch the instant you mix the solutions. When the firstfaint change in color appears, stop the watch and record the reaction time in the data table provided. (DataTable for Run # 1.)DO NOT ROUND <strong>OF</strong>F THE TIMES!4. Use the distilled water in the small beaker to rinse out the pipette you used to move the solutionfrom row 2 to row 1. Squirt the rinse water into the empty beaker. Repeat the rinsing twomore times. Rinse the pipette three times after each use.5. Using the clean, rinsed pipette, pull the entire solution out <strong>of</strong> well 2 in row 2 and add it to well2, row 1. Start the stop watch as soon as the solutions are mixed and stop the watch when thefirst sign <strong>of</strong> color appears. Record the reaction time in the data table below.Data Table for Run # 1reactiontime (s)Avg. time6. Continue to move the contents <strong>of</strong> corresponding wells from row 2 to row 1, measuring and recording each reactiontime in the table above.7. After you have recorded all your times, go to a computer station, and plot a graph <strong>of</strong> your raw data usingMicros<strong>of</strong>t Excel. (Remember that your independent variable is on the x-axis and your dependent variable is on they-axis. Record your dependent variable in the first column and your independent variable in the second column.)An explanation <strong>of</strong> graphing with excel can be found A member <strong>of</strong> the MCL staff will help you. After looking atyour graph go back to your experimental station and repeat the experiment, using the wells in row 4 and 5. Youwill repeat steps 1 through 7.Data Table for Run # 2reactiontime (s)Avg. time<strong>Page</strong> 3 <strong>of</strong> 4<strong>Clock</strong> <strong>Reaction</strong>
9. Find your average times for each run and put the results in the appropriate box.<strong>Kinetics</strong>Postlab Questions:1. The pipettes in this reaction are aqueous solutions containing the following substances.Pipette A: hydrogen peroxide (H 2 O 2 )Pipette B: starch and sodium thiosulfate (Na 2 S 2 O 3 )Pipette C: potassium iodide (KI), sodium acetate (NaC 2 H 3 O 2 ), and acetic acid (HC 2 H 3 O 2 )Pipette W: distilled waterIn general, did the reaction time increase or decrease as the concentration <strong>of</strong> hydrogen peroxide was decreased?2. How does this compare with your prediction in prelab question 3?3. Using the Collision Theory explain the change in reaction rate as the concentration <strong>of</strong> hydrogen peroxidedecreased.4. Copy the average times you found in # 9 into the chart below. Use these values to plot another graph by hand,using graph paper.Run # 1Run # 2Average Times5. How do your experimental graphs (the Excel graphs you generated on the computer) compare to your predictedgraph in prelab question 4?6. Compare your graph <strong>of</strong> the averages to the other graphs you have generated.<strong>Page</strong> 4 <strong>of</strong> 4<strong>Clock</strong> <strong>Reaction</strong>