Quick History of Remote Sensing - Remote Sensing and GIS ...
Quick History of Remote Sensing - Remote Sensing and GIS ...
Quick History of Remote Sensing - Remote Sensing and GIS ...

You also want an ePaper? Increase the reach of your titles
YUMPU automatically turns print PDFs into web optimized ePapers that Google loves.
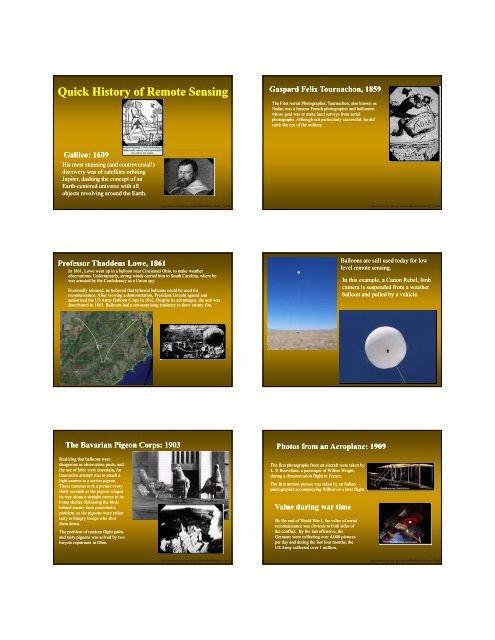
9/10/2007<strong>Quick</strong> <strong>History</strong> <strong>of</strong> <strong>Remote</strong> <strong>Sensing</strong>Gaspard Felix Tournachon, 1859The First Aerial Photographer, Taurnachon, also known asNadar, was a famous French photographer <strong>and</strong> balloonistwhose goal was to make l<strong>and</strong> surveys from aerialphotographs. Although not particularly successful, he didcatch the eye <strong>of</strong> the military.Galileo: 1609His most stunning (<strong>and</strong> controversial!)discovery was <strong>of</strong> satellites orbitingJupiter, dashing the concept <strong>of</strong> anEarth-centered universe with allobjects revolving around the Earth.http://observe.arc.nasa.gov/nasa/exhibits/history/history_0.htmlhttp://observe.arc.nasa.gov/nasa/exhibits/history/history_0.htmlPr<strong>of</strong>essor Thaddeus Lowe, 1861In 1861, Lowe went up in a balloon near Cincinnati Ohio, to make weatherobservations. Unfortunately, strong winds carried him to South Carolina, where hewas arrested by the Confederacy as a Union spy.Eventually released, he believed that tethered balloons could be used forreconnaissance. After viewing a demonstration, President Lincoln agreed <strong>and</strong>authorized the US Army Balloon Corps in 1862. Despite its advantages, the unit wasdeactivated in 1863. Balloons had a not-surprising tendency to draw enemy fire.Balloons are still used today for lowlevel remote sensing.In this example, a Canon Rebel, 8mbcamera is suspended from a weatherballoon <strong>and</strong> pulled by a vehicle.The Bavarian Pigeon Corps: 1903Realizing that balloons weredangerous as observation posts, <strong>and</strong>the use <strong>of</strong> kites were uncertain, Aninnovative attempt was to attach alight camera to a carrier pigeon.These cameras took a picture everythirty seconds as the pigeon wingedits way along a straight course to itshome shelter. Releasing the birdsbehind enemy lines presented aproblem, as the pigeons were rathertasty to hungry troops who shotthem down.The problem <strong>of</strong> r<strong>and</strong>om flight paths<strong>and</strong> tasty pigeons was solved by twobicycle repairmen in Ohio.Photos from an Aeroplane: 1909The first photographs from an aircraft were taken byL. P. Bonvillain, a passenger <strong>of</strong> Wilbur Wright,during a demonstration flight in France.The first motion picture was taken by an Italianphotographer accompanying Wilbur on a later flight.Value during war timeBy the end <strong>of</strong> World War I, the value <strong>of</strong> aerialreconnaissance was obvious to both sides <strong>of</strong>the conflict. By the last <strong>of</strong>fensive, theGermans were collecting over 4,000 picturesper day <strong>and</strong> during the last four months, theUS Army collected over 1 million.http://observe.arc.nasa.gov/nasa/exhibits/history/history_0.htmlhttp://observe.arc.nasa.gov/nasa/exhibits/history/history_0.html1
9/10/2007The Buzz Bomb: 1944Constance Baddington Smith, a Royal Air Forcephoto interpreter was one <strong>of</strong> the first to prove thevalue <strong>of</strong> aerial photos to identify top-secret activities<strong>of</strong> the other side using stereo photography. At firstshe did not know what she was looking at.She was the first to identify a launching site <strong>of</strong> theV-1 1B Buzz Bombs at the German experimental stationat Peenemunde on the Baltic Coast.The photo at the right is <strong>of</strong> a V-2 launching ramp.The V-2 Rocket is the predecessor <strong>of</strong> the launchvehicles we use today to launch remote sensingplatforms – among other things.The Cuban Missile Crisis <strong>and</strong> OthersU-2 Spy PlaneSR-71 BLACKBIRDhttp://observe.arc.nasa.gov/nasa/exhibits/history/history_0.htmlhttp://observe.arc.nasa.gov/nasa/exhibits/history/history_0.htmlhttp://www.fas.org/irp/imint/sr-71.htmhttp://www.fas.org/irp/imint/Global HawkPathfinderThe Global Hawk UAV belongs to a new series <strong>of</strong>advanced <strong>and</strong> autonomous remote sensing platformsable to fly across the globe with little or no supervision.Able to fly at 80,000 feet ASL, these new UAV’s arelightweight, autonomous, <strong>and</strong> can carry significant payloadsfor it’s size <strong>and</strong> weight.HeliosApollo ProgramApollo 8 returned the first pictures <strong>of</strong> the Earthfrom deep space (1968). Images from the Apollo 9multispectral four-lens camera were digitized <strong>and</strong>used to develop techniques for processing L<strong>and</strong>satdata, which, in 1969, was still four years away.With a 247 foot wingspan, Helios can fly above 93,000 feet ASL. Future modelswill be designed to stay al<strong>of</strong>t for more than 6 months. The Helios weighsapproximately 1,600lbs which translates to about .81lbs/sq. ft. <strong>of</strong> wing. The topspeed is 27mph with a take-<strong>of</strong>f speed <strong>of</strong> ~15 mph. The aircraft is solar poweredwith a polymer-electrolyte (oxygen/hydrogen) fuel cell for night time activity.2
9/10/2007Current Sensors <strong>and</strong> StrategiesEarth System ScienceAn overriding strategy <strong>of</strong> remotesensing organizations is to integratevarious sensors trained at differentsurface <strong>and</strong> atmospheric features tounderst<strong>and</strong> the parts that make up thewhole <strong>of</strong> the Earth System.Image taken from NASApromotional materialCommercial vs. Public <strong>Remote</strong> <strong>Sensing</strong> StrategiesCommercial industry moving toward spatialresolution <strong>and</strong> competition with aerial photographyPublic sensors moving towards increased spectral <strong>and</strong>radiometric resolution <strong>and</strong> focusing applications onearth based researchApplications• Riparian• Wetl<strong>and</strong>s• Agriculture• Forestry• UrbanSystem• 3-Cameras• SpectralRadiometer• Thermal CameraAirborne Digital CameraDigital Aerial Orthophotography (B/W)Digital OrthophotoquadsComplete, State-WideCoverage <strong>of</strong> Utah <strong>and</strong>Most other StatesFrom Virtual Utahhttp://earth.gis.usu.edu/utah4
9/10/2007Digital Color OrthophotographyNAIP (Nat. Color <strong>and</strong> NIR)NAIP Color 1 meter imageryfor UtahComplete, State-WideCoverage <strong>of</strong> Utah <strong>and</strong>Most other StatesFrom Virtual Utahhttp://earth.gis.usu.edu/utahBenefits <strong>of</strong> Temporal 1 MeterImagery• On L<strong>and</strong>sat 4,5, & 7• Spatial Resolution: 30/120 <strong>and</strong>15/30/90 (L7)• Radiometric Resolution: 256• Spectral Resolution: 7 spectralb<strong>and</strong>s Blue/Green, Green, Red,NIR, MIR, MIR, Thermal• 423 mile orbit• Oscillating mirror design acquiresdata with each sweep in bothdirections• One swath = 185 km x 474 meters• Each spectral b<strong>and</strong> has 16 detectorsexcept for the thermal b<strong>and</strong> whichhas 4 detectors.• 474 Meters / 16 Dectors = 29.625Meter Ground Resolution Reflected• 474 Meters/ 4 Detectors = 118.5Meter Ground Resolution Thermal• 16 day repeat cycleL<strong>and</strong>sat TMSPOT - 4• HRV -High resolution visible• March 24, 1998 launch date• Spatial Resolution: 20m color/ 10m b/w• Spectral Resolution: 4 spectral b<strong>and</strong>s green, red,nir, mir• Radiometric Resolution: 256• 832 km orbit• Repeat Interval: 36 days vertical/ 2.5 daysoblique• Sensor Type: Linear array (push-broom)• Panchromatic - 6,000 pixels/line• .51 - .73 µm• Multispectral - 3,000 pixels/line• .50 - .59 µm Green• .61 - .68 µm Red• .79 - .89 µm NIR•1.58-1.75 µm Short Wave Infraredwww.spot.com• One swath = 60 km• 2 HRV's that can be positioned two ways:• Large swath (both HRV's combined)• Off nadir up to 27 DegreesSatellite Probatoire d' Observation de la Terre(SPOT)http://www.eoc.nasda.go.jp/guide/satellite/satdata/spot_e.html5
9/10/2007SPOTMarco Isl<strong>and</strong>, South CarolinaSPIN 2Southeastern border <strong>of</strong> Camp W.G. Williams, UT at16m resolutionSPOT Multispectral false colorcomposite - 20m resolutionSPOT Panchromatic (B/W) image10m resolutionImages courtesy <strong>of</strong> the University <strong>of</strong> South CarolinaImage taken from Micros<strong>of</strong>t Terraserver (www.terraserver.com)SPIN 2Northern most extent <strong>of</strong> Utah Lake, at 1.5 m resolutionSPIN-2 is panchromatic, 2 meter resolution Russian satellite image dataSPIN 2Data Available from Aerial Images, Inc. - www.spin-2.comImage taken from Micros<strong>of</strong>t Terraserver (www.terraserver.com)L<strong>and</strong> Satellite (LANDSAT) 7Katrina Damage toNew Orleans09/01/05http://www.eoc.nasda.go.jp/guide/satellite/sen_menu_e.html6
9/10/2007IKONOSIKONOS is the world’s first commercialone-meter resolution B/W <strong>and</strong> 4 metercolor Earth imaging satellite. IKONOSwill be able to produce imagery that canbe used for a variety <strong>of</strong> marketapplications including urban planning,environmental monitoring, mapping,natural disaster assessment,http://www.spaceimage.com/newsroom/releases/1999/launch924.htmIndian <strong>Remote</strong> <strong>Sensing</strong> (IRS)PanchromaticPan 0.5-0.75 µm5.8 m spatial resolution70 km swathStereoRepeat coverage: 24 days at equatorRevisit: 5 days with ± 26° <strong>of</strong>f-nadir viewingLISS-IIIIRS-1C 1995WiFSBlue ----Red 0.62-0.68 068µmGreen 0.52-0.59 µmNIR 0.77-0.86 µmRed 0.62-0.68 µm188 m spatial resolutionNear Infrared 0.77-0.86 µm774 km swathSW Infrared 1.55-1.70 µmRepeat coverage: 5 days at equator23 m spatial resolution for all b<strong>and</strong>s,except 70 m for SW InfraredContact Information:142 km swath B<strong>and</strong>s 2,3,4www.spaceimaging.com148 km swath B<strong>and</strong> 5Repeat coverage: 24 days at equatorTape RecorderTERRA(EOS-AM1)Clouds <strong>and</strong> the Earth's Radiant Energy System ExperimentThe Multi-angle Imaging SpectroRadiometerCERESMISRCERES products include both solar-reflected <strong>and</strong>Earth-emitted radiation from the top <strong>of</strong> theatmosphere to the Earth's surface.Analyses <strong>of</strong> the CERES data, which build upon thefoundation laid by previous missions …. will lead toa better underst<strong>and</strong>ing <strong>of</strong> the role <strong>of</strong> clouds <strong>and</strong> theenergy cycle in global climate change.http://asd-www.larc.nasa.gov/ceres/ASDceres.htmlIn this image, heat energy radiated from the earth is shown invarying shades <strong>of</strong> yellow, red, blue <strong>and</strong> whitehttp://visibleearth.nasa.gov/Sensors/Terra/CERES.htmlThe change in reflection at different view anglesaffords the means to distinguish different types <strong>of</strong>atmospheric particles (aerosols), cloud forms, <strong>and</strong>l<strong>and</strong> surface covers. Combined with stereoscopictechniques, this enables construction <strong>of</strong> 3-dimensional models <strong>and</strong> more accurate estimates<strong>of</strong> the total amount <strong>of</strong> sunlight reflected by Earth'sdiverse environments.http://www-misr.jpl.nasa.gov/In the left image, color variations indicate how different parts <strong>of</strong>the scene reflect light differently at blue, green, <strong>and</strong> redwavelengths; in the right image color variations show how thesesame scene elements reflect light differently at different angles <strong>of</strong>viewhttp://visibleearth.nasa.gov/Sensors/Terra/MISR.html7
9/10/2007Measurements <strong>of</strong> Pollution in the Troposphere (MOPITT)Moderate Resolution Imaging SpectroradiometerMOPITTDuring the five-year mission, MOPITT willcontinuously scan the atmosphere below it toprovide the world with the first long-term,global measurements <strong>of</strong> carbon monoxide <strong>and</strong>methane gas levels in the lower atmospherehttp://www.science.sp-agency.ca/J1-MOPITT(Eng).htmThis MOPITT image shows the relative amount <strong>of</strong> CO over NorthAmerica from March 5-7, 2000http://visibleearth.nasa.gov/Sensors/Terra/MOPITT.htmlMODISThe MODIS Instrument will view the entire Earth's surface every1 to 2 days, acquiring data in 36 spectral b<strong>and</strong>s. These data willimprove our underst<strong>and</strong>ing <strong>of</strong> global dynamics <strong>and</strong> processesoccurring on the l<strong>and</strong>, in the oceans, <strong>and</strong> in the loweratmosphere. MODIS will play a vital role in the development <strong>of</strong>validated, global, interactive Earth system models able to predictglobal change accurately enough to assist policy makers inmaking sound decisions concerning the protection <strong>of</strong> ourenvironment.http://modis.gsfc.nasa.gov/The Nile river <strong>and</strong> delta winds through Egypt in this imagefrom MODIS. The Sinai peninsula <strong>and</strong> Red Sea are on theright.http://visibleearth.nasa.gov/Sensors/Terra/MODIS.htmlApril 28 th , 2004Fires in China <strong>and</strong> Russia causedmostly by agricultural burning.captured by the ModerateResolution Imaging Spectrometer(MODIS).April 28th, 2004Dust storm in Nevada capturedby the Moderate ResolutionImaging Spectrometer (MODIS)Flooding along the MississippiRiver, ArkansasTemporal Frequency <strong>of</strong> MODISSeptember 1, 2007September 2, 2007September 3, 2007September 4, 2007September 5, 2007September 6, 2007April 17 th , 2004 April 27 th , 20048
9/10/2007Advanced Spaceborne Thermal Emission <strong>and</strong> Reflection radiometerJapanese Earth Resources Satellite -1 (JERS-1)ASTERThe primary objective for the ASTER mission is toobtain high spatial resolution global, regional <strong>and</strong> localimages <strong>of</strong> the Earth in 14 spectral b<strong>and</strong>s.ASTER is a cooperative effort between NASA <strong>and</strong> Japan'sMinistry <strong>of</strong> International Trade <strong>and</strong> Industry, with thecollaboration <strong>of</strong> scientific <strong>and</strong> industry organizations in bothcountries. The ASTER instrument consists <strong>of</strong> three separateinstrument subsystems. Each subsystem operates in adifferent spectral region <strong>and</strong> has its own telescope(s).http://asterweb.jpl.nasa.gov/San Francisco Bay Areahttp://visibleearth.nasa.gov/Sensors/Terra/ASTER.htmlJERS-1 is a joint project between theNational Space Development Agency <strong>of</strong>Japan (NASDA) <strong>and</strong> the Ministry <strong>of</strong>International Trade <strong>and</strong> Industry(MITI).The JERS-1 mission is focused on Earthresources, geology, agriculture, forestry,l<strong>and</strong> use, sea ice monitoring <strong>and</strong> coastalmonitoring. It is a box type satellite in asun synchronous sub-recurrent orbit.Gr<strong>and</strong> Canyon, AZhttp://www.asf.alaska.edu/source_documents/jers1_source.htmlRadarsatThe RADARSAT system was developedunder the management <strong>of</strong> the CanadianSpace Agency (CSA) in cooperation withprovincial governments <strong>and</strong> the privatesectorAIRPORTMAUIAt the heart <strong>of</strong> RADARSAT is anadvanced radar sensor called SyntheticAperture Radar (SAR). SAR is amicrowave instrument that sends pulsedsignals to Earth <strong>and</strong> processes thereceived reflected pulses.http://www.space.gc.ca/csa_sectors/earth_environment/radarsat/default.asp9