City of Fredericton Waste & Sewer Long-Term Financial Plan (PDF)
City of Fredericton Waste & Sewer Long-Term Financial Plan (PDF)
City of Fredericton Waste & Sewer Long-Term Financial Plan (PDF)

You also want an ePaper? Increase the reach of your titles
YUMPU automatically turns print PDFs into web optimized ePapers that Google loves.
• Encourage customers to conserve water and to be aware <strong>of</strong> the environmental impact <strong>of</strong> waterconsumption and wastewater treatment• Sustainable and stable funding for infrastructure reinvestment to address current and futureservice requirements, the infrastructure deficit and growth• Equity for all users with no one group subsidizing another group• Funding solely by user rates or leveraging other levels <strong>of</strong> government funding with no debtfinancing• Rates to remain competitive with surrounding communities• Avoidance <strong>of</strong> rate shock with no drastic increases to user rates in any given year• Achieve efficiencies through Lean Six Sigma methodology to contain operational costs• As operating efficiencies are achieved, funding is reallocated to address the infrastructure deficit• Align fixed and variable expenditures with the revenue rate structure• Commit predictable, stable Federal Gas Tax Funding to the water and sewer infrastructuredeficit to keep user rates affordableInfrastructure ReinvestmentA joint study with the Canadian Construction Association, the Canadian Public Works Association, theCanadian Society for Civil Engineering and the Federation <strong>of</strong> Canadian Municipalities was completed.With input from many other Canadian organizations and municipalities, the group issued a CanadianInfrastructure Report Card in September 2012 that stated:“Infrastructure is the foundation <strong>of</strong> our society and our economy. The hidden costs <strong>of</strong>deteriorating, outdated and under-performing infrastructure – to human welfare, property, andeconomic activity – are too great to be ignored. Whether acknowledged or not, these costs willcontinue to grow as infrastructure ages and deteriorates.” 1Based on this study, it was estimated that replacement costs related to water and wastewaterinfrastructure that were in “fair” to “very poor” condition across Canada was $25.9 billion for water and$30.9 billion for wastewater infrastructure.“The report card emphasizes the importance <strong>of</strong> having an asset-management system in place, inorder to establish practices that will increase the longevity <strong>of</strong> the assets and optimizeinvestments in maintenance and rehabilitation” 1The water and sewer infrastructure deficit for the <strong>City</strong> <strong>of</strong> <strong>Fredericton</strong> sits at $130 million at December31, 2012. With a replacement value <strong>of</strong> infrastructure at $507 million, this means that over 25% <strong>of</strong> the<strong>City</strong>’s water and sewer infrastructure is past its recommended useful life. This is not sustainable as the<strong>City</strong> is spending operating dollars on breaks and fixes that could otherwise be allocated to replacing oldinfrastructure.1 Canadian Infrastructure Report Card, Volume 1: 2012 – Municipal Roads and Water Systems;www.canadianinfrastructure.ca3
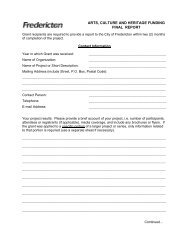
A long term infrastructure reinvestment strategy is needed. This <strong>Plan</strong> addresses this issue and providesthe strategy needed to ensure that the investment in the systems is maintained for future generations.$17,838,653 $1,872,461$29,345,316$37,200,435$526,565$15,013,973Water and <strong>Sewer</strong> Infrastructure - Replacement Cost - $507 Millionat December 31, 2012Machinery & Equipment$5,947,880$2,654,143$2,031,046$5,578,424$189,024,054VehiclesLagoonsSanitary <strong>Sewer</strong>sWater Mains<strong>Waste</strong>water Lift StationsStorage Buildings<strong>Waste</strong>water Treatment <strong>Plan</strong>tWater Pumping StationsWater Storage FacilityWater Treatment <strong>Plan</strong>t$200,884,347WellsWater and <strong>Sewer</strong> Infrastructure Deficit - $130 Millionat December 31, 2012$795,887$3,539,446$599,101$3,790,453Machinery & EquipmentVehicles$60,267,565$17,063,285Lagoons$7,929,127Sanitary <strong>Sewer</strong>s<strong>Waste</strong>water Lift Stations<strong>Waste</strong>water Treatment <strong>Plan</strong>tWater Pumping Stations$18,925,904Water Storage Facility$5,360,783$1,926,949$9,964,161Water Treatment <strong>Plan</strong>tWater MainsWellsEssentially the infrastructure deficit means the <strong>City</strong> is relying on infrastructure that has met or exceededits useful life based on industry standards. While this by no means indicates that the system is unsafetoday, it can and has resulted in breaks in the underground infrastructure and other failures. Thisincreases the cost to operate and maintain the infrastructure as the <strong>City</strong> must make repairs that would4
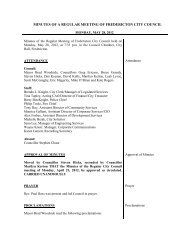
not otherwise be required with renewed infrastructure. See Appendix I for a breakdown <strong>of</strong> Water and<strong>Sewer</strong> infrastructure by age.While the system is safe, every time there is a break in a line, it increases the risk <strong>of</strong> contamination.There are also other problems that arise due to breaks that include, but are not limited to, the reductionor loss <strong>of</strong> water or sewer services, traffic disruptions for unplanned underground infrastructure repair,loss to businesses if their operations are affected and loss <strong>of</strong> treated water.After the 1973 amalgamation, the <strong>City</strong> focused on expansion <strong>of</strong> the system to the amalgamated areas <strong>of</strong>the <strong>City</strong>. In the late 2000’s, the focus has shifted to renewing infrastructure in problem areas, yet thereis such a backlog <strong>of</strong> aging infrastructure that it is not possible to catch up with the current level <strong>of</strong>funding.Due to the long term nature <strong>of</strong> water and sewer infrastructure, there should be an investment <strong>of</strong> 2% <strong>of</strong>the total replacement value <strong>of</strong> infrastructure per year according to industry standards. This equates tospending $10 million annually with increases each year to keep up with inflation. Currently, the <strong>City</strong> isnot meeting this target; however the benefit <strong>of</strong> Federal Gas Tax Funding brings the <strong>City</strong> closer to thisgoal. In 2013, the <strong>City</strong>’s capital budget for infrastructure reinvestment is $8.7 million with the inclusion<strong>of</strong> Federal Gas Tax Funding.$12,000,000Infrastructure Reinvestment Funding Gap$10,000,000$8,000,000$6,000,000$4,000,000$2,000,000$-2010 2011 2012 2013Funding through user ratesInfrastructure Reinvestment RequirementFunding through user rates and Gas TaxWith approximately 17,000 connected users, each user’s investment is $30,000 with the infrastructuredeficit totalling over $7,500 per user. To achieve industry standards for infrastructure reinvestmentthrough user pay, the <strong>City</strong> would require $600 annually per user solely for infrastructure reinvestment.5
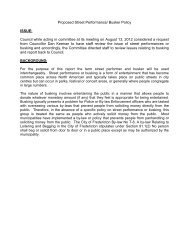
60%Water and <strong>Sewer</strong> Infrastructure Report Card52%40%20%21%27%0%GOOD FAIR POORBased on life cycle alone, the infrastructure deficit report card shows that over half <strong>of</strong> the <strong>City</strong> water andsewer infrastructure is close to or has passed its recommended useful life. This does not mean that theinfrastructure is inadequate or is not providing safe services; it means that the <strong>City</strong> is spending moremoney on operations that could be used for infrastructure reinvestment.The greatest concern surrounds the underground infrastructure. This is a much greater portion <strong>of</strong> thesystem’s infrastructure. While a significant portion <strong>of</strong> the infrastructure is not past recommended usefullife, if we do not strategically address the issue, that cross-section <strong>of</strong> infrastructure will deteriorate tounmanageable levels. This will cause more issues with breaks and fixes that require attention and can becostly to both the <strong>City</strong> and customers.In addition to the existing infrastructure requiring maintenance and replacement, there are still someareas <strong>of</strong> the <strong>City</strong> that do not have water and sewer services available or the system is in some waydeficient. Due to the fact that there is a large infrastructure deficit that needs to be addressed forexisting infrastructure, it is difficult to address many expansion projects. The <strong>City</strong>’s 2013 budget has 94%<strong>of</strong> the pay-as-you-go capital funding program allocated to replacement with 6% for extension <strong>of</strong> newinfrastructure.It is recommended that a minimum <strong>of</strong> 90% <strong>of</strong> the pay-as-you-go capital allotment each year be allocatedto infrastructure renewal leaving a maximum <strong>of</strong> 10% for infrastructure extension. This would allow forplanned and phased expansion projects within the funding allocation.This consistent allotment will help to ensure that old infrastructure is being replaced, while allowing the<strong>City</strong> to continue to expand the system where it is currently missing key components. See Appendix II forkey target areas for infrastructure reinvestment and expansion over the next 10 years.While infrastructure in new developments is fully funded upfront by developers, this adds new users tothe systems, and the new infrastructure then needs to be maintained in perpetuity. It is important thatthis is kept in mind and the <strong>City</strong> starts planning for the replacement <strong>of</strong> this infrastructure in the future inorder to reach full sustainability. By doing so, this will lessen the burden on future generations.While the infrastructure deficit is based on existing infrastructure, consideration must be given forchanges required to infrastructure to address climate change, laws and regulation changes to reduceenvironmental impact and to protect the environment. While the full impact <strong>of</strong> these changes is not6
fully known, these factors cannot be ignored and the <strong>Plan</strong> must adapt in order to accommodate thesechanges over time.Due to past prudent management <strong>of</strong> the systems, the <strong>City</strong> has the benefit <strong>of</strong> having infrastructure inplace that allows the <strong>City</strong> to adapt more quickly to new Federal safe drinking water and wastewatertreatment regulations than many other municipalities. Standards issued by the Canadian Council <strong>of</strong>Ministers <strong>of</strong> the Environment (CCME) relating to wastewater will have a much smaller impact on the <strong>City</strong><strong>of</strong> <strong>Fredericton</strong> than many other municipalities across Canada.It is estimated that in order to comply with these new standards, the <strong>City</strong> will need to invest $6 - $8million in areas such as the Lincoln Lagoon and Garden Creek Lagoon. These changes, by law, must beaddressed as early 2020 and as late as 2040 depending on the risk assessment <strong>of</strong> the system. Due to thefact that these new regulations are above and beyond the <strong>City</strong>’s current standard, the <strong>City</strong> will beworking with other levels <strong>of</strong> government to fund these changes. This will allow the <strong>City</strong> to lessen thefunding burden on the user.BillingA typical <strong>City</strong> <strong>of</strong> <strong>Fredericton</strong> quarterly water and sewer bill has three main components:• Meter rental charge – this charge varies by size <strong>of</strong> meter• Quarterly Service charge – this charge is a flat rate charged to all users for both water andsewer service• Commodity charge – this is a rate charged per cubic meter (m 3 ) for both water and sewersupplyBased on the industry standard usage <strong>of</strong> 272 m 3 per household <strong>of</strong> four people, the average annualcharge for water and sewer services equates to $718 or $179.50 quarterly. Based on actual consumptiondata for 2012, the average <strong>Fredericton</strong> household consumes just over 194.55 m 3 <strong>of</strong> water annually. Thisusage equates to an average annual bill <strong>of</strong> $591 or $147.85 quarterly.Connected but unmetered customers have full use <strong>of</strong> the system, however, there is no meter installedon the property and consumption cannot be monitored. The rates for this type <strong>of</strong> customer are set tomirror what the water and sewer bill would be for a user based on the industry standard usage <strong>of</strong> 272m 3 annually for an average family.Unconnected customers are those that have services running adjacent to their property but are notconnected to the system. These customers pay the equivalent <strong>of</strong> the quarterly service charge.7
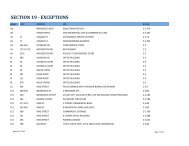
RatesHistoryBetween 1997 and 2004 there were minimal water and sewer rate increases. In 2005, the <strong>City</strong>recognized the need for additional revenue in order to continue with the high level <strong>of</strong> service provided.As such, there were four years <strong>of</strong> volumetric rate increases <strong>of</strong> 2₵ per year for 2005 – 2008.In 2008, it was determined that the increase was not sufficient to maintain operations, and addressinfrastructure renewal and extensions. As such, Council at the time agreed to a five year rate strategythat provided an inflationary increase <strong>of</strong> 2.5% and an incremental increase <strong>of</strong> 5% in order to startaddressing the infrastructure reinvestment backlog (infrastructure deficit). This strategy covered theperiod <strong>of</strong> 2009 – 2013.As 2013 is the final year for this strategy, it is important that a longer term view is taken on how ratesshould be structured in the future. This <strong>Plan</strong> shows that in order to continue with a solid infrastructurereinvestment strategy, additional revenue is required. The objective is to continue with predictable andmanageable increases to avoid rate shock while continuing to provide a high quality <strong>of</strong> service.RecommendationsBased on the <strong>Plan</strong> forecast, it is recommended that the <strong>City</strong> increase revenue by 5% each and every yearfor the life <strong>of</strong> this 20 year plan. This allows the <strong>City</strong> to properly address the infrastructure deficit andallows for stable rate increases. Increasing revenue by 3% will maintain the status quo for the deficit, 4%revenue increases will reduce the deficit but will still leave a significant amount <strong>of</strong> old infrastructure,while a 5% increase in revenue annually will effectively eliminate the deficit in 20 years. Therecommended increase will also provide for continued funding towards infrastructure renewal andexpansion for future generations.$140$120$100$80$60$40$20$-Infrastructure Deficit based on 20 year Reinvestment(in Millions)$125.24$113.19$70.34$21.543% revenueincrease4% revenueincrease5% revenueincrease8
The benefit for <strong>City</strong> <strong>of</strong> <strong>Fredericton</strong> customers is that unlike other municipalities in Canada and the US,the <strong>City</strong> can achieve the goals <strong>of</strong> the <strong>Plan</strong> through smaller and predictable rate increases over time. Forexample, the <strong>City</strong> <strong>of</strong> Halifax has requested rate increases to meet system demands <strong>of</strong> an additional 9.5%and 9.8% for water services for fiscal years 2013/2014 and 2014/2015 respectively and 15% and 21% forsewer services for fiscal years 2013/2014 and 2014/2015 respectively 2 .Each year the <strong>Plan</strong> forecast is updated through the budget process. The current status <strong>of</strong> the system,infrastructure reinvestment requirements and revenue and funding needs are reviewed to assess theprogress in achieving the goals <strong>of</strong> the <strong>Plan</strong>. It is important that a long term financial plan be flexible andadaptable to change with the economic environment.Current Comparative Rates with other New Brunswick MunicipalitiesThe <strong>City</strong> <strong>of</strong> <strong>Fredericton</strong> has the lowest residential water and sewer bills <strong>of</strong> the three largestmunicipalities in New Brunswick. <strong>City</strong> <strong>of</strong> <strong>Fredericton</strong> residents also pay less for water and sewer servicesthan residents <strong>of</strong> nearby Oromocto and New Maryland.$1,200$1,000$800$600$400$200$-Average Residential Annual Water & <strong>Sewer</strong> Bill for 2013$994 $1,008$886$800$718<strong>Fredericton</strong> Oromocto * Moncton New Maryland Saint John **Annual Charge*Majority <strong>of</strong> wastewater treated at CFB Gagetown**Flat Rate charged to majority <strong>of</strong> usersThe comparative rates are based on the industry standard <strong>of</strong> 272 m 3 for a single family <strong>of</strong> four.Rate RecommendationsThe <strong>Plan</strong> is a 20 year plan to provide safe and sustainable systems while maintaining rates at a level thatis affordable and predictable for the customer. The rate recommendations that are included with thisplan have been limited to five years due to the fact that as more information is obtained surroundingchange to the number <strong>of</strong> connections, consumption and spending trends, the components for revenuegeneration will we reassessed.2 Nova Scotia Utility and Review Board Decision 2013 NSUARB 127 M05463;http://nsuarb.novascotia.ca/sites/default/files/decisions/hrwc_decision-_june_24.13.pdf9
With the movement to conservation measures, more efficient appliances and the trend <strong>of</strong> smallerfamilies, there has been a downward trend in consumption <strong>of</strong> water per customer in recent years. Whilethe <strong>City</strong> <strong>of</strong> <strong>Fredericton</strong> has not noticed drastic declines, it is important that revenue generated matchexpenses for fixed versus variable costs. Currently, more revenue is generated based on the volumetricconsumption by customers than by the base rates. The fixed expenses, however, are proportionatelygreater than the variable expenses.It is recommended that revenues are adjusted to reflect the fact that, over time, if consumption doesdecrease as a result <strong>of</strong> conservation, that revenues are impacted proportionately to adjustments inexpenses for provision <strong>of</strong> water. As such, recommended adjustments to rates will balance the fixedversus variable ratios for revenues and expenses. This allows for better matching and ensures aconsistent funding model for reinvestment in infrastructure.Quarterly Rates – it is recommended that the majority <strong>of</strong> the adjustment to revenue is related to thefixed quarterly rates for both water and sewer services to close the gap between variable and fixedrevenues and expenses. As such, the quarterly rate increases recommended for the next five years areas follows:YearQuarterly Rate2014 $36.312015 $39.842016 $43.642017 $47.732018 $52.13Meter Rental Rates – it is recommended that the meter rental rates remain unchanged at the followingamounts:Meter SizeQuarterly RateResidentialCommercial20 millimetre or smaller $2.0025 millimetre $3.0040 millimetre $6.0050 millimetre $9.0075 millimetre $30.00100 millimetre $40.00150 millimetre $60.00200 millimetre and greater $80.00Commodity Charge – due to the fact that there is a mismatch between revenue generated on a variableversus fixed basis and the expenses incurred on a variable versus fixed basis, it is recommended that thevariable commodity charge be adjusted at a lower rate than the quarterly service charge. This changewill better reflect the fact that as users become more conservative with water usage, the utility willgenerate sufficient base revenue to cover the fixed costs associated with the services.10
In order to promote conservation efforts by customers, it is recommended that the commodity chargefor both water and sewer consumption increase by 1₵ each year. The current commodity charge formetered users is $0.82 per m 3 for both water and sewer consumption based on meter readings.Water & <strong>Sewer</strong> 5 Year Rate StrategyActualR E C O M M E N D E D2013 2014 2015 2016 2017 2018Water rate (per m 3 ) $0.82 $0.83 $0.84 $0.85 $0.86 $0.87<strong>Sewer</strong> rate (per m 3 ) $0.82 $0.83 $0.84 $0.85 $0.86 $0.87Water & <strong>Sewer</strong> Rate $1.64 $1.66 $1.68 $1.70 $1.72 $1.74Quarterly Service Charge $66.10 $72.62 $79.68 $87.28 $95.46 $104.26Quarterly Meter Rental $2.00 $2.00 $2.00 $2.00 $2.00 $2.00Annual Cost * $591 $622 $654 $688 $725 $764Percent Increase 7.6% 5.1% 5.2% 5.3% 5.3% 5.4%* For a typical family based on 195 m 3 consumption for each <strong>of</strong> water and sewer.With the recommended rate increases for the 5 year period, the <strong>City</strong> <strong>of</strong> <strong>Fredericton</strong> rates will still belower than those charged by both Saint John and New Maryland today. It is also important to note thatas other municipalities progress in asset management, address infrastructure deficits and comply withFederal safe drinking water and wastewater treatment standards, their rates will most likely increasesubstantially over time.Flat Rate for Unmetered Customers – At the end <strong>of</strong> 2012, there were 45 unmetered connections to the<strong>City</strong>’s water system and 54 unmetered connections to the <strong>City</strong>’s sewer system. The <strong>City</strong> has beenworking to reduce the number <strong>of</strong> unmetered customers as it does not meet the equality principlewhereas unmetered customers have no incentive to conserve water as they are not paying a volumetriccharge. It is recommended that the flat fee be based on what an industry average single family <strong>of</strong> fourwould typically use. The current rate is $57.72 for each service per quarter. The recommendation is thatthe quarterly flat rate for each service increase as follows:YearFlat Rate2014 $58.442015 $59.122016 $59.802017 $60.482018 $61.16Commercial Bulk Water Rates – the current bulk water rate is $1.00 per m 3 . This rate was initially set inthe 1990’s to be two times the commodity rate for water, which at the time was $0.50. It isrecommended that the bulk water rate increase to be the equivalent <strong>of</strong> two times the commodity ratefor water plus a premium rate to fully recover the cost <strong>of</strong> operating and capital replacement <strong>of</strong> the fillingstations for a total <strong>of</strong> $2.19. This rate will reflect the fact that the <strong>City</strong> maintains the seven dedicated11
filling stations for these customers on top <strong>of</strong> the provision <strong>of</strong> the bulk water. It is also recommendedthat as commodity rate increases occur in the future, that the bulk water rate increase accordingly to acost <strong>of</strong> $2.27 per m 3 at the end <strong>of</strong> the five year rate strategy.To fill a large tanker truck costs $20 per load while the delivery fee charged is $220 - $360 depending ondistance travelled. The adjusted fee will result in an additional $23.40 in 2014 for a total cost <strong>of</strong> $43.40.The cost <strong>of</strong> the water is a small percentage <strong>of</strong> the total cost for the company to provide the service. It isalso important to note that the majority <strong>of</strong> end consumers <strong>of</strong> this service are outside <strong>City</strong> limits.Commercial Business Private Hydrant Fee – for consistent fire protection, the <strong>City</strong> maintains both publicand private hydrants throughout the <strong>City</strong>. For all <strong>City</strong> owned hydrants, the General Fund throughproperty tax revenue, pays $1,000,612 annually to the Water and <strong>Sewer</strong> Fund for hydrant maintenancefor Fire Protection. This equals $498.81 per hydrant and includes costs for all hydrant maintenanceincluding snow removal. For privately owned hydrants, mainly commercial properties, the <strong>City</strong> currentlycharges $250 per hydrant annually. The private hydrants are maintained to the same standard as the<strong>City</strong> owned hydrants with the exception <strong>of</strong> snow removal. It is therefore recommended that the rate beincreased to better reflect the cost <strong>of</strong> the service provided and adjusted for the snow removalcomponent. It is recommended that the rates be increased to $350 starting in 2014.Building Fire Protection Service Fee – It is recommended that the <strong>City</strong> introduce a new Building FireProtection Service Fee to customers with large fire protection systems (sprinklers) installed. Thesecustomers are typically commercial or multi-unit residential properties that are required to havesprinkler systems due to Building Code. In order to provide adequate service for these systems, the <strong>City</strong>is required to provide both infrastructure and water supply that is above what would typically berequired for an average customer. By introducing this fee, it will achieve a more equitable balance <strong>of</strong>revenue by customer for the services provided.Due to this additional safety requirement, building owners with a fire protection system receive buildinginsurance premium discounts on their properties.It is recommended that the fee be $150 per year for each sprinkler system. For comparative purposes,similar charges in Halifax, NS are in the range <strong>of</strong> $170 - $218, Hamilton, ON rates range from $3 - $192,London, ON rates vary between $15 - $500 and Lethbridge, AB charges between $365 - $2,664.50.Missed Appointment Fee<strong>City</strong> staff set appointments with customers to test and/or replace water meters to ensure the metersare in proper working order. If the customer confirms the appointment and then misses theappointment to meet with staff, this takes the staff member away from other appointments or duties.As such, it is recommended that the <strong>City</strong> introduce a Missed Appointment Fee to address thisinefficiency as a result <strong>of</strong> having missed appointments without a minimum <strong>of</strong> 24 hours notice. It isrecommended that the fee be $50 per missed appointment.12
Funding for Reinvestment in InfrastructureRecently, there were long term infrastructure funding announcements from the Federal Government.One <strong>of</strong> those funding announcements was the permanent continuation <strong>of</strong> the Gas Tax Funding Program.The last round <strong>of</strong> Federal Gas Tax Funding from 2010 – 2013 has allowed the <strong>City</strong> to invest an additional$14.8 million into infrastructure reinvestment and extension. These are projects that the <strong>City</strong> needed todo but without this funding would have resulted in delays to the projects. These projects include:• Springhill Reservoir• Northside Sanitary Trunk• Friel Street Water and Sanitary <strong>Sewer</strong>• <strong>Long</strong>wood Drive Water and Sanitary <strong>Sewer</strong>• Edinburgh Street Water and Sanitary <strong>Sewer</strong>• Clark Street Water and Sanitary <strong>Sewer</strong>• Regent Street Water and Sanitary <strong>Sewer</strong>• Westview Street Water and Sanitary <strong>Sewer</strong>• William Street Water and Sanitary <strong>Sewer</strong>• Wright Street Water and Sanitary <strong>Sewer</strong>• Parklyn Court Water and Sanitary <strong>Sewer</strong>• Hanson Street Water and Sanitary <strong>Sewer</strong>• McAdam Avenue Water and Sanitary <strong>Sewer</strong>• Clarence Avenue Water and Sanitary <strong>Sewer</strong>It is recommended that they <strong>City</strong> continue to apply Federal Gas Tax Funding dollars to water and sewerinfrastructure renewal for the next 10 years. There are a number <strong>of</strong> benefits to this funding strategy thatinclude but are not limited to:• Allowing the <strong>City</strong> to continue a more progressive and focused infrastructure renewal program toaddress the $130 million infrastructure deficit• Reducing operating costs by replacing problem infrastructure quicker than would be addressedwith the regular capital budget, thereby reducing the number <strong>of</strong> costly breaks in the system• Not adding to operating costs as the costs to maintain the infrastructure is already included forexisting infrastructure, and;• Allows lower rate increases for customers by <strong>of</strong>fsetting some <strong>of</strong> the required revenue thoughthe Federal Gas Tax Fund13
$140$120$100$80$60$40$20$-Infrastructure Deficit based on Reinvestment$125.24(in Millions)$67.03$21.545%RevenueIncrease -No Gas Tax5%RevenueIncrease -Gas TaxEquity for All UsersCurrently, residential customers are the largest customer group based the number <strong>of</strong> connections, thewater consumed and revenue received for the services provided.Number <strong>of</strong> Water Service Connections by Usersat December 31, 2012104030794 85 80153052118ResidentialCommercialFederalProvincial<strong>City</strong>UNBIndustrialSTU14
Number <strong>of</strong> <strong>Sewer</strong> Service Connections by Usersat December 31, 2013102085 62 65 182991525617ResidentialCommercialFederalProvincial<strong>City</strong>UNBIndustrialSTUTotal Annual Consumption by Usersbased on 2012 usage in m 397,692 278,960 13,314 44,378148,168284,192ResidentialCommercial1,706,7873,666,681FederalProvincial<strong>City</strong>UNBIndustrialSTU15
2012 Revenue by Users$141,082 $455,104$25,524$476,177$62,016$324,372ResidentialCommercialFederal$3,039,904Provincial<strong>City</strong>$9,935,708UNBIndustrialSTUWhile commercial customers use a larger proportion <strong>of</strong> water and sewer services based on volume,there is a larger proportion <strong>of</strong> infrastructure installed for supplying water and sewer services toresidential customers. It would be difficult for the <strong>City</strong> to justify different rates for commercial versusresidential customers due to the fact that the majority <strong>of</strong> the infrastructure investment andreinvestment required relates to residential connections. As such, it is recommended that rates basedon user group should not vary.Key Performance IndicatorsThere are a number <strong>of</strong> key performance indicators that will enable Council and customers to monitorthe success <strong>of</strong> the <strong>Long</strong> <strong>Term</strong> <strong>Financial</strong> <strong>Plan</strong>. First and foremost will be maintaining the efficient andquality service that is currently provided to customers through the high quality drinking water the <strong>City</strong>provides to the treatment <strong>of</strong> wastewater within the standards and recommended practices <strong>of</strong> theindustry. This will be measured through routine testing <strong>of</strong> systems to ensure compliance with standardssurrounding treatment. In addition, a measure will be to have 100% customer confidence with the <strong>City</strong>’swater quality.Another key measure is the state <strong>of</strong> the infrastructure through the dollars invested, the impact on theinfrastructure deficit and the overall condition <strong>of</strong> the systems. A key goal <strong>of</strong> the infrastructurereinvestment will be the reduction in the number <strong>of</strong> breaks and fixes the <strong>City</strong> addresses each year. Adirect result <strong>of</strong> this will be the amount <strong>of</strong> operating dollars that can be reallocated from these repairs tocapital reinvestment. The state <strong>of</strong> the infrastructure report card and infrastructure deficit will be tracked16
annually to assess progress made. A direct measure will be the changes to the state <strong>of</strong> the infrastructurecategorized between good, fair and poor condition.Avoidance <strong>of</strong> rate shock is imperative to customers. This will be achieved by obtaining funding fromother levels <strong>of</strong> Government to address CCME standards as well as working towards efficiencies that willreduce the impact on the customer. Rates will remain competitive with surrounding areas and withinthe Province and will be reassessed on an annual basis to look at affordability to the customer.ConclusionThe <strong>City</strong> is taking a long term planned approach to protect the significant investment in theinfrastructure today to ensure sustainability for the next generation. Through gradual user rateincreases and funding from Federal Gas Tax, the <strong>City</strong> will continue to provide safe, reliable, quality waterand environmentally sound wastewater treatment. This will allow for proper maintenance <strong>of</strong> thesystems as well as strategic and timely infrastructure reinvestment.In order to achieve long-term sustainability, it is recommended:• that water and sewer revenue increase annually by 5% for each <strong>of</strong> the next 5 years. Thefollowing guidelines are recommended:o the rate increases be applied to the quarterly base fee and the commodity charge;o the rate for private hydrants will be increased to a level consistent with the costsassociated with <strong>City</strong> hydrants less the cost <strong>of</strong> snow removal;o the rate for bulk water be increased to the equivalent <strong>of</strong> two times the consumptionrate for water per m 3 plus a premium rate to recover the cost <strong>of</strong> operating the fillstations and adjusted annually as the consumption rate increases;o a new Building Fire Protection System Fee be introduced;o a new Missed Appointment Fee be introduced for customers who are not available for ascheduled appointment and do not give a minimum <strong>of</strong> 24 hours notice• that the pay-as-you go capital program provide for a minimum reinvestment <strong>of</strong> 90% forinfrastructure renewal leaving a maximum <strong>of</strong> 10% for extensions to the systems• that the <strong>City</strong> apply the next 10 years <strong>of</strong> Federal Gas Tax Funding to water and sewerinfrastructure reinvestment projects to address the infrastructure deficit, and;• that in order to address changes to federal CCME environmental standards, the <strong>City</strong> will activelypursue other levels <strong>of</strong> government fundingUser Rates/FeesFederal Gas Tax FundingOther levels <strong>of</strong> governmentfundingFundingon-going operating, maintenance andinfrastructure renewaladdress infrastructure deficitaddress Federal CCME standardrequirements and large expansion projects17
Customers <strong>of</strong> the <strong>City</strong> <strong>of</strong> <strong>Fredericton</strong>’s water and sewer services should feel secure knowing that thedollars they invest in the water and sewer services they receive are spent with their best interests inmind. By continuing with committed infrastructure renewal while working towards efficiencies toreduce the impact on the customer, the <strong>City</strong> is building and rebuilding a better system not only for thecustomers <strong>of</strong> today, but for the next generation. In doing so, rates will remain affordable andpredictable now and in the future.DefinitionsAffordability: the ability <strong>of</strong> customers to pay for water and sewer services for both operating and capitalreinvestment in proportion to other expenses.Asset Management: managing capital infrastructure to deliver sustainable services. Managing meansdetermining optimal timing for purchase, maintenance, operation, renewal, replacement anddecommissioning <strong>of</strong> capital infrastructure. It also includes optimizing the balance between maintenanceand capital reinvestment.Capital/Infrastructure: tangible capital assets or physical assets that the <strong>City</strong> owns and controls.Fixed Costs: all costs that do not fluctuate based on the volume <strong>of</strong> service provided (in this case, waterprovided or wastewater treated).Flexibility: the ability <strong>of</strong> the <strong>City</strong> to adapt to changing economic and environmental conditions thatrequire adjustments to be made to the <strong>Long</strong> <strong>Term</strong> <strong>Financial</strong> <strong>Plan</strong>.Infrastructure Deficit: unfunded backlog <strong>of</strong> existing capital assets needing replacement due to reachingthe end <strong>of</strong> useful or service life based on industry standards and past experience.Lifecycle Cost: the cost <strong>of</strong> infrastructure over its useful life including the upfront purchase orconstruction cost, ongoing operating and maintenance costs and eventual renewal.<strong>Long</strong> <strong>Term</strong> <strong>Financial</strong> <strong>Plan</strong>: a strategic approach to identifying and addressing financial challenges througha financial condition analysis, forecasting and analysis and financial policies.Sustainability: meeting present needs without compromising the ability to meet future needs. Spendingthe right money, at the right time, on the right things.Variable Costs: all costs that fluctuate with the volume <strong>of</strong> service provided. These can include but arenot limited to chemicals to treat water and wastewater, overtime and operating costs relating to breaksand fixes.18
APPENDIX I –AGE OF WATER ANDSANITARY SEWERINFRASTRUCTURE19
APPENDIX II –FUTURE PLANNEDINFRASTRUCTUREINVESTMENT20