Trends in alcohol consumption in undergraduate third level students
Trends in alcohol consumption in undergraduate third level students
Trends in alcohol consumption in undergraduate third level students
- No tags were found...

Create successful ePaper yourself
Turn your PDF publications into a flip-book with our unique Google optimized e-Paper software.
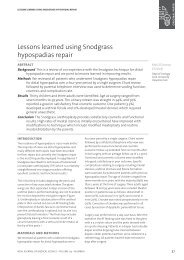
<strong>Trends</strong> <strong>in</strong> <strong>alcohol</strong> <strong>consumption</strong> <strong>in</strong> <strong>undergraduate</strong> <strong>third</strong> <strong>level</strong> <strong>students</strong>: 1992-1999orig<strong>in</strong>al paper<strong>Trends</strong> <strong>in</strong> <strong>alcohol</strong> <strong>consumption</strong> <strong>in</strong><strong>undergraduate</strong> <strong>third</strong> <strong>level</strong> <strong>students</strong>: 1992-1999S O’Brien, H S<strong>in</strong>clair 1 , S Soni, T O’Dowd 1 , D ThomasStudent Health Service and Department of Community Health and General Practice 1 , Tr<strong>in</strong>ity College, Dubl<strong>in</strong>,IrelandAbstractBackground Alcohol <strong>consumption</strong> has <strong>in</strong>creased <strong>in</strong> the Irish population <strong>in</strong> recent years. It is not known to whatextent the student population has been affected by this <strong>in</strong>crease.Aim To determ<strong>in</strong>e <strong>level</strong>s of <strong>alcohol</strong> <strong>consumption</strong> among <strong>undergraduate</strong>s <strong>in</strong> one Irish university and identify changes<strong>in</strong> dr<strong>in</strong>k<strong>in</strong>g patterns <strong>in</strong> the years 1992-1999.Methods Information on <strong>alcohol</strong> use was obta<strong>in</strong>ed by anonymous self-completed questionnaire <strong>in</strong> a stratified randomcross-faculty sample of <strong>undergraduate</strong>s <strong>in</strong> 1992 and 1999. The CAGE questionnaire to determ<strong>in</strong>e problemdr<strong>in</strong>k<strong>in</strong>g was <strong>in</strong>cluded <strong>in</strong> both surveys.Results A statistically significant (p=0.01) drop <strong>in</strong> weekly <strong>alcohol</strong> <strong>consumption</strong> by males was found, although theproportion of male problem dr<strong>in</strong>kers <strong>in</strong>creased. Consumption for females rema<strong>in</strong>ed the same.Conclusions F<strong>in</strong>d<strong>in</strong>gs are contrary to recent figures for dr<strong>in</strong>k<strong>in</strong>g patterns <strong>in</strong> young Irish people <strong>in</strong> general. The fall<strong>in</strong> <strong>alcohol</strong> <strong>consumption</strong> <strong>in</strong> male <strong>students</strong> may be l<strong>in</strong>ked to improved male <strong>in</strong>sight <strong>in</strong>to the negative effects of <strong>alcohol</strong>or to the substitution of cheaper available substances.IntroductionAlcohol <strong>consumption</strong> has <strong>in</strong>creased <strong>in</strong> the Irish population <strong>in</strong>recent years. 1This has been l<strong>in</strong>ked with economic growth,greater access to <strong>alcohol</strong> through longer open<strong>in</strong>g hours, agreater number of young people start<strong>in</strong>g to dr<strong>in</strong>k at a youngerage and a higher percentage of regular dr<strong>in</strong>kers by the age of 18years. It has also been l<strong>in</strong>ked with strong <strong>alcohol</strong> advertis<strong>in</strong>gand sponsorship of highly visible sports.Alcohol <strong>consumption</strong> is an <strong>in</strong>tegral part of student life. It issocially acceptable and is seen as characteristic of <strong>students</strong> to<strong>in</strong>dulge <strong>in</strong> frequent and often heavy dr<strong>in</strong>k<strong>in</strong>g. 2It is not knownto what extent the Irish student population has been affected bythe general <strong>in</strong>crease <strong>in</strong> dr<strong>in</strong>k<strong>in</strong>g <strong>level</strong>s. A survey of <strong>undergraduate</strong>student <strong>alcohol</strong> use and attitudes towards <strong>alcohol</strong> <strong>in</strong> onelarge Irish university had been carried out <strong>in</strong> 1992. 3It was felttimely to repeat this survey us<strong>in</strong>g the same methodology <strong>in</strong>1999 <strong>in</strong> order to ascerta<strong>in</strong> the changes, if any, that have takenplace <strong>in</strong> the <strong>in</strong>terven<strong>in</strong>g time.MethodsInformation on <strong>alcohol</strong> use and attitudes towards <strong>alcohol</strong> was obta<strong>in</strong>edby an anonymous, pre-tested, 60 item, self-adm<strong>in</strong>istered questionnairecover<strong>in</strong>g basic demographic data, frequency and quantity of <strong>alcohol</strong>use, effects of <strong>alcohol</strong> use (academic, medical, f<strong>in</strong>ancial and social),motives for dr<strong>in</strong>k<strong>in</strong>g and attitudes towards <strong>alcohol</strong>. The CAGE questionnaire,a four item questionnaire used to detect problem dr<strong>in</strong>k<strong>in</strong>gwas also <strong>in</strong>cluded <strong>in</strong> both surveys. 4 Two or more positive replies on theCAGE are said to identify problem dr<strong>in</strong>kers. Sensible dr<strong>in</strong>k<strong>in</strong>g wasdef<strong>in</strong>ed as an <strong>in</strong>take of 0.05). All results are based on those who drank <strong>alcohol</strong> <strong>in</strong>both survey periods. The average number of units of <strong>alcohol</strong>drunk per week by male <strong>students</strong> dropped from 22 <strong>in</strong> 1992 to17 <strong>in</strong> 1999, a drop that was statistically significant (p=0.01, see224Irish Journal of Medical Science • Volume 170 • Number 4
S O’Brien et alTable 2). There was little change <strong>in</strong> the average weekly <strong>consumption</strong>by female <strong>students</strong> between 1992 and 1999.The number of male <strong>students</strong> dr<strong>in</strong>k<strong>in</strong>g above the sensiblelimit guidel<strong>in</strong>es (21 units per week) dropped significantlybetween the two study periods (p=0.01). The number offemales dr<strong>in</strong>k<strong>in</strong>g above the limit guidel<strong>in</strong>es (14 units per week)<strong>in</strong>creased but not significantly (p=0.59). The proportion ofmales engaged <strong>in</strong> b<strong>in</strong>ge dr<strong>in</strong>k<strong>in</strong>g dropped from 40% <strong>in</strong> 1992 to29% <strong>in</strong> 1999, a drop that was statistically significant (p=0.04).Female b<strong>in</strong>ge dr<strong>in</strong>k<strong>in</strong>g rema<strong>in</strong>ed approximately the same. Theproportion of <strong>students</strong> with two or more positive replies on theCAGE questionnaire <strong>in</strong>creased between the two survey periodsbut the <strong>in</strong>crease was much larger for male <strong>students</strong> ris<strong>in</strong>g from29% <strong>in</strong> 1992 to 39% <strong>in</strong> 1999 (see Table 2).More <strong>students</strong> <strong>in</strong> 1999 thought that student <strong>alcohol</strong> <strong>consumption</strong>was ‘large’ (see Table 3). Students <strong>in</strong> 1999 were alsomore likely to set a higher safe upper limit of dr<strong>in</strong>k<strong>in</strong>g per weekfor both a healthy man and woman and were also more likely toexceed their perceived safe upper limits more than once a week.Most <strong>students</strong> <strong>in</strong> both surveys felt that they were a ‘normal’dr<strong>in</strong>ker. The term ‘normal’ be<strong>in</strong>g self-determ<strong>in</strong>ed.A higher percentage of <strong>students</strong> <strong>in</strong> 1999 reported receiv<strong>in</strong>g aphysical <strong>in</strong>jury while dr<strong>in</strong>k<strong>in</strong>g or hav<strong>in</strong>g had a complete loss ofmemory because of dr<strong>in</strong>k<strong>in</strong>g (see Table 4). Students <strong>in</strong> 1999were also much more likely to engage <strong>in</strong> <strong>in</strong>discrim<strong>in</strong>ate sexualactivity while dr<strong>in</strong>k<strong>in</strong>g. While a larger proportion of <strong>students</strong> <strong>in</strong>1999 felt that they ought to cut down on their dr<strong>in</strong>k<strong>in</strong>g, veryfew were <strong>in</strong>terested <strong>in</strong> attend<strong>in</strong>g talks on dr<strong>in</strong>k<strong>in</strong>g and health.More <strong>students</strong> <strong>in</strong> 1999 claimed they had missed practicals orlectures because of dr<strong>in</strong>k<strong>in</strong>g but that this was not <strong>in</strong>terfer<strong>in</strong>gwith their academic performance (see Table 5). While there waslittle difference <strong>in</strong> the numbers experienc<strong>in</strong>g f<strong>in</strong>ancial difficultiesdue to dr<strong>in</strong>k<strong>in</strong>g, a larger proportion of <strong>students</strong> <strong>in</strong> 1999 feltthey were spend<strong>in</strong>g too much money on dr<strong>in</strong>k.DiscussionThese f<strong>in</strong>d<strong>in</strong>gs are the first <strong>in</strong>dications of trends <strong>in</strong> dr<strong>in</strong>k<strong>in</strong>g patternsand attitudes to <strong>alcohol</strong> <strong>in</strong> an Irish <strong>third</strong> <strong>level</strong> student population.The study is likely to underestimate problem dr<strong>in</strong>kerswho may miss lectures due to the after-effects of <strong>alcohol</strong>. Those<strong>students</strong> with more severe <strong>alcohol</strong> problems are also likely to beoff the college register or <strong>in</strong>deed left the university. Where male<strong>students</strong> are concerned there has been a reduction <strong>in</strong> theamount of <strong>alcohol</strong> consumed weekly, <strong>in</strong> the numbers of <strong>students</strong>exceed<strong>in</strong>g sensible limit guidel<strong>in</strong>es and <strong>in</strong> the number ofb<strong>in</strong>ge dr<strong>in</strong>kers.These f<strong>in</strong>d<strong>in</strong>gs are surpris<strong>in</strong>g and it is difficult to be certa<strong>in</strong> asto the reason for the fall <strong>in</strong> male <strong>alcohol</strong> <strong>consumption</strong>. It is possiblethat it may be l<strong>in</strong>ked to improved male <strong>in</strong>sight <strong>in</strong>to thenegative effects of <strong>alcohol</strong> through school-based health educationprogrammes, although it would be reasonable to expect asimilar pattern <strong>in</strong> female dr<strong>in</strong>k<strong>in</strong>g if they are exposed to <strong>alcohol</strong>programmes. Such programmes have been shown to promptmore sensible dr<strong>in</strong>k<strong>in</strong>g habits, less frequent dr<strong>in</strong>k<strong>in</strong>g and lessdrunkenness. 6A number of studies have reported that male college <strong>students</strong>dr<strong>in</strong>k <strong>alcohol</strong> more frequently than female <strong>students</strong>, 7,8 dr<strong>in</strong>klarger quantities of <strong>alcohol</strong> 9,10and are more likely to engage <strong>in</strong>b<strong>in</strong>ge dr<strong>in</strong>k<strong>in</strong>g. 11 A recent British study 12 of 3,075 second-yearuniversity <strong>students</strong> from ten UK universities has shown that61% of the men and 48% of the women dr<strong>in</strong>kers exceeded “sensible”limits of 21 units per week for men and 14 units forwomen. These percentages are higher than <strong>in</strong> the study reportedhere. In another study which also showed that male <strong>students</strong>drank significantly larger quantities than female, men were alsoTable 1. Comparison between 1992 and 1999 <strong>students</strong>(dr<strong>in</strong>kers and non-dr<strong>in</strong>kers) for basel<strong>in</strong>e characteristics.Values are numbers (percentages) unless otherwise stated.1992 1999Characteristic (n=400) (n=501) P valueGenderMen 164 (41.1) 203 (40.6)Women 235 (58.9) 297 (59.4) 0.88*Mean age <strong>in</strong> years(SD) 20.0 (1.7) 20.2 (3.2) 0.14†Dr<strong>in</strong>k <strong>alcohol</strong>Yes 358 (89.5) 461 (92.0)No 42 (10.5) 40 (8.0) 0.19** Pearson Chi-squared test, † Student’s t-test.Table 2. Gender differences <strong>in</strong> <strong>alcohol</strong> <strong>consumption</strong> between1992 and 1999. Values are numbers (percentages) unless otherwisestated.Alcohol <strong>consumption</strong> 1992 1999 P value*Average number of units drunk weekly:Males (SD) 21.9 (18.6) 17.1 (14.9) 0.012Females (SD) 10.5 (10.2) 10.5 (8.9) 0.962Above weekly limit guidel<strong>in</strong>esMales 52 (38.5) 40 (24.5) 0.009Females 54 (27.1) 62 (24.7) 0.558One or more ‘b<strong>in</strong>ge’ days dur<strong>in</strong>g last week:Males 54 (40.0) 47 (28.8) 0.043Females 65 (32.7) 77 (30.7) 0.653CAGE (two or more positives)Males 42 (29.2) 72 (38.7) 0.071Females 52 (25.4) 73 (27.1) 0.665* Pearson Chi-squared test.Table 3. Comparison of student knowledge and practicesregard<strong>in</strong>g <strong>alcohol</strong> limit guidel<strong>in</strong>es between 1992 and 1999.Values are numbers (percentages) who said ‘Yes’.Knowledge of 1992 1999 P value*limit guidel<strong>in</strong>esStudent <strong>alcohol</strong> <strong>consumption</strong>Large 246 (69.1) 366 (79.6)Moderate 108 (30.3) 91 (19.8)Small 2 (0.6) 3 (0.7) 0.001Safe upper limit for a healthy manBelow limit guidel<strong>in</strong>es 119 (33.3) 122 (26.6)Above limit guidel<strong>in</strong>es 238 (66.8) 337 (73.4) 0.036Safe upper limit for a healthy womanBelow limit guidel<strong>in</strong>es 255 (71.4) 279 (61.1)Above limit guidel<strong>in</strong>es 102 (28.6) 178 (38.9) 0.002Do you exceed the limits you suggested above?More than once a week 76 (21.3) 140 (31.1)Less than once a week 234 (65.5) 269 (59.8)Never 47 (13.2) 41 (9.1) 0.004Compared to other <strong>students</strong>, do you believe that you dr<strong>in</strong>kLess 188 (42.0) 216 (47.1)As much 140 (39.4) 211 (56.0)More 27 (7.6) 32 (7.0) 0.17Do you feel you are a normal dr<strong>in</strong>ker?302 (86.0) 387 (85.1) 0.69* Pearson Chi-squared testIrish Journal of Medical Science • Volume 170 • Number 4225
<strong>Trends</strong> <strong>in</strong> <strong>alcohol</strong> <strong>consumption</strong> <strong>in</strong> <strong>undergraduate</strong> <strong>third</strong> <strong>level</strong> <strong>students</strong>: 1992-1999Table 4. Effects of <strong>alcohol</strong> on student health between 1992and 1999. Values are numbers (percentages) who said ‘Yes’.Health effects 1992 1999 P valueHave you received any physical <strong>in</strong>juries while dr<strong>in</strong>k<strong>in</strong>g?96 (27.2) 211 (45.9)
S O’Brien et al12. Webb E, Ashton C, Kelly P, Kamali F. Alcohol and druguse <strong>in</strong> UK university <strong>students</strong>. Lancet 1996; 348: 922-25.13. Clements R. Prevalence of <strong>alcohol</strong>-use disorders and <strong>alcohol</strong>-relatedproblems <strong>in</strong> a college sutdent sample. CollegeHealth 1999; 48: 111-118.14. Wechsler H, Dowdall G, maenner G, Gledhill-Hoyt J, LeeH. Changes <strong>in</strong> b<strong>in</strong>ge dr<strong>in</strong>k<strong>in</strong>g and related problems amongAmerican college <strong>students</strong> between 1993 and 1997. CollegeHealth 1998; 47: 57-68.15. Wechhsler H, Isaac N. “B<strong>in</strong>ge” dr<strong>in</strong>kers at Massachussettscolleges. JAMA, 1992; 267: 21: 2929-2931.16. Yang MS, Yang MJ, Liu YH, Ko YC. Prevalence and relatedrik factors of licit and illicit substances use by adolescent <strong>students</strong><strong>in</strong> Southern Taiwan. Public Health 1998; 112: 347-352.Correspondence to: Prof. Tom O’Dowd, Department ofCommunity Health & General Practice, Tr<strong>in</strong>ity College Centrefor Health Sciences , Adelaide & Meath Hospital, <strong>in</strong>corporat<strong>in</strong>gthe National Children’s Hospital, Tallaght, Dubl<strong>in</strong> 24, Ireland.Tel: +353 1 6081087/6082293; Fax: +353 1 4031211/4031212Irish Journal of Medical Science • Volume 170 • Number 4227