The Demand for Tax Haven Operations - Harvard Business School
The Demand for Tax Haven Operations - Harvard Business School
The Demand for Tax Haven Operations - Harvard Business School

You also want an ePaper? Increase the reach of your titles
YUMPU automatically turns print PDFs into web optimized ePapers that Google loves.
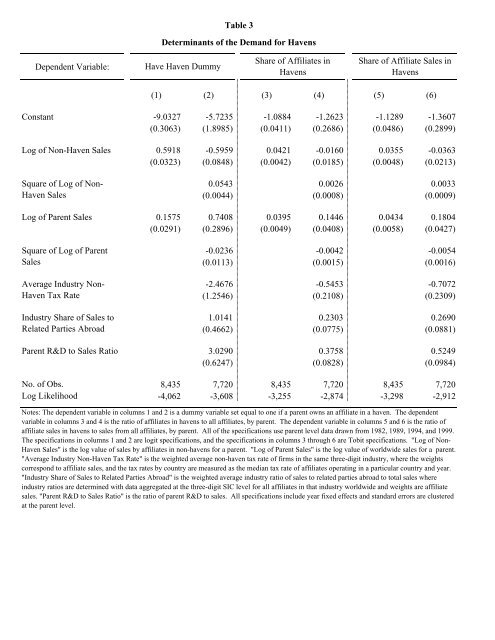
Dependent Variable:<br />
(1) (2) (3) (4) (5) (6)<br />
Constant -9.0327 -5.7235 -1.0884 -1.2623 -1.1289 -1.3607<br />
(0.3063) (1.8985) (0.0411) (0.2686) (0.0486) (0.2899)<br />
Log of Non-<strong>Haven</strong> Sales<br />
Square of Log of Non-<br />
<strong>Haven</strong> Sales<br />
Log of Parent Sales<br />
Square of Log of Parent<br />
Sales<br />
Average Industry Non-<br />
<strong>Haven</strong> <strong>Tax</strong> Rate<br />
Industry Share of Sales to<br />
Related Parties Abroad<br />
Parent R&D to Sales Ratio<br />
Have <strong>Haven</strong> Dummy<br />
Table 3<br />
Determinants of the <strong>Demand</strong> <strong>for</strong> <strong>Haven</strong>s<br />
Share of Affiliates in<br />
<strong>Haven</strong>s<br />
Share of Affiliate Sales in<br />
<strong>Haven</strong>s<br />
0.5918 -0.5959 0.0421 -0.0160 0.0355 -0.0363<br />
(0.0323) (0.0848) (0.0042) (0.0185) (0.0048) (0.0213)<br />
0.0543 0.0026 0.0033<br />
(0.0044) (0.0008) (0.0009)<br />
0.1575 0.7408 0.0395 0.1446 0.0434 0.1804<br />
(0.0291) (0.2896) (0.0049) (0.0408) (0.0058) (0.0427)<br />
-0.0236 -0.0042 -0.0054<br />
(0.0113) (0.0015) (0.0016)<br />
-2.4676 -0.5453 -0.7072<br />
(1.2546) (0.2108) (0.2309)<br />
1.0141 0.2303 0.2690<br />
(0.4662) (0.0775) (0.0881)<br />
3.0290 0.3758 0.5249<br />
(0.6247) (0.0828) (0.0984)<br />
No. of Obs. 8,435 7,720 8,435 7,720 8,435 7,720<br />
Log Likelihood -4,062 -3,608 -3,255 -2,874 -3,298 -2,912<br />
Notes: <strong>The</strong> dependent variable in columns 1 and 2 is a dummy variable set equal to one if a parent owns an affiliate in a haven. <strong>The</strong> dependent<br />
variable in columns 3 and 4 is the ratio of affiliates in havens to all affiliates, by parent. <strong>The</strong> dependent variable in columns 5 and 6 is the ratio of<br />
affiliate sales in havens to sales from all affiliates, by parent. All of the specifications use parent level data drawn from 1982, 1989, 1994, and 1999.<br />
<strong>The</strong> specifications in columns 1 and 2 are logit specifications, and the specifications in columns 3 through 6 are Tobit specifications. "Log of Non-<br />
<strong>Haven</strong> Sales" is the log value of sales by affiliates in non-havens <strong>for</strong> a parent. "Log of Parent Sales" is the log value of worldwide sales <strong>for</strong> a parent.<br />
"Average Industry Non-<strong>Haven</strong> <strong>Tax</strong> Rate" is the weighted average non-haven tax rate of firms in the same three-digit industry, where the weights<br />
correspond to affiliate sales, and the tax rates by country are measured as the median tax rate of affiliates operating in a particular country and year.<br />
"Industry Share of Sales to Related Parties Abroad" is the weighted average industry ratio of sales to related parties abroad to total sales where<br />
industry ratios are determined with data aggregated at the three-digit SIC level <strong>for</strong> all affiliates in that industry worldwide and weights are affiliate<br />
sales. "Parent R&D to Sales Ratio" is the ratio of parent R&D to sales. All specifications include year fixed effects and standard errors are clustered<br />
at the parent level.