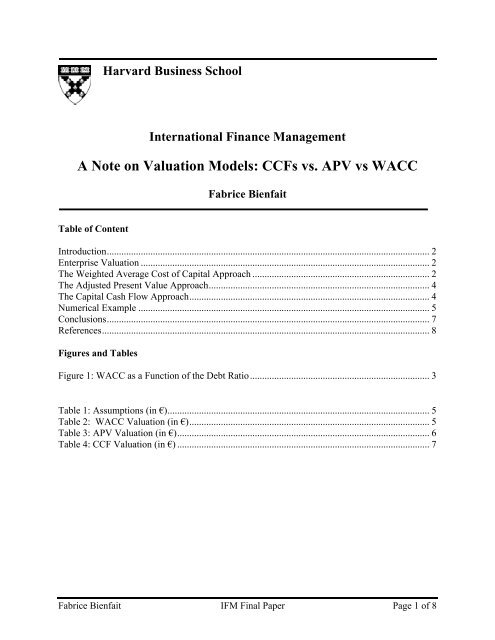
A Note on Valuation Models: CCFs vs. APV vs WACC - Harvard ...
A Note on Valuation Models: CCFs vs. APV vs WACC - Harvard ...
A Note on Valuation Models: CCFs vs. APV vs WACC - Harvard ...

Create successful ePaper yourself
Turn your PDF publications into a flip-book with our unique Google optimized e-Paper software.
<strong>Harvard</strong> Business School<br />
Internati<strong>on</strong>al Finance Management<br />
A <str<strong>on</strong>g>Note</str<strong>on</strong>g> <strong>on</strong> Valuati<strong>on</strong> <strong>Models</strong>: <strong>CCFs</strong> <strong>vs</strong>. <strong>APV</strong> <strong>vs</strong> <strong>WACC</strong><br />
Table of C<strong>on</strong>tent<br />
Fabrice Bienfait<br />
Introducti<strong>on</strong>..................................................................................................................................... 2<br />
Enterprise Valuati<strong>on</strong> ....................................................................................................................... 2<br />
The Weighted Average Cost of Capital Approach ......................................................................... 2<br />
The Adjusted Present Value Approach........................................................................................... 4<br />
The Capital Cash Flow Approach................................................................................................... 4<br />
Numerical Example ........................................................................................................................ 5<br />
C<strong>on</strong>clusi<strong>on</strong>s..................................................................................................................................... 7<br />
References....................................................................................................................................... 8<br />
Figures and Tables<br />
Figure 1: <strong>WACC</strong> as a Functi<strong>on</strong> of the Debt Ratio.......................................................................... 3<br />
Table 1: Assumpti<strong>on</strong>s (in €)............................................................................................................ 5<br />
Table 2: <strong>WACC</strong> Valuati<strong>on</strong> (in €)................................................................................................... 5<br />
Table 3: <strong>APV</strong> Valuati<strong>on</strong> (in €)........................................................................................................ 6<br />
Table 4: CCF Valuati<strong>on</strong> (in €) ........................................................................................................ 7<br />
Fabrice Bienfait IFM Final Paper Page 1 of 8
Introducti<strong>on</strong><br />
In this note we compare and c<strong>on</strong>trast three enterprise valuati<strong>on</strong> models: the weighted average<br />
cost of capital (<strong>WACC</strong>), the adjusted present value (<strong>APV</strong>) and the capital cash flow (CCF). The<br />
three approaches value the entire firm but they differ around the way they treat tax shields. We<br />
will first review the rati<strong>on</strong>al and the underlying assumpti<strong>on</strong>s behind each approach. We will then<br />
use a numerical example to illustrate the mechanics behind the three approaches and show under<br />
which assumpti<strong>on</strong>s they yield the same results.<br />
Enterprise Valuati<strong>on</strong><br />
According to Modigliani and Miller, the value of a company’s ec<strong>on</strong>omic assets must equal the<br />
value of the claims against those assets. Enterprise valuati<strong>on</strong> models value the sum of the cash<br />
flows to all claim holders, including equity holders and debt holders and discount them to the<br />
appropriate cost of capital. The cash flow available to all claim holders is called the free cash<br />
flow (FCF) from operati<strong>on</strong>s and is defined below:<br />
FCF = EBIAT + Depreciati<strong>on</strong> – Capital Expenditure – Increases in Working Capital<br />
EBIAT is the income the company earns after tax without regard to how the company is<br />
financed. N<strong>on</strong>-cash expenses such as Depreciati<strong>on</strong> are then added. Because we are valuing a<br />
going c<strong>on</strong>cern we also take into account the cash flow management will retain for new capital<br />
expenditures and possible increase in working capital. The remaining is in effect the cash<br />
available to owners and creditors.<br />
By definiti<strong>on</strong> free cash flow is independent from leverage (and is often referred as un-levered<br />
free cash flow). Therefore the value derived from the interest tax shield (interest <strong>on</strong> debt is tax<br />
deductible) has still to be incorporated in the enterprise valuati<strong>on</strong>. This is where the three<br />
approaches <strong>WACC</strong>, <strong>APV</strong> and CCF differ:<br />
• The <strong>WACC</strong> approach values the tax shield by adjusting the cost of capital<br />
• The <strong>APV</strong> approach values the tax shield separately from the un-levered free cash flow<br />
• The CCF approach values the tax shield by incorporating it in the cash flow<br />
The Weighted Average Cost of Capital Approach<br />
To determine the value of the enterprise, the free cash flows from operati<strong>on</strong>s have to be<br />
discounted to present value. According to Modigliani and Miller’s propositi<strong>on</strong> number <strong>on</strong>e<br />
without taxes or financial market imperfecti<strong>on</strong>s the cost of capital does not depend <strong>on</strong> financing<br />
so the weighted average of the expected returns to debt and equity investors equals the<br />
opportunity cost of capital regardless of leverage:<br />
Rd x D/V + Re x E/V = Ra = C<strong>on</strong>stant independent of D/V<br />
Ra = Opportunity cost of capital = Un-levered cost of equity = Return <strong>on</strong> assets = pre-tax <strong>WACC</strong><br />
Rd = Cost of debt, Re = Cost of equity,<br />
D/V and E/V = Target levels of debt and equity using market values<br />
Fabrice Bienfait IFM Final Paper Page 2 of 8
N<strong>on</strong>e of the comp<strong>on</strong>ents of the cost of capital are directly observable and therefore need to be<br />
approximated using various models and assumpti<strong>on</strong>s. The cost of equity is derived from the<br />
capital asset pricing model (CAPM) while the cost of debt can be estimated from the firm credit<br />
rating and default risk or from yields <strong>on</strong> publicly traded debt.<br />
However interest <strong>on</strong> debt is tax deductible so if we were to discount free cash flows from<br />
operati<strong>on</strong>s using Ra we would not take into account the value of the tax shield. Therefore the<br />
after-tax weighted average cost of capital (<strong>WACC</strong>) is used instead. <strong>WACC</strong> includes an<br />
adjustment to the cost of debt by the marginal tax rate (Tm):<br />
<strong>WACC</strong> = Rd x (1-Tm) x D/V + Re x E/V (= Ra – Rd x Tm x D/V)<br />
<strong>WACC</strong> is less than the opportunity cost of capital Ra because the cost of debt is calculated after<br />
tax as Rd (1-Tm). Thus the tax advantages of debt financing are reflected in a lower discount<br />
rate. The <strong>WACC</strong> equals the opportunity cost of capital when there is no debt and declines with<br />
financial leverage because of increasing interest tax shields. The <strong>WACC</strong> increases again when<br />
the debt level becomes significant relative to the value of the firm reflecting the main costs<br />
associated with borrowing, the costs of bankruptcy.<br />
Figure 1: <strong>WACC</strong> as a Functi<strong>on</strong> of the Debt Ratio<br />
Rates of Return<br />
Re<br />
R<br />
<strong>WACC</strong><br />
Rd<br />
Debt to Equity<br />
Discounting all future cash flows using a c<strong>on</strong>stant <strong>WACC</strong> assumes that the company manages its<br />
capital structure to a fixed debt to value ratio (D/V). Therefore the company’s <strong>WACC</strong> is the right<br />
discount rate <strong>on</strong>ly if the company’s debt ratio (D/V) is expected to remain reas<strong>on</strong>ably close to<br />
c<strong>on</strong>stant. However if the company is expected to significantly change its capital structure (i.e.<br />
Fabrice Bienfait IFM Final Paper Page 3 of 8
c<strong>on</strong>stant level of debt, LBO, recapitalizati<strong>on</strong>), the <strong>WACC</strong> would have to be c<strong>on</strong>tinuously<br />
adjusted which makes the approach more difficult to apply.<br />
The Adjusted Present Value Approach<br />
The <strong>APV</strong> approach values the cash flows associated with capital structure independently by<br />
separating the value of operati<strong>on</strong>s into two comp<strong>on</strong>ents: the value of the firm without debt and<br />
the benefits and the costs of borrowing:<br />
Value of the firm = Value of the un-levered firm + Present value of interest tax shields – Costs of<br />
financial distress<br />
The value of the un-levered firm is obtained by discounting free cash flows at the return <strong>on</strong><br />
assets (Ra). If the company manages its debt-to-value to a target level (D/V=c<strong>on</strong>stant) then the<br />
interest tax shield is as risky as the firm and should be discounted at Ra. In this case the <strong>APV</strong><br />
approach yields the same results as the <strong>WACC</strong> approach but is computati<strong>on</strong>ally less efficient.<br />
However if the debt is assumed to be a fixed amount (D=c<strong>on</strong>stant) the interest tax shield is less<br />
risky than the firm but as risky as the debt itself and should be discounted at the cost of debt. In<br />
this case the <strong>APV</strong> approach is not <strong>on</strong>ly the <strong>on</strong>ly correct approach, it is also computati<strong>on</strong>ally very<br />
efficient if the tax saving are c<strong>on</strong>sidered as perpetuity since:<br />
Present value of interest tax shields = (Tm x Rd x D) / Rd = Tm x D<br />
The main risk in using the <strong>APV</strong> approach is to ignore the costs of financial distress, especially at<br />
very high debt ratios, which leads to an overvaluati<strong>on</strong> of the firm.<br />
The Capital Cash Flow Approach<br />
Capital cash flows are simply derived from free cash flows by adding interest tax shields:<br />
CCF = FCF + Interest tax shield = FCF + Tm x Rd x D<br />
With this approach capital cash flows are then discounted at the return <strong>on</strong> assets. This implicitly<br />
assumes that interest tax shields are as risky as the firm and are discounted at the return <strong>on</strong><br />
assets. This is true when debt is a fixed proporti<strong>on</strong> of value. Under this assumpti<strong>on</strong> the capital<br />
cash flow approach will generate the same results as the <strong>WACC</strong> approach. Furthermore if the<br />
debt is forecasted in levels instead of a debt-to-value ratio the CCF approach is easier to use<br />
because the tax shield are simple to calculate and to include in the CCF.<br />
If the forecasted debt levels imply a change in the debt-to-value ratio, the CCF retains his<br />
simplicity since the discount rate, the return <strong>on</strong> assets, is independent of the capital structure and<br />
can be used for every forecast period. Therefore the approach is easier to apply in transacti<strong>on</strong>s<br />
involving change in capital structure such as a LBO or a restructuring. However in this case<br />
discounting the interest tax shields at Ra is a simplifying assumpti<strong>on</strong> since the risk of those cash<br />
flows is not anymore the same as the risk associate with the firm.<br />
Fabrice Bienfait IFM Final Paper Page 4 of 8
Numerical Example<br />
Table 1 shows the financial assumpti<strong>on</strong>s underlying our numerical example. The firm is valued<br />
over a period of 5 years during which EBIT is growing at 5% per annum and depreciati<strong>on</strong>,<br />
capital expenditure and increase in working capital are c<strong>on</strong>stant. However the firm’s capital<br />
structure changes significantly through the repayment of a major porti<strong>on</strong> of its debt.<br />
Table 1: Assumpti<strong>on</strong>s (in €)<br />
Year 1 Year 2 Year 3 Year 4 Year 5<br />
Risk Free Rate 5% 5% 5% 5% 5%<br />
Market Risk Premium 7% 7% 7% 7% 7%<br />
Tax Rate 40% 40% 40% 40% 40%<br />
Asset Beta 1.2 1.2 1.2 1.2 1.2<br />
Debt Beta 0.4 0.35 0.3 0.25 0.2<br />
EBIT 100,000 105,000 110,250 115,763 121,551<br />
Depreciati<strong>on</strong> 50,000 50,000 50,000 50,000 50,000<br />
Capex 60,000 60,000 60,000 60,000 60,000<br />
Increase in NWC 10,000 10,000 10,000 10,000 10,000<br />
Debt 100,000 50,000 25,000 12,500 6,250<br />
We will start valuing the firm using the <strong>WACC</strong> approach (see table 2). This is the less<br />
appropriated and most complex methodology given the forecasted changes in capital structure.<br />
Indeed the <strong>WACC</strong> needs to be recalculated every year and an iterative calculati<strong>on</strong> has to be used<br />
since the value of the firm for each year is required to derive the percentage of debt and equity.<br />
The firm value in year N is the value of the remaining cash flows. For instance the value of the<br />
firm at the beginning of Year 3 is the value of the remaining cash flow in Year 3, 4 and 5<br />
discounted using the <strong>WACC</strong> in year 3, 4 and 5.<br />
Table 2: <strong>WACC</strong> Valuati<strong>on</strong> (in €)<br />
Year 1 Year 2 Year 3 Year 4 Year 5<br />
EBIT 100,000 105,000 110,250 115,763 121,551<br />
- Taxes <strong>on</strong> EBIT (40,000) (42,000) (44,100) (46,305) (48,620)<br />
= EBIAT 60,000 63,000 66,150 69,458 72,930<br />
+ Depreciati<strong>on</strong> 50,000 50,000 50,000 50,000 50,000<br />
- Capex (60,000) (60,000) (60,000) (60,000) (60,000)<br />
- Increase in NWC (10,000) (10,000) (10,000) (10,000) (10,000)<br />
= FCF 40,000 43,000 46,150 49,458 52,930<br />
Percent Debt 61.3% 35.2% 21.5% 14.7% 13.3%<br />
Cost of Debt 7.8% 7.5% 7.1% 6.8% 6.4%<br />
After Tax Cost of Debt 4.7% 4.5% 4.3% 4.1% 3.8%<br />
Percent Equity 38.7% 64.8% 78.5% 85.3% 86.7%<br />
Return <strong>on</strong> Assets 13.4% 13.4% 13.4% 13.4% 13.4%<br />
Cost of Equity 22.3% 16.6% 15.1% 14.5% 14.5%<br />
<strong>WACC</strong> 11.5% 12.4% 12.8% 13.0% 13.1%<br />
Discount Factor 0.90 0.80 0.71 0.63 0.55<br />
PV 35,878 34,329 32,666 30,979 29,325<br />
Firm Value 163,178 141,923 116,451 85,196 46,817<br />
Fabrice Bienfait IFM Final Paper Page 5 of 8
The cost of debt is calculated using CAPM: Rd = Rf + βd x MRP<br />
The cost of equity is calculated using the M&M propositi<strong>on</strong> I: Re = (Ra – D/V Rd) / (E/V)<br />
Using the <strong>WACC</strong> approach we find a value for the firm of €163,178. Next we use the <strong>APV</strong><br />
approach to value the firm calculating separately the value of the un-levered firm and the value<br />
of the interest tax shield (Tm x Rd x D). The approach is straightforward in this case since we<br />
are given a forecast of the level of debt. We find that the <strong>APV</strong> approach yields the same firm<br />
value (€163,178) as the <strong>WACC</strong> approach when discounting interest tax shield at Ra. We also<br />
illustrate that using Rd would yield a higher valuati<strong>on</strong> of the firm (this is not the correct discount<br />
rate in this case given that the debt is not c<strong>on</strong>stant).<br />
Table 3: <strong>APV</strong> Valuati<strong>on</strong> (in €)<br />
Year 1 Year 2 Year 3 Year 4 Year 5<br />
FCF 40,000 43,000 46,150 49,458 52,930<br />
Return <strong>on</strong> Assets 13.4% 13.4% 13.4% 13.4% 13.4%<br />
Discount Factor 0.88 0.78 0.69 0.60 0.53<br />
PV 35,273 33,438 31,647 29,907 28,225<br />
Value of Unlevered Firm 158,491<br />
Interest Tax Shield 3,120 1,490 710 338 160<br />
Return <strong>on</strong> Assets Ra 13.4% 13.4% 13.4% 13.4% 13.4%<br />
Discount Factor 0.88 0.78 0.69 0.60 0.53<br />
PV 2,751 1,159 487 204 85<br />
Value of Interest Tax Shield @ Ra 4,686<br />
Interest Tax Shield 3,120 1,490 710 338 160<br />
Cost of Debt Rd 7.8% 7.5% 7.1% 6.8% 6.4%<br />
Discount Factor 0.93 0.86 0.81 0.76 0.71<br />
PV 2,894 1,286 572 255 114<br />
Value of Interest Tax Shield @ Rd 5,121<br />
Value of Firm with ITS @ Ra 163,178<br />
Value of Firm with ITS @ Rd<br />
163,613<br />
Finally we use the CCF approach. The calculati<strong>on</strong> clearly shows how the interest tax shields are<br />
incorporated in the cash flows and then discounted at Ra. The CCF approach is equivalent to the<br />
<strong>WACC</strong> approach. Furthermore the approach also produces the same value as the <strong>APV</strong> method<br />
with interest tax shields discounted at Ra.<br />
Fabrice Bienfait IFM Final Paper Page 6 of 8
Table 4: CCF Valuati<strong>on</strong> (in €)<br />
Year 1 Year 2 Year 3 Year 4 Year 5<br />
EBIT 100,000 105,000 110,250 115,763 121,551<br />
- Taxes <strong>on</strong> EBIT (40,000) (42,000) (44,100) (46,305) (48,620)<br />
= EBIAT 60,000 63,000 66,150 69,458 72,930<br />
+ Depreciati<strong>on</strong> 50,000 50,000 50,000 50,000 50,000<br />
- Capex (60,000) (60,000) (60,000) (60,000) (60,000)<br />
- Increase in NWC (10,000) (10,000) (10,000) (10,000) (10,000)<br />
+ Interest tax Shield 3,120 1,490 710 338 160<br />
= CCF 43,120 44,490 46,860 49,795 53,090<br />
Return <strong>on</strong> Assets 13.4% 13.4% 13.4% 13.4% 13.4%<br />
Discount Factor 0.88 0.78 0.69 0.60 0.53<br />
PV 38,025 34,597 32,134 30,112 28,311<br />
Firm Value 163,178<br />
C<strong>on</strong>clusi<strong>on</strong>s<br />
The three enterprise valuati<strong>on</strong> techniques c<strong>on</strong>sidered in this paper are different in the way they<br />
treat interest tax shields. However we have seen that the <strong>WACC</strong> approach and the CCF approach<br />
are identical and that under certain assumpti<strong>on</strong>s the <strong>APV</strong> approach also yields the same<br />
valuati<strong>on</strong>. The <strong>WACC</strong> approach is easy to use and efficient when the assumpti<strong>on</strong> that capital<br />
structure will not change in the future can be made (D/V= c<strong>on</strong>stant). If debt level is forecasted to<br />
remain c<strong>on</strong>stant in absolute term (D=c<strong>on</strong>stant), the <strong>APV</strong> approach should be used discounting<br />
the interest tax shield at the cost of debt. Finally the CCF approach is the appropriate and most<br />
efficient approach when forecasted debt levels imply a change in capital structure. In this case it<br />
is also equivalent to the <strong>APV</strong> approach discounting the interest tax shield at the return <strong>on</strong> assets.<br />
Fabrice Bienfait IFM Final Paper Page 7 of 8
References<br />
Brealey and Myers, “Principles of corporate finance”, 7 th Editi<strong>on</strong><br />
Damodaran, “Investment Valuati<strong>on</strong>”, 2sd Editi<strong>on</strong><br />
Koller, Goedhart and Wessels, “Valuati<strong>on</strong>”, 4 th Editi<strong>on</strong><br />
Ruback, “Capital Cash Flows: a simple approach to valuing risky cash flows”<br />
Fabrice Bienfait IFM Final Paper Page 8 of 8