Ecography - Integrative Biogeography and Global Change Group
Ecography - Integrative Biogeography and Global Change Group
Ecography - Integrative Biogeography and Global Change Group
- No tags were found...

You also want an ePaper? Increase the reach of your titles
YUMPU automatically turns print PDFs into web optimized ePapers that Google loves.
<strong>Ecography</strong> 34: 897908, 2011doi: 10.1111/j.1600-0587.2011.06919.x# 2011 The Authors. <strong>Ecography</strong> # 2011 <strong>Ecography</strong>Subject Editor: Jens-Christian Svenning. Accepted 2 March 2011Using species co-occurrence networks to assess the impacts ofclimate changeMiguel B. Araújo, Alej<strong>and</strong>ro Rozenfeld, Carsten Rahbek <strong>and</strong> Pablo A. MarquetM. B. Araújo (maraujo@mncn.csic.es), Depto de Biodiversidad y Biología Evolutiva, Museo Nacional de Ciencias Naturales, CSIC, Calle JoséGutiérrez Abascal, 2, ES-28006, Madrid, Spain. MBA also at: Rui Nabeiro Biodiversity Chair, CIBIO, Univ. of Évora, Largo dos Colegiais,PT-7000 Évora, Portugal, <strong>and</strong> Lab Internacional en Cambio <strong>Global</strong>, UC-CSIC, Depto de Ecología, Facultad de Ciencias Biológicas, PUC,Alameda 340, CP 6513677, Santiago, Chile. A. Rozenfeld <strong>and</strong> P. A. Marquet, Lab Internacional en Cambio <strong>Global</strong>, UC-CSIC, Depto deEcologiá, Facultad de Ciencias Biológicas, PUC, Alameda 340, CP 6513677, Santiago, Chile. AR also at: Inst. Mediterráneo de EstudiosAvanzados, CSIC, C/Miquel Marquès, ES-21-07190 Esporles, Mallorca, Spain. PAM also at: Inst. de Ecología y Biodiversidad (IEB), Casilla653, Santiago, Chile. C. Rahbek, Center for Macroecology, Evolution <strong>and</strong> Climate, Dept of Biology, Univ. of Copenhagen, Universitetsparken15, DK-2100 Copenhagen, Denmark.Viable populations of species occur in a given place if three conditions are met: the environment at the place is suitable;the species is able to colonize it; co-occurrence is possible despite or because of interactions with other species. Studiesinvestigating the effects of climate change on species have mainly focused on measuring changes in climate suitability.Complex interactions among species have rarely been explored in such studies. We extend network theory to the analysisof complex patterns of co-occurrence among species. The framework is used to explore the robustness of networks underclimate change. With our data, we show that networks describing the geographic pattern of co-occurrence among speciesdisplay properties shared by other complex networks, namely that most species are poorly connected to other species inthe network <strong>and</strong> only a few are highly connected. In our example, species more exposed to climate change tended to bepoorly connected to other species within the network, while species more connected tended to be less exposed. Such highconnectance would make the co-occurrence networks more robust to climate change. The proposed framework illustrateshow network analysis could be used, together with co-occurrence data, to help addressing the potential consequences ofspecies interactions in studies of climate change <strong>and</strong> biodiversity. However, more research is needed to test for linksbetween co-occurrence <strong>and</strong> network interactions.Assessments of the effects of climate change on thedistributions of species have typically been conducted usingbioclimatic modelling approaches that ignore local populationprocesses (but see Keith et al. 2008, Anderson et al.2009) <strong>and</strong> biotic interactions (but see Araújo <strong>and</strong> Luoto2007). By ignoring biotic interactions, an implicit assumptionis that responses of species to climate changes are‘individualistic’ (Pearson <strong>and</strong> Dawson 2003). However,interspecific interactions may structure biotic communitieseven at coarser spatial scales (Heikkinen et al. 2007, Gotelliet al. 2010). Thus, the ‘individualistic response’ assumptionis problematic because it fails to account for interdependenciesbetween species, whereby the removal of species orchanges in the density of individual species withinecosystems can have cascading effects giving raise, forexample, to secondary extinctions (for reviews see Ebenman<strong>and</strong> Jonsson 2005, Tylianakis et al. 2008). The individualisticresponse approach may also fail by ignoring knownproperties of interaction networks, such as increasedresilience of assemblages with increasing connectance(Dunne et al. 2002b, Eklof <strong>and</strong> Ebenman 2006), <strong>and</strong> thelong-term co-occurrence of species enhanced by asymmetricalinteractions (Bascompte et al. 2006).The question then is: how can ecological interactions beaccounted for in predictions of the effects of climate changeon species distributions? One possible approach is toperform controlled experiments, whereby the anticipatedchanges in climate are simulated <strong>and</strong> the responses ofspecies under different treatments are recorded. The resultsof two recent studies using this approach reinforce thenotion that ecological interactions do affect species responsesto climate change <strong>and</strong> can even overturn pureclimatic effects (Suttle et al. 2007, Harmon et al. 2009).The problem is that while bioclimatic models often lackexplicit parameterization of biotic interactions (but seeAraújo <strong>and</strong> Luoto 2007, Heikkinen et al. 2007, Meier et al.2010), experimental approaches are generally not feasible.Here, we explore an alternative approach using matrices ofspecies spatial co-occurrences (the fundamental unit ofanalysis in community ecology <strong>and</strong> biogeography, Gotelli2000), derived from overlapping geographic distributionsto infer the consequences of climate change on assemblages897
Seite 2 • Ausgabe 01/2013 LifeInhaltSeite 2• Überprüfung der versiegeltenFlächen durch Luftbildauswertung imStadtgebiet SiegenSeite 3• Feierliche Eröffnung der KläranlageIstanbul/AtaköyAusbaugröße 2.000.000 EWSeite 4• Erfahrungsbericht TAZV OderaueEuropäische Fördermittel für denAufbau von Kanal- und TrinkwasserdatenbankenSeite 5• INSPIRE-konforme GIS-DatenSeiten 6/7• Ganzheitliche NetzsanierungDas Anlagevermögen der Kommunenliegt zu einem großen Teil inForm von Kanalnetzen unter der ErdeSeite 8• Vorbeugende Inst<strong>and</strong>haltung alsInstrument zur Reduzierung vonReinvestitionenSeite 9• Betriebsführungsservice beimWasserwirtschaftsamt vorgestellt• WTEB auf der Fachausstellung• enertec und TerraTec – Branchenauftaktdes Jahres 2013Seiten 10/11• Erweiterung und Modernisierung derKläranlage in LarnacaSeite 12• 10 Jahre BetriebsführungsmodellKläranlage RHV ZellerbeckenImpressumHerausgeber:WTE Betriebsgesellschaft mbHHecklingenGaensefurth 7-1039444 Hecklingenphone: +49 3925 9269-0fax: +49 3925 282231web: http://www.wteb.deRedaktionsleitung: Martin KnustWTE-Life ist auf Envirostar (aus 100 %Altpapier) gedrucktÜberprüfung der versiegeltenFlächen durch Luftbildauswertungim Stadtgebiet SiegenSeit dem 01.01.1996 werden in Siegen getrennteGebühren für Schmutz- und Niederschlagswassererhoben.• Die Schmutzwassergebühr wird auf derGrundlage der bezogenen Trinkwassermengeabgerechnet.• Bemessungsgrundlage für die Niederschlagswassergebührist die an das Kanalnetzangeschlossene und versiegelte(bebaute und/oder befestigte) Fläche aufdem Grundstück.Diese Flächen wurden bisher einmal in einerBefragungsaktion im Jahr 1995 ermitteltund werden seitdem nur fortgeschrieben.Derzeit werden von der Stadt Siegen insgesamt6.071.878 m² befestigte einleitendeFlächen von privaten Grundstücken mitder Niederschlagswassergebühr veranlagt.Das kanalisierte Stadtgebiet hat sich seitdemvergrößert. Dieses Anwachsen derversiegelten und bebauten Flächen wurdein den vergangenen Jahren nicht immerder Stadt Siegen mitgeteilt. Daher ist einegrundlegende Überprüfung der Flächennotwendig geworden.Die WTE hat hierzu im ersten Schritt insgesamt26.172 Grundstücke ausgewertet,die auf Grund der vorliegenden Kanaldatenbankdie Möglichkeit haben, Niederschlagswasserin die öffentliche Kanalisationeinzuleiten.Aus der digitalisiertenGesamtflächeund unterZuhilfenahmevon Vergleichsprojektenwurdeeine Flächenmehrungermittelt.Basierend aufden von der StadtSiegen gewährtenAb schlägen fürGründächer von50 % und fürÖkopflaster von100 %, erhieltenwir für dasVergleichs projekteinen Einleitegradvon 58,1 %.Dieser wurde aufdie Stadt Siegenübertragen. Die damit ermittelte Flächebetrug 6.705.243 m². Die erreichte Flächenmehrungentspricht ca. 10,4 %.Auf Grund dieser Betrachtung erteilte dieStadt Siegen der WTEB den Auftrag zurkompletten Erfassung aller versiegeltenFlächen mittels Eigentümerbefragung aufder Grundlage von grafischen Daten.Um alle Flächen auf einen aktuellen St<strong>and</strong>zu bringen und ggf. bisher noch nicht erfassteFlächen einer Abrechnung zuzuführen,wurden ab 31.08.2012 Erfassungsbögenan alle Grundstückseigentümerverschickt.Eine erste Hochrechnung der einleitendenFlächen ergab für die Stadt Siegen eineMehrfläche von ca. 700.000 m², welche inetwa der Analyse aus dem ersten Schrittentsprach.Mit dieser Hochrechnung wurden durchdie Stadt Siegen die neuen Gebühren für2013 kalkuliert. Das Ergebnis war eineSenkung der Niederschlagswassergebührvon mehr als einem Euro auf 0,96 C.Da das Projekt noch nicht komplett abgeschlossenist, kann über die tatsächlicheFlächenmehrung noch keine Aussage getroffenwerden. Sobald alle Erkenntnissevorliegen, werden wir an dieser Stelle überdie konkreten Ergebnisse berichten.Die Luftbildfotografie ist die Basis zur Berechnung der befestigten Flächenauf Grundstücken.KontaktBeitrag: Überprüfung der versiegelten Flächen durch LuftbildauswertungKay Watermann • Gebühren- und BeitragsmanagementTelefon: +49 3925 9269-3 3 • E-Mail: watermann@wteb.de
shared non-r<strong>and</strong>om properties prevents the opposinginterpretation; that is, that species responses to climatechange are driven by species individual requirements ordispersal alone. The truth might lie between these twoextremes. Thus, rather than opposing the view of individualisticvs assemblage responses to climate change, a morefruitful discussion is one based on measurements of therelative importance of interdependencies in different assemblages.Such dependencies can be explored using networkanalysis.The critical question then is how to measure suchinterdependencies. Several studies have measured interactionsbetween pairs of species with well-known ecologies(Nilsson 1988, Johnson <strong>and</strong> Steiner 1997), while othershave measured interactions among species in simplecommunities (Colwell 1973). Only recently have researchersstarted measuring pairwise interactions for relativelylarger groups of species (Camacho et al. 2002, Dunne et al.2002a, Milo et al. 2002, Bascompte et al. 2003, Garlaschelliet al. 2003), but usually with a focus on a particular type ofbiotic interaction (e.g. predation, dispersal, pollination).Naturally, the sheer number <strong>and</strong> complexity of direct <strong>and</strong>indirect interactions linking species within ecosystems is sogreat that their complete documentation is beyond reach.Making progress in underst<strong>and</strong>ing the role of complexinteractions as drivers of species distributional dynamics,<strong>and</strong> their responses to climate change, requires theinvestigation of alternative approaches, such as the one weexplore in this contribution.MethodsThe proposed framework involves 1) building spatial cooccurrencenetworks from a species co-occurrence matrix;2) making inferences about network robustness; 3) modellingthe exposure of individual species to climate change;<strong>and</strong> 4) investigating the relationship between measurementsof network robustness <strong>and</strong> species exposure to climatechange. An application of the proposed framework isprovided using geographical distributions comprising allterrestrial vertebrates of Europe. The data are used forillustration of the framework, rather than testing it.Building spatial networks of co-occurrenceSpatial networks of co-occurrence were built in 4 steps. Inshort, the procedure consists in measuring the number ofsites where species co-occur (step 1), generating the cooccurrencenetwork based on the measured distributionaloverlap between species distributions (step 2), pruning thenetwork from spurious links using a null model of expecteddistributional overlap between pairs of species (step 3), <strong>and</strong>use a known st<strong>and</strong>ard (the percolation threshold) foranalyzing <strong>and</strong> comparing network properties (step 4). Asynthetic description of this procedure is provided in Table1, where assumptions <strong>and</strong> shortcomings of each one of thesteps are summarized.Step 1 a pairwise BrayCurtis distance matrix wasconstructed to measure the degree of geographical cooccurrencein the distributions of pairs of species (Bray <strong>and</strong>Curtis 1957), but any distance metric could be used.Distances ranged from 0 to 100, with 100 representingcompletely non-overlapping distributions <strong>and</strong> 0 representingcompletely overlapping ones.Step 2 a spatial network of co-occurrence with speciestreated as nodes was built with software programmed byAR. Each link joining pairs of species was labelled with theBrayCurtis distance among them.Step 3 several connections between species may be dueto chance alone (Connor <strong>and</strong> Simberloff 1979). In order toremove these links from the network a null model wasgenerated. The general principle is that overlaps that areequal or lower from that expected by chance should bediscarded. Rather than generating the null model from ar<strong>and</strong>omized experiment (Blick <strong>and</strong> Burns 2009, Kones et al.2009), we addressed the problem analytically. Consider agiven geographical space occupied by r<strong>and</strong>omly locatednon-overlapping individuals, regardless of whether theypertain to the same species or not. Suppose we representthis environment by a two dimensional regular lattice of sizeANM. Then the probability P a of finding anindividual of species a in any r<strong>and</strong>omly chosen site can becalculated as P a N a /A, where N a is the number of sitesoccupied by species a. In this same context one can calculatethe probability of finding individuals of species a <strong>and</strong> bsimultaneously,P a&b P a P bTable 1. Stepwise approach for building networks of interactions using large scale species distributions. A discussion of the majorassumptions <strong>and</strong> caveats with each step in the framework is provided.Step Approach Assumptions Caveats1 Build pair wise geographicaldissimilarity matrix2 Construct unweighted or weightednetwork of interactions ingeographical space3 Remove interactions that are notmore likely than expected bychance4 Prune network of interactions byidentifying the percolation pointThe degree of spatial overlap in species distributionsindicates degree to which species can potentiallyinteract.If assumption 1 is correct, then distances can beconverted in network interactions.Pairwise interactions not greater than expected bychance are not ecologically meaningful.At large geographical scales all species interactdirectly or indirectly with one another, thus forminga connected network.Species may overlap but do not interacteither directly or indirectly.The same as in 1.Interactions may be no greaterthan expected by chance <strong>and</strong> still bemeaningful.Procedure with untested properties inecological systems. Needs empiricalvalidation.899
of finding just one species,P aORb P a (1P b )(1P a )P b P a P b 2P a P b<strong>and</strong> of finding neither species a or b in a r<strong>and</strong>omly chosensiteP a&b (1P b )(1P a )1P a P b P a P bThen it follows thatP a&b P aORb P a&b 1Consider now a multinomial r<strong>and</strong>om variable X(a,b) withthree possible states S{(i) site contains both species a <strong>and</strong>b, (ii) site contains one of the species a or b, (iii) sitecontains neither of the species, neither a nor b}. So it isexpected to find in average B(i)AP a&b sites in state(i), B(ii)AP aORb sites in state (ii) <strong>and</strong> B(iii)AP a&b sites in state (iii); with a variance of Var(i)A P a&b (1P a&b ), Var(ii)AP aORb (1-P aORb ) <strong>and</strong>Var(iii)AP a&b (1-P a&b ) respectively.In order to identify links between species that aredifferent from that expected by chance, we retain linksbetween pairs of species whose number of co-ocurrences iseither above B(i)2(Var(i)) 1/2 (attractive overlap) orbelow B(i)2(Var(i)) 1/2 (repulsive overlap).Step 4 once the network has been pruned from nonsignificantlinks, further removal of links is done afteridentification of the network’s percolation threshold. Thepercolation threshold is a mathematical term related topercolation theory, which is the formation of long-rangeconnectivity in r<strong>and</strong>om systems (Stauffer <strong>and</strong> Aharony1992). The percolation threshold is the critical value of theoccupation probability, or more generally a critical surfacefor a group of parameters, such that infinite connectivity(percolation) first occurs. As such, it is a particularly usefulpoint at which to examine networks as it represents theminimal set of links underlying network connectivity <strong>and</strong>provides a st<strong>and</strong>ard for comparing networks of different size<strong>and</strong> type. Below this threshold, a network is thought to loseits integrity <strong>and</strong> collapse into small clusters. In ourapplication, co-occurrence among species in the networkwas expected for connections representing BrayCurtisdistance just below the percolation threshold (Rozenfeldet al. 2008), st<strong>and</strong>ing for geographical overlapping above aminimal cut-off. The precise location of this threshold ismade with a st<strong>and</strong>ard methodology adapted for finitesystems (Stauffer <strong>and</strong> Aharony 1992), i.e. by calculatingthe average size BS * of the clusters excluding the largestone:ŽS 1 Xs 2 n s (1)N sBS maxas a function of the last distance value removed<strong>and</strong> identifying the critical distance with the one at whichBS * has a maximum. N is the total number of nodes notincluded in the largest cluster <strong>and</strong> n s is the number ofclusters containing s nodes.Making inferences about ecological networkrobustnessStarting with the working premise that co-occurrencenetworks provide a surrogate for potential interactionsamong species (but see summary of caveats in Table 1),three measures of robustness can be investigated (Table 2):species contributions to network robustness; species sensitivityto the loss of network nodes (i.e. species); <strong>and</strong> overallnetwork robustness or network resistance to species loss.Species contributions to network robustnessThe species contributions to network robustness are oftenexamined as a function of species degree k i ; that is, thenumber of species a given species interacts with. Theassumption is that the greater the degree of a species, thegreater its contribution to network robustness. In additionto k i , we also calculate a weighted measure of interactionintensity (Barrat et al. 2004), known as species strength(Bascompte et al. 2006). Species strength s i is a quantitativeextension of species degree, <strong>and</strong> can be defined as the sumof dependences d ij (or co-occurrence, see below) betweenpairs of species i <strong>and</strong> js i XNj1a ij d ij (2)where a ij determines whether species i <strong>and</strong> j are connected(a ij 1) or not (a ij 0). The loss of a species linked withseveral highly dependent species is considered to affectnetwork robustness more than a species with fewer linksTable 2. Measured network properties <strong>and</strong> their ecological interpretations.Indicator Measure DefinitionPairwise sensitivity to species loss Symmetry The degree to which the dependence of species A on species B isequal to the dependence of species B on the species A.Network robustness to species loss Degree distribution The frequency distribution of the individual species degree for theentire network.Strength distributionThe frequency distribution of the individual species strength (in) forSpecies contribution to networkrobustnessSpecies degreeSpecies strength (in)the entire network.The number of links that connect the focal species to the otherspecies. Assumes symmetrical interactions.A quantitative extension of species degree accounting for asymmetricalinteractions. It provides a weighted sum of the proportion of thegeographical distribution of B 1..n that overlaps with species A.Species sensitivity to network loss Species strength (out) A quantitative extension of species degree but accounts forasymmetrical interactions. It provides a weighted sum of theproportion of the geographical distribution of A that overlaps withB 1..n .900
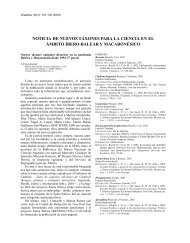
with less dependent species. In practice, measures ofstrength <strong>and</strong> degree tend to be correlated (Barrat et al.2004, Bascompte et al. 2006), but degree assumes dependenciesbetween species to be symmetrical whereas themeasure of strength incorporates the more realistic idea ofasymmetry between species dependences.The critical issue for measuring strength is to quantifythe level of dependence between pairs of species (d ij ). Innetworks of co-occurrence, species strength may be calculatedby first quantifying the proportion of the geographicaldistribution of species A that overlaps with species B <strong>and</strong>vice versa. The underlying ideas are that 1) the proportionof the geographical distribution of A that overlaps with Bprovides a surrogate of interaction intensity of species Awith B; <strong>and</strong> 2) this proportion is asymmetrical, such that,for example, the geographical distribution of A may overlapwith B to a greater extent than B overlaps with A (Fig. 1).Quantitatively, the degree of overlapping between A <strong>and</strong> Bis defined as O(A,B)(aSb)/a as the proportion of a (A’sarea) that overlaps b (B’s area). The degree of symmetry ofthe link is then calculated asS in (A) Xn iO(B i ; A) (4)Species sensitivity to the loss of links in the networkThe previous measures of degree (k) <strong>and</strong> strength (S in )provide indices allowing the quantification of the robustnessof small sets of interacting species to the loss of highlyconnected species. A third measure, herein termed strengthout (s out ), measures the sensitivity of individual species tothe loss of nodes in the network. Strength out does notcontribute to measuring network robustness; it measureshow dependent a species might be, given the potentialinteractions with other species: a high s out implies that thetarget species is highly dependent on other species, whilelow s out implies the opposite. Strength out can be measuredas the weighted sum of the proportion of the geographicdistribution of species A that overlaps with B 1..nS out (A) Xn iO(A; B i ) (5)½O(A; B) O(B; A)½Sim(A; B)Max[O(A; B); O(B; A)]where Sim(A,B) can get values in the interval [0,1]. In oneextreme of the interval (Sim0), the link is completelysymmetric. In the other (Sim1), the link is completelyasymmetrical so that, for example, A is fully nested in B.It follows that if O(A,B) is understood as a measure ofinteraction intensity (either direct or indirect) betweenspecies A <strong>and</strong> B, then we can define a measure of strengthsummarising how strongly other species may potentiallyinteract with A, measured as the weighted sum of theproportion of the geographical distribution of B 1..n thatoverlaps with species A. Thereafter, this measure will betermed strength in (S in )(3)Network robustnessThe former measures are focused on the properties ofsummed pairs of interacting species. To assess the overallrobustness of networks we need to investigate the collectiveproperties of degree (k) <strong>and</strong> strength (s in ). Following Dunneet al. (2002b), network robustness can firstly be investigatedby examination of the frequency distribution of the speciesdegree k i . That is, the frequency distribution of the numberof species a given species interacts with. Formally, thedistribution P(k) gives the proportion of species in thenetwork having degree k. Typically P(k) follows anexponential or power law (scale-free) distributions. Scalefreedistributions depict networks in which most species arepoorly connected with one another whereas a few species arewell connected. In the ecological literature, such wellconnectedspecies are termed keystones, whereas in thenetwork literature they are termed hubs. Scale-free degreefrequency distributions are expected to be very robust tor<strong>and</strong>om loss of species, because most species are poorlyconnected in the network thus being unlikely removed bychance. However, they are very sensitive to the chirurgicremoval of species with high k degree (Albert et al. 2000).In contrast, networks with exponential degree distributions,whereby a great proportion of species is highly connectedwith other species, are more sensitive to r<strong>and</strong>om removal ofspecies.Secondly, network robustness was investigated by examinationof the frequency distribution of the speciesstrength s i . That is, the frequency distribution of the sum ofdependencies between pairs of species (our measure of S in ).The distribution of P(s in ) is expected to generally have thesame properties as P(k) (Barrat et al. 2004).Figure 1. Graphical representation of symmetry in the geographicaldistribution between pairs of species: (a) species A dependsstrongly on species B, but species B does not depend strongly onspecies A; (b) species A <strong>and</strong> B depends moderately <strong>and</strong> equally onone another.Modelling exposure of individual species to climatechangeSpecies exposure to climate change was measured as dr i t future r i t baseline , where r is the distributional range ofspecies i at time t. In order to calculate d, individual species901
potential distributions were modelled with ensemble forecasting(Araújo <strong>and</strong> New 2007) based on four widely-usedbioclimatic envelope modelling techniques: 1) generalizedlinear models assuming a binomial error distribution(GLM, McCullagh <strong>and</strong> Nelder 1989); 2) mahalanobisdistance (MD, Farber <strong>and</strong> Kadmon 2003); 3) maximumentropy (MaxEnt, Phillips <strong>and</strong> Dudík 2008); <strong>and</strong> 4) geneticalgorithm for rule prediction (GARP, Stockwell <strong>and</strong> Peters1999). Maximum entropy <strong>and</strong> GARP were parameterisedusing the default options in MaxEnt <strong>and</strong> Open ModellerGARP. Internal evaluation of the models was performedwith a data split procedure, whereby 70% of the occurrencedata was r<strong>and</strong>omly split <strong>and</strong> used for calibration of themodels <strong>and</strong> the remaining 30% were used for crossevaluationof the models; this procedure was repeated 50times thus generating a 50-fold cross-validation of modelresults. For species with range size B10 cells, rather thanperforming a 50-fold cross validation, each of the n cellswith presence records were deleted once <strong>and</strong> the analyseswere repeated n times. Model accuracy was measured usingthe average True Skill Statistic (Allouche et al. 2006). Thisanalysis was performed to check if grossly implausibleprojections were being made (i.e. TSSB0.3). No specieswas removed based on this criterion <strong>and</strong> because measuresof accuracy on non-independent data do not provide areliable benchmark for evaluation of projections of speciesdistributional changes under climate change (Araújo et al.2005a), we instead used an unweighted consensus of thefour modelling techniques. Projections agreeing at least halfof the times were retained. With such approach potentialerrors associated with individual model projections are thussmoothed out in the consensus (Araújo et al. 2005b,Marmion et al. 2009). Nevertheless, final projections forcurrent <strong>and</strong> future periods were obtained with all knownrecords of occurrence, because bioclimate envelope modelshave been shown to be extremely sensitive to incompletenessof data in the calibration set (Araújo et al. 2009).Models were fitted with the BIOENSEMBLES software(Diniz-Filho et al. 2009).Assessing co-variation between robustness <strong>and</strong>exposure to climate changeThe two measures of network robustness can be comparedagainst measures of exposure of species to climate change.Such comparison allows addressing the question of whetherspecies with disproportionate contribution to networkrobustness, or species that are particularly sensitive to theloss of links in the network, are less or more exposed toclimate change than species with minor contributions tonetwork robustness or with small dependence on networkstructure.The case studyThe species distributions used to illustrate the frameworkincluded records of presence <strong>and</strong> absence for 58 amphibians,91 reptiles (Gasc et al. 1997), 233 breeding birds(Hagemeijer <strong>and</strong> Blair 1997), <strong>and</strong> 186 mammals (Mitchell-Jones et al. 1999). Data represents the majority of terrestrialvertebrates of Europe (only mammals <strong>and</strong> birds with lifecycleshighly dependent on water bodies were removed).The geographic grid used is based on that of the AtlasFlorae Europaeae (Lahti <strong>and</strong> Lampinen 1999), with cellboundaries typically following the 50 km lines of theUniversal Transverse Mercator (UTM) grid, except near theborder of the six-degree UTM zones <strong>and</strong> at coasts. Datawere converted to the AFE grid system by identifyingunique (although sometimes approximate) correspondencebetween cells in these grids. The mapped area (2089 gridcells) excludes most of the eastern European countries(except for the Baltic States) because of low recordingefforts in these areas (Williams et al. 2000).The bioclimate envelope models were constructed withthree variables (mean temperature of the coldest month(8C), mean temperature of the warmest month (8C), <strong>and</strong>mean annual summed precipitation (mm)) thought toreflect two properties of the climate temperature <strong>and</strong>water that have known roles in imposing constraints uponspecies distributions as a result of widely shared physiologicallimitations (Hawkins et al. 2003, Whittaker et al.2007). Variables were also checked for collinearity usingprincipal components analysis (PCA). The mean temperatureof the warmest month (highest loading in PCA 1) wasnearly orthogonal with mean summed precipitation (highestloading in PCA 2). The mean temperature of the coldestmonth was characterised with a vector 45 degrees from PCA1 <strong>and</strong> 2.Climate parameters were derived from an updatedversion of climate data provided by New et al. (2000).The updated data provides monthly values for the years19012000 in a 10? grid resolution (Schroter et al. 2005).Average monthly temperature <strong>and</strong> precipitation in grid cellscovering the mapped area of Europe were used to calculatemean values of three different climate parameters for theperiod 19611991 (referred to as ‘baseline data’). Futureprojections for 20202050 (referred to as the 2050scenario) were based on climate model outputs fromHadCM3 <strong>and</strong> made available through the IntergovernmentalPanel on Climate <strong>Change</strong> (IPCC) Data DistributionCentre (Bipcc-ddc.cru.uea.ac.uk). The modelledclimate anomalies were scaled based on the A1FI scenario(Nakicenovic <strong>and</strong> Swart 2000).ResultsNetwork structureCo-occurrence networks in the four groups of terrestrialvertebrates reveal different biogeographical structures(Fig. 2). Amphibians (median range size79) have a cooccurrencenetwork hub (i.e. with species highly connectedto other species) in the Iberian Peninsula <strong>and</strong> anothercentred in central Europe. Reptiles (median range size86)have two Mediterranean hubs (Iberian <strong>and</strong> Balkan peninsulas)<strong>and</strong> third centred in central Europe. Birds <strong>and</strong>mammals (median range sizes389 <strong>and</strong> 187 respectively),have a slightly more diffuse network structure with a mainhub in central Europe. Nevertheless, for birds, two smallerhubs are detected in the SW Mediterranean (including partsof the Iberian Peninsula <strong>and</strong> isl<strong>and</strong>s west of Italy) <strong>and</strong>902
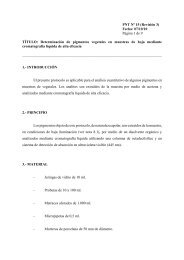
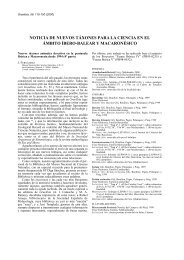
Figure 2. Spatial networks of co-occurrence among the European amphibians, reptiles, birds <strong>and</strong> mammals after removal of nonsignificantlinks (step 3 of the methods), <strong>and</strong> setting a threshold just below the percolation point (step 4 of the methods, Supplementarymaterial Fig. A1). Circles represent the centroids of species distributions in a lat long coordinate system, <strong>and</strong> their sizes are proportional tothe species degree (i.e. the number of links every species makes with other species). Lines represent the links between species. From top leftto bottom right: amphibians; reptiles; birds; <strong>and</strong> mammals.Sc<strong>and</strong>inavia. Mammals have a more diffuse central Europeannetwork structure extending to parts of Sc<strong>and</strong>inaviawith a small hub recorded in the Iberian Peninsula. Noticethat Fig. 2 plots nodes (species) <strong>and</strong> links (level of cooccurrencejust below the percolation threshold, Supplementarymaterial Fig. A1), with nodes being located at thecentre of each species range. Because species with restrictedranges are mainly in the south <strong>and</strong> to a smaller extent in thenorth, <strong>and</strong> species with wide ranges occur throughout mostof Europe, central European hubs mainly represent thecentroids of species that are widespread across Europe,whereas southern or northern hubs represent faunas nestedin smaller regions.Network robustnessEven though the spatial distribution of nodes <strong>and</strong> linksvaries between the four taxonomic groups, the empiricaldegree distribution P(k) (for definitions see Table 2)displays a power-law-like distribution that is typical ofmany complex networks (Fig. 3). Departures to a perfectpower law distribution do exist in our results, however. Thisis particularly true for birds <strong>and</strong>, to smaller extent,mammals since both taxa have more species with highdegree k i than expected. In other words, they have morespecies well connected in the network than expected from atypical power law distribution.The frequency distribution of species strength P(s in ) (fordefinitions see Table 2) also reveals a power-law-likedistribution for amphibians, reptiles <strong>and</strong> mammals, withthe distribution of strength (in) for birds displaying no clearstructure (Fig. 3). Inspection of the frequency distributionof the pairwise symmetries of co-occurrence between species(the measure used to calculate measures of strength, Table2), further reveals the existence of a left-skewed distributionfor most pairwise combinations of species (Fig. 4). In otherwords, most pairwise interactions (of co-occurrence) betweenspecies are asymmetrical.Species sensitivity to network lossStrength (out) is best characterised by a bell-shapedlikedistribution (Fig. 4). The distribution of s out foramphibians is slightly skewed to the left, meaning that agreat proportion of species are expected to be sensitiveto the loss of nodes in the network. The tendency forleft (negative) skews is recorded also for birds <strong>and</strong> mammalsbut the degree of skewness is generally low for all taxa(Fig. 4).Network properties <strong>and</strong> climate changeThe two measures of species’ contribution to networkrobustness, degree (k) <strong>and</strong> strength (s in ), display similar903
Figure 3. Distribution of degree (left panel), as defined by the probability of one species interacting with k species, <strong>and</strong> strength (in) (rightpanel) values, as defined by the sum of dependencies between the set of species B 1,n with species A. In the panels: a) st<strong>and</strong>s for amphibians;b) for reptiles; c) for birds; <strong>and</strong> d) for mammals. In r<strong>and</strong>om networks the degree <strong>and</strong> strength (in) distributions follows a Poissondistribution (or exponential if the number of nodes keeps growing), but in complex networks nodes tend to have few interactions <strong>and</strong> fewnodes are more connected than expected by chance. This heterogeneous distribution of degree <strong>and</strong> strength (in) is often described by apower law function. In a loglog plot, such as that above, this relationship is given by a linear slope for the entire range of degree <strong>and</strong>strength (in) values. The distribution of degree <strong>and</strong> strength (in) values was processed using a st<strong>and</strong>ard rebinning procedure described byAdami <strong>and</strong> Chu (2002). The distributions of strength (in) for birds does not follow a power-law like distribution, thus we show the resultswithout log-scaling the x axis.properties when compared against species’ exposure to 21stcentury climate change (Fig. 5). Essentially, amphibians,birds <strong>and</strong> mammals display a triangular relationship withover-dispersion of range-change values (d) for species withlow contribution to overall network robustness (low k <strong>and</strong>s in ). Species with high k degree <strong>and</strong> s in strength tend tocovary near the horizontal line of no-range-change, whichmeans that as species become more important to overallnetwork robustness they are also projected to be lessimpacted by climate change. This relationship is particularlymarked for birds <strong>and</strong> mammals <strong>and</strong> for themeasure of strength (s in ). For reptiles the pattern is slightlydifferent with a clear tendency for species gainingrange as a consequence of climate change being also thespecies that contribute more to robustness of the networks(Fig. 5).When examining the measure of species sensitivity tonetwork loss (s out ) against projected climate change impactson species, no clear pattern emerges (Fig. 5). If anything,there is a tendency for species with intermediate strengths(s out ) to over-disperse towards intermediate values, but thismay well be a consequence of the quasi-r<strong>and</strong>om distributionof strength (s out ) values (Fig. 4). Nevertheless there seems tobe a tendency for amphibian <strong>and</strong> reptile species with highdependence on network structure (high s out ) to be generallypositively affected by climate change (a few exceptions foramphibians). In contrast, the bird <strong>and</strong> mammal species thatgaining or losing more with climate change tend to havelow dependences on network structure.DiscussionThis study provides an approximation to using networkanalysis for assessments of climate change impacts onspecies. If one accepts that broad-scale interactions arereflected in patterns of overlapping distributions betweenspecies, then results invite the interpretation that 1) mostpairs of interacting species had asymmetrical interdependencies,2) most species displayed weak links thus atendency for individualistic behaviour, <strong>and</strong> 3) networksdescribing the geographic pattern of co-occurrence amongEuropean vertebrate species displayed general propertiesshared by other complex networks, namely a power-law (i.e.scale free) distribution of degree (k) <strong>and</strong> strength (s in ), withthe notable exception of networks for birds <strong>and</strong> mammals(the latter departing from scale free distribution only for k)(see also Azaele et al. 2010). Networks with scale-freedistributions are particularly robust to r<strong>and</strong>om losses ofnodes (Albert et al. 2000, Kaiser-Bunbury et al. 2010),while being sensitive to losses of well-connected hubs in thenetwork (Albert et al. 2000). Having characterised thetypology of the networks <strong>and</strong> identified the hubs that gluethem together the question that follows is whether withclimate change, such hubs would be affected. Here, speciesmore exposed to climate change tended to be poorlyconnected to other species within the network (low k <strong>and</strong>s in ), while the more connected species tended to be lessexposed to climate change. Low connectance for highlyexposed species <strong>and</strong> high connectance for species with lowexposure to climate change is good news. Poor connectance,904
Figure 4. Frequency distribution of asymmetry values betweenpairs of species, <strong>and</strong> strength (out), as defined by the sum ofdependencies between species A <strong>and</strong> B 1,n. . In each panel from topleft to bottom right: amphibians, reptiles, birds <strong>and</strong> mammals.or low distributional overlap, makes the networks speciesbelong to more robust to climate change because species areunlikely to be strongly associated with the distribution ofother species in the network. It also indicates that whileprojections assuming individualistic responses of species toclimate change are warranted for most cases, the generalproperties of interaction networks must be examined inorder to anticipate which species would exert greaterinfluence on the others <strong>and</strong> which would be moredependent on linkages with other species in the network.In other words, while most species display low connectanceor overlap with other species, some species do have a highdegree of connectance, thus supporting the hypothesis thatstrong interdependencies exist between species (but see thecautionary note below). Our framework provides one wayto begin exploring the consequences of climate change onFigure 5. Species degree (k), strength (sin) (degree to which focal species are needed by other species), <strong>and</strong> strength (sout) (degree to which focal species needs other networked species), plotted againstthe projected change (d) in the potential distribution of species under climate change. When d values are 0 the species are projected to exp<strong>and</strong> their ranges under climate change; when d values areB0 contractions are projected. In each panel from top left to bottom right: amphibians, reptiles, birds <strong>and</strong> mammals.905
complex networks of co-occurring species. The criticalquestion is whether co-occurrence networks provide inferencesabout functional properties of networks that would beuseful for biodiversity assessments of climate changeimpacts.The proposed framework rests on several assumptionsthat are largely untested <strong>and</strong> obviously are debatable; forexample, that the strength of the interactions between twospecies can be inferred from the number of sites where bothspecies coexist. Although co-occurrence networks are blindto the specific types of interactions involved, they docapture the essential fact that in order to interact, speciesmust typically coexist. One exception is competitiveexclusion, whereby spatial non-overlap is the outcomeof strong negative interactions. Spatial networks of cooccurrencemay thus be interpreted as summarizingpotential interactions between species rather than actualones. All other things being equal, one would expect regionswith highly spatially dependent faunas to indicate theexistence of functional interactions between species more sothan faunas with lower spatial interdependences.To avoid amalgamating likely <strong>and</strong> the unlikely interactions,as inferred from patterns of co-occurrence amongspecies, we proposed a methodology based on 1) removal oflinks that may arise by chance alone, <strong>and</strong> 2) further removalof links preventing the emergence of clear network structurethrough inferences based on percolation theory (Table 1).The proposed methodology rests on the assumption that allspecies are either directly or indirectly connected inecological systems <strong>and</strong> that spatial co-occurrence amongspecies is, at partly, a consequence of functional interactions.Obviously, this is not always the case <strong>and</strong> speciesmight co-occur due to shared physiological limitations orshared historical contingencies. For example, interactionhubs among amphibians <strong>and</strong> reptiles in the Mediterraneanare likely to reflect mechanisms of parapatric speciation <strong>and</strong>long-term population persistence in glacial refugia that werenot followed by inter-glacial expansion, possibly due tophilopatry <strong>and</strong> limited dispersal (Gasc et al. 1997, Holman1998, Araújo et al. 2008). The use of co-occurrencenetworks for practical assessments of biodiversity <strong>and</strong>climate change would thus require that an additional step3) is implemented to screen for the ecological realism of theinferred interactions. Such screening would involve basicconsiderations of scale (e.g. what is the minimum spatialresolution required to infer interactions from co-occurrencepatterns for particular groups of organisms?), as well asconsideration of relevant aspects of the auto-ecology of thespecies (e.g. what organisms are likely to interact with oneanother?).Previous attempts to factor biotic interactions intoassessments of climate change impacts on species distributionsare difficult to generalize as they typically involved alimited number of species in experimentally controlledenvironments (Davis et al. 1998, Suttle et al. 2007,Harmon et al. 2009), or use modelling approaches thatrequire information that is generally unavailable for mostspecies (Araújo <strong>and</strong> Luoto 2007), or tools that areconceptually incapable of h<strong>and</strong>ling interactions wherethey operate, i.e. in geographical space (see for discussionBaselga <strong>and</strong> Araújo 2009, 2010).The proposed framework is a first attempt to h<strong>and</strong>le acomplex problem using the theoretical framework <strong>and</strong>analytical toolboxes of network analysis <strong>and</strong> bioclimaticmodelling. We hope our contribution will motivate othersto test the predictions <strong>and</strong> assumptions of the frameworkherein proposed, particularly the proposed inferences aboutnetwork robustness <strong>and</strong> species sensitivity to loss of networklinks using co-occurrence networks. It is clear that not allpotential interactions are real, <strong>and</strong> in some cases it may bemore useful to explore bipartite networks that restrictanalysis to co-occurrence of preselected taxa based onknown functional relationships (Bascompte et al. 2006,Berg et al. 2009). But the important question is whether thegeneral patterns emerging from coarse biogeographicalanalysis of networks reflects underlying patterns in nature.In other words, if the general structure of hubs <strong>and</strong> links inthe network is maintained when actual interactions, ratherthan potential ones, are considered. A recent paper, showedthat patterns of species co-occurrence at coarse geographicalcontinental scales exhibit strong signals of interspecificinteractions (Gotelli et al. 2010). The authors revealed thatcommunity-wide patterns of spatial segregation amongDanish breeding birds could not be attributed to the patchydistribution of habitat, or to gross differences in habitatutilization among ecologically similar species. They proposedthat conspecific attraction in concert with interspecificterritoriality may result in spatially segregateddistributions of ecologically similar species at larger spatialscales when habitat patch size is limited. Finally, they alsoshowed that the effects of species interactions on communityassembly were pervasive <strong>and</strong> could be discerned at grainsizes up to four orders of magnitude larger than those ofindividual territories. More examples support the view thatspatial co-occurrence allows inferences to be about interactionsamong species. For example, Azeaele et al. (2010)demonstrated the usefulness of examining co-occurrencenetworks to uncover functional relationships between plantsin forest ecosystems. Another study empirically investigatedthe extent to which trophic relationships between speciescould be uncovered through the analysis of bipartitepredator-prey co-occurrence networks (Bell et al. 2010).The results of Bell et al. (2010) are encouraging in that thefeeding behaviour of the studied polyphagous beetles <strong>and</strong>spiders could be inferred with their particular implementationof co-occurrence networks. More studies investigatingthe extent to which co-occurrence networks can help inferfunctional interactions among species are obviously needed(see also Heikkinen et al. 2007, Meier et al. 2010), but ourprediction is that if errors arising from the simplifiedassumptions of co-occurrence networks are r<strong>and</strong>omlydistributed across taxa <strong>and</strong> regions, then functional networksbased on verifiable interactions between specieswould not change the overall patterns emerging from cooccurrencenetworks. This should be particularly true atcoarse resolutions where ‘ecological noise’ is reduced(Lawton 1999).ConclusionThe challenges posed by a rapidly changing climate <strong>and</strong> itsconsequences on biodiversity, requires a concerted effort of906
scientists in different disciplines. In this paper we haveadvanced an idea that builds on the interaction betweennetwork theory <strong>and</strong> bioclimatic modelling to generate asimple framework that can be use as a first approximationto tackle this challenge. We believe that network theoryprovides a suitable <strong>and</strong> powerful framework to address thecomplexities of climate change impacts on biodiversity,which in concert with simple co-occurrence matrices (thefundamental unit of analysis in community ecology <strong>and</strong>biogeography, Gotelli 2000) can pave the way to incorporatespecies interactions into the analysis of species responsesto climate change <strong>and</strong> further our underst<strong>and</strong>ing of theeffects of climate change on biodiversity.Acknowledgements This study is part of a broader researchprogram sponsored by the CSIC-PUC International Laboratoryfor <strong>Global</strong> <strong>Change</strong> (LINC-<strong>Global</strong>); MBA is also funded by ECFP6 ECOCHANGE project (036866-GOCE) <strong>and</strong> by the SpanishMinistry of Science <strong>and</strong> Innovation (CGL2008-01198-E/BOS);CR thanks the Danish National Research Foundation for itssupport of the Center for Macroecology, Evolution <strong>and</strong> Climate.PAM acknowledges support from FONDECYT-FONDAP 1501-0001, ICM P05-002 <strong>and</strong> CONICYT PFB-23.ReferencesAdami, C. <strong>and</strong> Chu, J. 2002. Critical <strong>and</strong> near-critical branchingprocesses. Phys. Rev. E66: 011907.Albert, R. et al. 2000. Error <strong>and</strong> attack tolerance of complexnetworks. Nature 406: 378382.Allouche, O. et al. 2006. Assessing the accuracy of speciesdistribution models: prevalence, kappa <strong>and</strong> the true skillstatistic (TSS). J. Appl. Ecol. 43: 12231232.Anderson, B. J. et al. 2009. Dynamics of range margins formetapopulations under climate change. Proc. R. Soc. B 276:14151420.Araújo, M. B. <strong>and</strong> Luoto, M. 2007. The importance of bioticinteractions for modelling species distributions under climatechange. <strong>Global</strong> Ecol. Biogeogr. 16: 743753.Araújo, M. B. <strong>and</strong> New, M. 2007. Ensemble forecasting of speciesdistributions. Trends Ecol. Evol. 22: 4247.Araújo, M. B. et al. 2005a. Validation of speciesclimate impactmodels under climate change. <strong>Global</strong> <strong>Change</strong> Biol. 11:15041513.Araújo, M. B. et al. 2005b. Reducing uncertainty in projections ofextinction risk from climate change. <strong>Global</strong> Ecol. Biogeogr.14: 529538.Araújo, M. B. et al. 2008. Quaternary climate changes explaindiversity among reptiles <strong>and</strong> amphibians. <strong>Ecography</strong> 31:815.Araújo, M. B. et al. 2009. Re-opening the climate envelope revealsmacroscale associations with climate in European birds. Proc. Natl Acad. Sci. USA 106: E45E46.Azaele, S. et al. 2010. Inferring plant ecosystem organization fromoccurrences. J. Theor. Ecol. 262: 323329.Barrat, A. et al. 2004. The architecture of complex weightednetworks. Proc. Natl Acad. Sci. USA 101: 37473752.Bascompte, J. 2007. Plantanimal mutualistic networks: thearquitecture of biodiversity. Annu. Rev. Ecol. Evol. Syst.38: 567593.Bascompte, J. et al. 2003. The nested assembly of plantanimalmutualistic networks. Proc. Natl Acad. Sci. USA 100: 93839387.Bascompte, J. et al. 2006. Asymmetric coevolutionary networksfacilitate biodiversity maintenance. Science 312:431433.Baselga, A. <strong>and</strong> Araújo, M. B. 2009. Individualistic vs communitymodelling of species distributions under climate change. <strong>Ecography</strong> 32: 5565.Baselga, A. <strong>and</strong> Araújo, M. B. 2010. Do community-level modelsdescribe community variation effectively? J. Biogeogr. 37:18421850.Bell, J. R. et al. 2010. Spatial co-occurrence networks predictfeeding histories of polyphagous arthropod predators at fieldscales. <strong>Ecography</strong> 33: 6472.Berg, M. P. et al. 2009. Adapt or disperse: underst<strong>and</strong>ing speciespersistence in a changing world. <strong>Global</strong> <strong>Change</strong> Biol. 16:587598.Blick, R. <strong>and</strong> Burns, K. C. 2009. Network properties of arborealplants: are epiphytes, mistletoes <strong>and</strong> lianas structured similarly? Perspect. Plant Ecol. Evol. Syst. 11: 4152.Bray, J. R. <strong>and</strong> Curtis, J. T. 1957. An ordination of the upl<strong>and</strong>forest communities of southern Wisconsin. Ecol. Monogr.27: 326349.Camacho, J. et al. 2002. Robust patterns in food web structure. Phys. Rev. Lett. 88: 228102-1228102-4.Clements, B. S. 1916. Plant succession: an analysis of thedevelopment of vegetation. Carnegie Inst. of Washington.Colwell, R. K. 1973. Competition <strong>and</strong> coexistence in a simpletropical community. Am. Nat. 107: 737760.Connor, E. F. <strong>and</strong> Simberloff, D. 1979. The assembly of speciescommunities: chance or competition? Ecology 60: 11321140.Davis, A. J. et al. 1998. Making mistakes when predicting shifts inspecies range in response to global warming. Nature 391:783786.Diniz-Filho, J. A. F. et al. 2009. Partitioning <strong>and</strong> mappinguncertainties in ensembles of forecasts of species turnoverunder climate change. <strong>Ecography</strong> 32: 897906.Dos Santos, D. A. et al. 2008. Sympatry inference <strong>and</strong> networkanalysis in biogeography. Syst. Biol. 57: 432448.Dunne, J. A. et al. 2002a. Food-web structure <strong>and</strong> network theory:the role of connectance <strong>and</strong> size. Proc. Natl Acad. Sci. USA99: 1291712922.Dunne, J. A. et al. 2002b. Network structure <strong>and</strong> biodiversity lossin food webs: robustness increases with connectance. Ecol.Lett. 5: 558567.Ebenman, B. <strong>and</strong> Jonsson, T. 2005. Using community viabilityanalysis to identify fragile systems <strong>and</strong> keystone species. Trends Ecol. Evol. 10: 568575.Eklof, A. <strong>and</strong> Ebenman, B. 2006. Species loss <strong>and</strong> secondaryextinctions in simple <strong>and</strong> complex model communities. J.Anim. Ecol. 75: 239246.Emslie, S. D. <strong>and</strong> Patterson, W. P. 2007. Abrupt recent shift ind13C <strong>and</strong> d15N values in Adélie penguin eggshell inAntarctica. Proc. Natl Acad. Sci. USA 104: 1166611669.Farber, O. <strong>and</strong> Kadmon, R. 2003. Assessment of alternativeapproaches for bioclimatic modeling with special emphasis onthe Mahalanobis distance. Ecol. Model. 160: 115130.Frakes, L. A. 1979. Climates throuhout geological time. Elsevier.Garlaschelli, D. et al. 2003. Universal scaling relations in foodwebs. Nature 423: 165168.Gasc, J.-P. et al. 1997. Atlas of amphibians <strong>and</strong> reptiles in Europe. Societas Europaea Herpetologica <strong>and</strong> Museum Nationald’Histoire Naturelle.Gotelli, N. J. 2000. Null model analyses of species co-occurrencepatterns. Ecology 81: 26062621.Gotelli, N. J. et al. 2010. Macroecological signals of speciesinteractions in the Danish avifauna. Proc. Natl Acad. Sci.USA 107: 50305035.907
Graham, R. W. <strong>and</strong> Grimm, E. C. 1990. Effects of global climatechange on the patterns of terrestrial biological communities. Trends Ecol. Evol. 5: 289292.Graham, R. W. et al. 1996. Spatial response of mammals toLate Quaternary environmental fluctuations. Science 272:16011606.Hagemeijer, W. J. M. <strong>and</strong> Blair, M. J. 1997. The EBCC atlas ofEuropean breeding birds, their distribution <strong>and</strong> abundance. Poyser.Harmon, J. P. et al. 2009. Species responses to environmentalchange: impacts of food web interactions <strong>and</strong> evolution. Science 323: 13471350.Hawkins, B. A. et al. 2003. Energy, water, <strong>and</strong> broad-scalegeographic patterns of species richness. Ecology 84: 31053177.Heikkinen, R. et al. 2007. Biotic interactions improve predictionof boreal bird distributions at macro-scales. <strong>Global</strong> Ecol.Biogeogr. 16: 754763.Holman, J. A. 1998. Pleistocene amphibians <strong>and</strong> reptiles inBritain <strong>and</strong> Europe. Oxford Univ. Press.Johnson, S. D. <strong>and</strong> Steiner, K. E. 1997. Long-tongued flypollination <strong>and</strong> evolution of floral spur lenght in the Disadraconis complex (Orchidaceae). Evolution 51: 4553.Kaiser-Bunbury, C. N. et al. 2010. The robustness of pollinationnetworks to the loss of species <strong>and</strong> interactions: a quantitativeapproach incorporating pollinator behaviour. Ecol. Lett. 13:442452.Keith, D. A. et al. 2008. Predicting extinction risks under climatechange: coupling stochastic population models with dynamicbioclimatic habitat models. Biol. Lett. 4: 560563.Kones, J. K. et al. 2009. Are network indices robust indicators offood web functioning? A Monte Carlo approach. Ecol.Model. 220: 370382.Lahti, T. <strong>and</strong> Lampinen, R. 1999. From dot maps to bitmaps Atlas Florae Europaeae goes digital. Acta Bot. Fenn. 162:59.Lawton, J. H. 1999. Are there general laws in ecology? Oikos 84:177192.Marmion, M. et al. 2009. Evaluation of consensus methods inpredictive species distribution modelling. Divers. Distrib.15: 5969.McCullagh, P. <strong>and</strong> Nelder, J. A. 1989. Generalized linear models. Chapman <strong>and</strong> Hall.Meier, E. S. et al. 2010. Biotic <strong>and</strong> abiotic variables showlittle redundancy in explaining tree species distributions. <strong>Ecography</strong> 33: 10381048.Milo, R. et al. 2002. Network motifs: simple building blocks ofcomplex networks. Science 298: 824827.Mitchell-Jones, A. J. et al. 1999. Atlas of European mammals. Academic Press.Nakicenovic, N. <strong>and</strong> Swart, R. (eds) 2000. Emissions scenarios: aspecial report of working group III of the intergovernmentalpanel on climate change. Cambridge Univ. Press.New, M. et al. 2000. Representing twentieth century spacetimeclimate variability. Part 2: development of 190196monthly grids of terrestrial surface climate. J. Clim. 13:22172238.Nilsson, L. 1988. The evolution of flowers with deep corolla tubes. Nature 334: 147149.Pearson, R. G. <strong>and</strong> Dawson, T. E. 2003. Predicting the impactsof climate change on the distribution of species: are bioclimateenvelope models useful? <strong>Global</strong> Ecol. Biogeogr. 12:361371.Phillips, S. J. <strong>and</strong> Dudík, M. 2008. Modeling of speciesdistributions with Maxent: new extensions <strong>and</strong> a comprehensiveevaluation. <strong>Ecography</strong> 31: 161175.Proulx, S. R. et al. 2005. Network thinking in ecology <strong>and</strong>evolution. Trends Ecol. Evol. 20: 345353.Rozenfeld, A. F. et al. 2008. Network analysis identifies weak <strong>and</strong>strong links in a metapopulation system. Proc. Natl Acad.Sci. USA 105: 1882418829.Salomon, Y. et al. 2010. Effects of asymmetric dispersal onthe coexistence of competing species. Ecol. Lett. 13: 432441.Schroter, D. et al. 2005. Ecosystem service supply <strong>and</strong> vulnerabilityto global change in Europe. Science 310: 13331337.Simakova, A. N. 2006. The vegetation of the russian plain duringthe second part of the Late Pleistocene (3318 ka). Quat. Int. 149: 110114.Stauffer, D. <strong>and</strong> Aharony, A. 1992. Introduction to percolationtheory. Taylor <strong>and</strong> Francis.Stewart, J. R. 2009. The evolutionary consequencs of theindividualistic response to climate change. J. Evol. Biol.22: 23632375.Stockwell, D. R. B. <strong>and</strong> Peters, D. P. 1999. The GARP modellingsystem: problems <strong>and</strong> solutions to automated spatial prediction. Int. J. Geogr. Inform. Syst. 13: 143158.Suttle, K. B. et al. 2007. Species interactions reverse grassl<strong>and</strong>responses to changing climate. Science 315: 640642.Thomson, J. N. 2005. The geographic mosaic of coevolution. Univ. of Chicago Press.Tylianakis, J. M. et al. 2008. <strong>Global</strong> change <strong>and</strong> speciesinteractions in terrestrial ecosystems. Ecol. Lett. 11: 13511363.Whittaker, R. J. et al. 2007. Geographic gradients of speciesrichness: a test of the waterenergy conjecture of Hawkins etal. (2003) using European data for five taxa. <strong>Global</strong> Ecol.Biogeogr. 16: 7689.Williams, J. W. et al. 2001. Dissimilarity analysis of late-quaternayvegetation <strong>and</strong> climate in eastern North America. Ecology82: 33463362.Williams, P. H. et al. 2000. Endemism <strong>and</strong> important areas forrepresenting European biodiversity: a preliminary explorationof atlas data for plants <strong>and</strong> terrestrial vertebrates. Belg. J.Entomol. 2: 2146.Supplementary material (Appendix E6919 at ). Appendix 1.908