Vanham & Bidoglio 2013.pdf - Water Footprint Network
Vanham & Bidoglio 2013.pdf - Water Footprint Network
Vanham & Bidoglio 2013.pdf - Water Footprint Network
- No tags were found...

You also want an ePaper? Increase the reach of your titles
YUMPU automatically turns print PDFs into web optimized ePapers that Google loves.
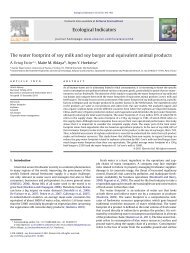
Ecological Indicators 26 (2013) 61–75Contents lists available at SciVerse ScienceDirectEcological Indicatorsjo ur nal homep age: www.elsevier.com/locate/ecolindReviewsA review on the indicator water footprint for the EU28Davy <strong>Vanham</strong> ∗ , Giovanni <strong>Bidoglio</strong>European Commission, Joint Research Centre, Institute for Environment and Sustainability, Via E. Fermi 2749, 21027 Ispra (VA), Italya r t i c l e i n f oArticle history:Received 7 May 2012Received in revised form 10 October 2012Accepted 17 October 2012Keywords:<strong>Water</strong><strong>Water</strong> footprintVirtual waterEuropean Union (EU)a b s t r a c tThe water footprint (WF) is an indicator that accounts for both the direct (domestic water use) and indirect(water required to produce industrial and agricultural products) water use of a consumer or producer.This paper makes a review on the WF indicator and its applicability for EU28 (EU27 and Croatia) policy.More particularly the volumetric WF assessment approach of the <strong>Water</strong> <strong>Footprint</strong> <strong>Network</strong> (WFN) isreviewed. A synthesis of existing national WF accounting quantities results in an EU28 WF of production(WF prod ) of 3420 lcd (609 km 3 /yr) and a WF of consumption (WF cons ) of 4815 lcd (857 km 3 /yr). Of thelatter 60% is internal and 40% is external to Europe. The EU28 is a net virtual water importer. The WF ofagricultural products contributes by far the largest fraction of the total WF, i.e. 91% of the total WF prodand 89% of the WF cons . With traditional water use statistics, awareness campaigns and policy have alwaysfocused on increasing water efficiency in domestic and industrial water use. However, much more watercan be saved in agricultural production processes, by reducing food waste and by a change in diet ofthe average EU consumer. Together with a comprehensive overview on possible ways to reduce WF,this paper provides a critical review on the WF methodology, showing that the development of the WFconcept is still not complete. Practical complexities with data (availability of and inconsistencies in theunderlying databases) are a concern. Some conceptual aspects need to be further developed and tested,not at least the indicators for sustainability assessment. The most important limitation is the fact that itis a partial tool to be used in combination with other analytical means or indicators when determiningintegrated policy options. Nevertheless, its main strength is the possibility to show the importance ofconsumption patterns and global dimensions in water governance.© 2012 Elsevier Ltd. All rights reserved.Contents1. Introduction . . . . . . . . . . . . . . . . . . . . . . . . . . . . . . . . . . . . . . . . . . . . . . . . . . . . . . . . . . . . . . . . . . . . . . . . . . . . . . . . . . . . . . . . . . . . . . . . . . . . . . . . . . . . . . . . . . . . . . . . . . . . . . . . . . . . . . . . . . 612. WF definitions and approaches . . . . . . . . . . . . . . . . . . . . . . . . . . . . . . . . . . . . . . . . . . . . . . . . . . . . . . . . . . . . . . . . . . . . . . . . . . . . . . . . . . . . . . . . . . . . . . . . . . . . . . . . . . . . . . . . . . . . . . 623. Quantification of the water balance and WF accounting of the EU28 . . . . . . . . . . . . . . . . . . . . . . . . . . . . . . . . . . . . . . . . . . . . . . . . . . . . . . . . . . . . . . . . . . . . . . . . . . . . . . . 633.1. Data sources . . . . . . . . . . . . . . . . . . . . . . . . . . . . . . . . . . . . . . . . . . . . . . . . . . . . . . . . . . . . . . . . . . . . . . . . . . . . . . . . . . . . . . . . . . . . . . . . . . . . . . . . . . . . . . . . . . . . . . . . . . . . . . . . . . . 633.2. <strong>Water</strong> balance . . . . . . . . . . . . . . . . . . . . . . . . . . . . . . . . . . . . . . . . . . . . . . . . . . . . . . . . . . . . . . . . . . . . . . . . . . . . . . . . . . . . . . . . . . . . . . . . . . . . . . . . . . . . . . . . . . . . . . . . . . . . . . . . . 643.3. The volumetric approach for WF accounting . . . . . . . . . . . . . . . . . . . . . . . . . . . . . . . . . . . . . . . . . . . . . . . . . . . . . . . . . . . . . . . . . . . . . . . . . . . . . . . . . . . . . . . . . . . . . . . . . 653.3.1. WF accounting for the EU28 . . . . . . . . . . . . . . . . . . . . . . . . . . . . . . . . . . . . . . . . . . . . . . . . . . . . . . . . . . . . . . . . . . . . . . . . . . . . . . . . . . . . . . . . . . . . . . . . . . . . . . . . 653.3.2. Regional differences within the EU28 . . . . . . . . . . . . . . . . . . . . . . . . . . . . . . . . . . . . . . . . . . . . . . . . . . . . . . . . . . . . . . . . . . . . . . . . . . . . . . . . . . . . . . . . . . . . . . 674. Possible ways to reduce water footprints . . . . . . . . . . . . . . . . . . . . . . . . . . . . . . . . . . . . . . . . . . . . . . . . . . . . . . . . . . . . . . . . . . . . . . . . . . . . . . . . . . . . . . . . . . . . . . . . . . . . . . . . . . . . 715. Critical aspects on the WF concept . . . . . . . . . . . . . . . . . . . . . . . . . . . . . . . . . . . . . . . . . . . . . . . . . . . . . . . . . . . . . . . . . . . . . . . . . . . . . . . . . . . . . . . . . . . . . . . . . . . . . . . . . . . . . . . . . . . 736. Implications for EU28 policies . . . . . . . . . . . . . . . . . . . . . . . . . . . . . . . . . . . . . . . . . . . . . . . . . . . . . . . . . . . . . . . . . . . . . . . . . . . . . . . . . . . . . . . . . . . . . . . . . . . . . . . . . . . . . . . . . . . . . . . . 747. Conclusions . . . . . . . . . . . . . . . . . . . . . . . . . . . . . . . . . . . . . . . . . . . . . . . . . . . . . . . . . . . . . . . . . . . . . . . . . . . . . . . . . . . . . . . . . . . . . . . . . . . . . . . . . . . . . . . . . . . . . . . . . . . . . . . . . . . . . . . . . . . 74Disclaimer . . . . . . . . . . . . . . . . . . . . . . . . . . . . . . . . . . . . . . . . . . . . . . . . . . . . . . . . . . . . . . . . . . . . . . . . . . . . . . . . . . . . . . . . . . . . . . . . . . . . . . . . . . . . . . . . . . . . . . . . . . . . . . . . . . . . . . . . . . . . 75References . . . . . . . . . . . . . . . . . . . . . . . . . . . . . . . . . . . . . . . . . . . . . . . . . . . . . . . . . . . . . . . . . . . . . . . . . . . . . . . . . . . . . . . . . . . . . . . . . . . . . . . . . . . . . . . . . . . . . . . . . . . . . . . . . . . . . . . . . . . . 751. Introduction∗ Corresponding author.E-mail addresses: davy.vanham@jrc.ec.europa.eu, davy.vanham@yahoo.de(D. <strong>Vanham</strong>).The <strong>Water</strong> Framework Directive (WFD) is a key piece of EU legislationaimed at improving water quality across EU Member States(European Commission, 2010). It is now recognized that the 2015objectives of Good Ecological Status will be hardly achievable due1470-160X/$ – see front matter © 2012 Elsevier Ltd. All rights reserved.http://dx.doi.org/10.1016/j.ecolind.2012.10.021
62 D. <strong>Vanham</strong>, G. <strong>Bidoglio</strong> / Ecological Indicators 26 (2013) 61–75to old and emerging challenges both related to water quality andquantity (e.g. over-abstraction, water scarcity, impacts of climatechange) (EEA, 2010). The 2012 Blueprint to Safeguard Europe’s<strong>Water</strong> is the EU policy response to such challenges. It is closelyrelated to the EU 2020 strategy and in particular to the Roadmapto a Resource Efficient Europe.The concepts of water footprint (WF) and virtual water (VW)may be relevant in the implementation of the policy options identifiedby the Blueprint. Indeed, by addressing water efficiency acrosscommodity supply-chains, they can influence drivers of consumptionand foster implementation of sustainable water managementsolutions. An assessment of the efficacy of the WF approaches andhow they can be applied in policy is essential.Within this paper an overview of WF definitions and approachesis given. The volumetric WF assessment approach of the <strong>Water</strong><strong>Footprint</strong> <strong>Network</strong> (WFN) is reviewed taking the EU28 countriesas study case (Croatia will join the EU27 on the 1st July 2013). Awater balance is quantified based upon existing data and values forWF accounting are synthetized based upon national data from theWFN. Such a synthesis for the EU is currently not available in theliterature. In view of its strengths and weaknesses, the approach isthen discussed for its potential support to impact assessments ofwater policies.Detailed national WF studies have been conducted for Europeancountries, e.g. Aldaya et al. (2008), Sonnenberg et al. (2009),Van Oel et al. (2009), and <strong>Vanham</strong> (in press) and countries outsideEurope, e.g. Bulsink et al. (2010), Liu and Savenije (2008), andVerma et al. (2009). These studies include blue and green water.Following the definition of Rockström et al. (2009), green water isthe soil water held in the unsaturated zone, formed by precipitationand available to plants, while blue water refers to liquid water inrivers, lakes, wetlands and aquifers. Irrigated agriculture receivesblue water (from irrigation) as well as green water (from precipitation),while rainfed agriculture only receives green water. The latteris the dominant type of cultivation in northern and western Europeancountries. Traditional water use statistics only account forblue water. Conventional approaches to water management havefocused on managing solely the blue component of the water cycle.Different authors – e.g. Falkenmark and Lannerstad (2007), <strong>Vanham</strong>(2012), Falkenmark (2003) – however, recommend to include greenwater in water management studies. Rainfed agriculture is thelargest (green) water user worldwide. Irrigated agriculture is thelargest blue water user worldwide. There are now many studiesthat include the green component of the water cycle, e.g. Glavanet al. (2012) and Willaarts et al. (2012).2. WF definitions and approachesTwo main approaches for the assessment of the WF exist inthe literature (UNEP, 2012; Postle et al., 2012): (1) the volumetricapproach as developed by the <strong>Water</strong> <strong>Footprint</strong> <strong>Network</strong> (WFN)(Hoekstra et al., 2011) and (2) the Life Cycle Analysis approach asdeveloped by the LCA community (which includes the weighted WFapproach). The different stages in WF assessment (WFA) and lifecycle assessment (LCA) are displayed in Fig. 1. In this paper onlythe volumetric approach of the WFN – a well-established methodology(Gleeson et al., 2012) – is reviewed, as most of existingWF studies to-date follow this approach (Hastings and Pegram,2012). Relevant for the EU28 review is the WF for a geographicalregion/community/nation, in this case the EU28.The WF was introduced in 2002 as an indicator of freshwateruse that looks at both direct and indirect water use of a consumeror producer (UNEP, 2012). The WF of an individual, community orbusiness is defined as the total volume of freshwater that is usedto produce the goods and services consumed by the individual orcommunity or produced by the business. An important distinctionneeds to be made between the WF of production (WF prod ) andthe WF of consumption (WF cons ) (Fig. 1) of a geographical region(EU28). The first is the sum of direct and indirect water use ofdomestic water resources. The second is the sum of direct andindirect water use of domestic and foreign water resources throughdomestic consumption. A balance between the two is reached byvirtual water flows (import and export), which result from the tradein industrial and agricultural products. The WF cons can be calculatedby means of the top-down or bottom-up approach. Within the topdownapproach, the WF cons equals the WF prod plus the virtual waterimport (VW i ) minus the virtual water export (VW e ). The bottom-upapproach is based upon direct underlying data on consumption.The WF consists of three (green, blue and grey water) components(Fig. 1). The WF can be presented as one aggregate number,but in fact it is a multidimensional indicator of water use, showingdifferent sorts of water consumption and pollution as a functionof space and time. For developing strategies for sustainable wateruse, one will need to use the more detailed layer of informationembedded in the composite (green, blue and grey) WF indicator.Fig. 2 shows the WF accounting scheme for a geographical area.It shows the various balances that hold for the WF. The WF prod plusVW i equal the WF cons plus VW e . A geographical area imports andexports virtual water. Net virtual water import or export is definedas the difference between import and export. If a geographical areaimports more virtual water than it exports, it is a net virtual waterimporter. If it exports more than it imports, it becomes a net virtualwater exporter.The WF is an indicator of water use. In order to have an ideawhat this footprint size means, it needs to be compared withavailable resources (sustainability assessment). WF sustainabilityassessment is the phase in WF assessment (Fig. 1) that aims to evaluatewhether a certain WF is sustainable from an environmental,social, as well as economic point of view. The latter is discussed indetail in Hoekstra et al. (2011) and UNEP (2011).Of the geographical environmental sustainability indicators(green and blue water scarcity and water pollution level), theblue water scarcity indicator is the most developed and currentlyapplied, e.g. in Hoekstra et al. (2012). It is calculated by dividing theblue WF prod by the ecological blue water availability (hydrologicalwater availability minus environmental flows) in the geographicalarea (Fig. 3). It provides an indication of the degree of violation ornon-violation of environmental flow requirements. It differs frompredecessors (listed in UNEP, 2012) in the sense that (1) the WF prodincorporates water consumption and not water withdrawal; (2)natural rather than actual runoff is assessed; (3) it takes environmentalflows into account; (4) the time step should be monthlyrather than annual.The green water scarcity indicator is calculated by dividing thegreen WF prod by the green water availability of a geographicalregion, where the latter is defined as the total evapotranspiration(ET) of rainwater from land (ET green ) minus the ET from landreserved for natural vegetation (ET env ) and minus the ET from landthat cannot be made productive. This indicator has however notyet been applied in case studies (UNEP, 2012). The water pollutionlevel indicator is obtained by dividing the sum of all grey WF prod ina catchment to its actual runoff. Social and economic indicators arestill to be further developed. More conditions to address total (environmental,social, economic) sustainability of the WF are: (1) thetotal WF cons remains below a fair share in the world and (2) the WF(all green, blue and grey) of production processes – of products producedand consumed in the region – cannot be reduced or avoided(at acceptable societal cost). The latter refers to the global contextof scarce water and land resources. When the green, blue or greyWF in a catchment does not fulfil one of the criteria of environmental,social or economic sustainability, the WF cannot be consideredas ‘geographically sustainable’.
D. <strong>Vanham</strong>, G. <strong>Bidoglio</strong> / Ecological Indicators 26 (2013) 61–75 63Fig. 1. Different stages in life cycle assessment (LCA) and in the water footprint assessment (WFA). For the volumetric WFA approach details on WF accounting for aregion/community are displayed.Sources: Hoekstra et al. (2011) and UNEP (2012).3. Quantification of the water balance and WF accountingof the EU283.1. Data sourcesDetailed data on national agricultural production and consumptionare available from FAOSTAT (2012). EUROSTAT assembles dataon water quantity from national statistical offices. An overview ondata sources to quantify the EU28 water balance and WF accountingis given in Table 1. These quantifications are the result of a synthesisof national values from the EU Member States as depicted in Fig. 4.National average annual values for the hydrological waterbalance components – precipitation (P), evapotranspiration (ET)and (internal and external) renewable water resources (RWR)– were obtained from EUROSTAT (2012). <strong>Water</strong> use statistics(water withdrawals) for the period 1996–2005 for the differentsectors – municipalities, agriculture, manufacturing industries andcooling water for electricity generation – were also obtained fromEUROSTAT (2012). Within the paper, water use for municipalitiesor domestic water use is defined as the water use of householdsand small businesses. Agricultural water use is defined as water useby irrigation and livestock. The water use for manufacturing industriesis defined as the water use in all facilities producing industrialproducts. National water consumption values (blue water andgreen water) were obtained from the reports (Mekonnen andHoekstra, 2010, 2011), which are average annual values for theperiod 1996–2005.National WF accounting values were obtained from the WF<strong>Network</strong> publications, more specifically the report (Mekonnenand Hoekstra, 2011). The WF cons of agricultural products is
64 D. <strong>Vanham</strong>, G. <strong>Bidoglio</strong> / Ecological Indicators 26 (2013) 61–75Fig. 2. Geographic WF accounting scheme for a geographical area. The colours green, blue and grey represent the green, blue and grey components of the WF and VW.Adapted from Hoekstra et al. (2011) and UNEP (2011). (For interpretation of the references to color in this figure legend, the reader is referred to the web version of thearticle.)here calculated by means of the bottom-up approach, while theWF cons of industrial products by means of the top-down approach(Hoekstra et al., 2011; Mekonnen and Hoekstra, 2011). Data onproduction, consumption and trade of agricultural products wereobtained from EUROSTAT (2012) and FAOSTAT (2012). VW flowscalculated in these reports are based on trade data.3.2. <strong>Water</strong> balanceA general water balance for the EU28 including blue water usewithdrawals (and consumption) as well as green crop water consumptionis shown in Fig. 5. Of an annual average precipitation of3521 km 3 , 2045 km 3 is evapotranspirated and 1481 km 3 are internalrenewable water resources (RWR). Of the latter, 251 km 3 (17%)of blue water are withdrawn for different purposes. The largestfraction of blue water withdrawals is cooling water for electricitygeneration (100 km 3 ). Municipal water withdrawals accountfor 49 km 3 , of which 4 km 3 (8%) are consumed and the remaining45 km 3 returned to the water system. <strong>Water</strong> withdrawals forthe manufacturing industry (12% of total abstraction) account for31 km 3 of which 7 km 3 are consumed. More than 50% of the latterwater withdrawals occur in IT, DE and FR. Since the mid-1990s,the amount of these water withdrawals in Europe has steadilybeen falling despite continued expansion of industrial output (EEA,Table 1Data sources used within the paper, for the EU28 water balance or WF accounting.Data Period Data source PurposeHydrological water balance components Long termEUROSTAT (2012) <strong>Water</strong> balanceaverage annualvalues<strong>Water</strong> withdrawal statistics 1996–2005 EUROSTAT (2012) <strong>Water</strong> balanceBlue water consumption statistics 1996–2005 Mekonnen and Hoekstra (2011) <strong>Water</strong> balance & WF accountingCrop green water consumption statistics 1996–2005 Mekonnen and Hoekstra (2010) <strong>Water</strong> balance & WF accountingPopulation and surface area 1996–2005 FAOSTAT (2012) WF accountingProduction and consumption values for agricultural products 1996–2005 FAOSTAT (2012) WF accountingVirtual water content (VWC) of agricultural products, WF prod 1996–2005 Mekonnen and Hoekstra (2011) WF accountingand WF cons values, VW flows (import and export)Trade data 1996–2005 EUROSTAT (2012) and FAOSTAT (2012) WF accounting
D. <strong>Vanham</strong>, G. <strong>Bidoglio</strong> / Ecological Indicators 26 (2013) 61–75 65Fig. 3. Environmental, social and economic indicators for WF sustainability assessment.Sources: Hoekstra et al. (2011) and UNEP (2011).2009; EUROSTAT, 2012), basically due to higher water efficiencies,but also due to the decline of water-intensive heavy industries(like steel manufacturing) in favour of extra-EU countries. <strong>Water</strong>withdrawals for agriculture (28% of total abstraction) account for71 km 3 , of which 30 km 3 are consumed by irrigation and 6 km 3by livestock. The largest blue water consumer in the EU is thusirrigation. The crops maize, olives, cotton, rice and grapes accountfor more than 50% of blue water consumption in the EU. ES and ITaccount for two thirds of irrigation water withdrawals in the EU.Together with GR, PT and FR they account for 96% of EU irrigationwithdrawals.According to Mekonnen and Hoekstra (2011), productive grazingin the EU accounts for a green water consumption of 55 km 3 ,whereas green crop consumption amounts to 396 km 3 . The latter ismore than 10 times the blue water consumption (irrigation) of cropproduction, i.e. in the EU, green crop consumption accounts for 93%of total crop water consumption and blue water consumption onlyfor 7%. Worldwide these values are 86% and 14%. Crop green waterconsumption in the EU accounts for 7% of total global crop greenwater consumption, whereas the EU value for irrigated consumptionis 3% of the global value. The most important crops regardinggreen water consumption in the EU are wheat, fodder crops, barleyand maize. Substantial amounts can be accounted to olives, grapes,rapeseed, sunflower, potato, sugar beet and rye. Most importantcountries regarding green crop water consumption are FR, ES, IT,PL, DE and RO.3.3. The volumetric approach for WF accounting3.3.1. WF accounting for the EU28Fig. 6 shows production and consumption amounts for the differentagricultural product groups for the EU28. Fig. 7 shows themost important products in terms of quantity produced, consumed,or WF quantity as well as their virtual water content (VWC) asa global average or as a EU28 average. The figure shows thatspecific agricultural products are very water intensive (requirehigh amounts), like meat (e.g. bovine meat 15,409 m 3 /ton), butalso stimulants (e.g. coffee 15,897 m 3 /ton) or vegetable oils (oliveoil 14,725 m 3 /ton). Certain products, which are produced in largequantities within the EU28 (e.g. potatoes 76 million ton (Mt)) have arelative low VWC (VWC EU28 for potatoes 175 m 3 /ton). The WF prod ofwheat, e.g. is quite high because it is produced in very high amounts(131 Mt) with a considerable VWC (VWC EU28 928 m 3 /ton). The figureshows that for almost all products the VWC EU28 is considerablylower than the VWC glob . This means that it requires less VW toproduce the same amount of product in the EU28 as compared toglobally. The value of the VWC is a measure for water efficiency, andis dependent on production methods (yield, method of irrigation,etc.), but also natural conditions (climate and soil). Therefore itcan differ substantially for different regions, even for neighbouringfarmers. This means that also within the EU28 important differencesexist. Wheat, e.g. has a lower VWC in western Europe (e.g.DE 788 m 3 /ton) and northern Europe (e.g. UK 607 m 3 /ton) as comparedto southern Europe (e.g. ES 1476 m 3 /ton) or eastern Europe(e.g. RO 1779 m 3 /ton).The geographic WF accounting scheme for the EU28 (Fig. 8)shows a WF prod of 3420 l per capita per day or lcd (609 km 3 ) and aWF cons of 4815 lcd (857 km 3 ). The internal WF cons is 2869 lcd (60%of the total WF cons ) and the external WF cons is 1946 lcd (40% ofthe total WF cons ). Products which contribute to a high externalproportion of the WF cons in the EU28 are coffee and cocoa beans.Other products that are almost entirely imported include cottonand soybeans. The latter are generally used for feed: e.g. the averageannual net import of soybeans and soybean cake was 33 Mt,primarily from Brazil. Based on trade data calculations, the VW iamounts to 2364 lcd and the VW e to 645 lcd. The EU28 is thus a netVW importer. However, the balance WF prod plus VW i equals WF consplus VW e does not hold. The component values are not absolute and
66 D. <strong>Vanham</strong>, G. <strong>Bidoglio</strong> / Ecological Indicators 26 (2013) 61–75Fig. 4. (a) The four different zones of the EU28. The countries are divided in 4 geographical zones (according to the UN standard country or area codes and geographicalregions): eastern, northern, southern and western. (b) The countries of the EU28 with their respective codes, population (POP, in 10 6 ) and population density (POPD, inpersons per km 2 ). POP and POPD are average values for the period 1996–2005.Data source: FAOSTAT (2012). For the EU27 POP 483.3 and POPD 112; for the EU28 POP 487.9 and POPD 111.have to be regarded as best estimates based upon direct underlyingdata on production, trade or consumption.For both the WF prod and WF cons (Fig. 9), the WF of agriculturalproducts is by far the most dominant (3100 lcd or 91% for the WF prodand 4265 lcd or 89% for the WF cons ). Agricultural green water consumptionaccounts for about 74% of both the WF prod and WF cons .The green WF prod (451 km 3 or 2534 lcd) as displayed in Fig. 9, correspondsto the green water consumption value given in Fig. 5for crop production (396 km 3 ) and grazing (55 km 3 ). Also the bluewater WF of the WF prod for agricultural products (36 km 3 or 202 lcd)as displayed in Fig. 9, corresponds to the sum of the blue waterconsumption for irrigation (30 km 3 ) and livestock (6 km 3 ) as presentedin Fig. 6. Additionally the blue WF of industrial products(7 km 3 ) and domestic water use (4 km 3 ) as displayed in Fig. 9, arealso presented in Fig. 6 by the blue water consumption of manufacturingindustries and of municipal water use. As such, thevalues for the green and blue WF of the WF prod of Fig. 9 havealready been presented in Fig. 6. Only the grey WF is added withinFig. 9.The WF cons of the average EU citizen adds up to 4815 lcd (Fig. 6).Compared to the domestic WF (113 lcd) this is a factor of about40–1. Compared to the average water withdrawal by households –on average 120 lcd in many western European countries (<strong>Vanham</strong>et al., 2011) – this is also a factor of about 40–1. In other words,the direct daily water use (drinking, cooking, washing, etc.) of theaverage EU citizen is just a small fraction of his indirect wateruse through the agricultural and industrial goods that he or sheconsumes.An analysis of the EU WF cons of specific agricultural productgroups is displayed in Fig. 10. Animal products represent more than50% (2290 lcd) of the total value. Within the EU28 a total of 41.2 Mtof meat (or 84.5 kg/cap) and 114.2 Mt of milk (234.1 kg/cap) are consumedevery year (Fig. 7). Extremely high WF values are related tothe consumption of milk (569 lcd), bovine meat (478 lcd) and pork(464 lcd).The product group cereals and beer represents the secondlargest WF (11%, 450 lcd). Within the EU28 a total of 60.3 Mt ofcereals (or 123.6 kg/cap, as food) and 36.4 Mt of beer (74.6 kg/cap)
D. <strong>Vanham</strong>, G. <strong>Bidoglio</strong> / Ecological Indicators 26 (2013) 61–75 67Fig. 5. Hydrological water balance components and water use values for the total area of the EU28 (EU27 and Croatia). Average annual values in km 3 ; period 1996–2005 foragricultural consumption values (Mekonnen and Hoekstra, 2010, 2011); long time average values for EU national hydrological components (EUROSTAT, 2012) and period1996–2005 for EU national water withdrawal and consumption values (EUROSTAT, 2012); P = precipitation; ET = evapotranspiration; RWR = renewable water resources;W = withdrawal; C = consumption; R = return flow.are consumed every year (Figs. 6 and 7). Wheat (also representingflour of wheat, bread, etc.) is here the dominant crop (339 lcd). Theconsumption of beer represents a WF of 32 lcd. Vegetables (EU28yearly consumption of 58.9 Mt or 120.8 kg/cap, Fig. 6), fruit (EU28yearly consumption of 48.2 Mt or 98.8 kg/cap, Fig. 6), nuts andwine represent the third largest group (9%, 364 lcd). Wine (EU28yearly consumption of 14.0 Mt or 28.8 kg/cap, Fig. 7) is responsiblefor a WF of 72 lcd. Other WF values include tomatoes (9 lcd), onions(5 lcd), apples (24 lcd), oranges and mandarines (33 lcd). Althoughconsumed in relative large amounts in the EU, the WF of most ofthe latter products is not very high as their VWC is not very high.The groups oilseeds and oils as well as coffee, tea, cocoa andtobacco both represent 8% of the total WF cons . Especially olive oil(127 lcd) and sunflower seed oil (74 lcd) have a high WF. The EU28yearly consumption of olive oil is 3.4 kg/cap and of sunflower seedoil 4.5 kg/cap (Fig. 7). For both products the VWC is extremely high.Within the other group, coffee and cocoa are two water intensiveproducts (they have high virtual water contents) and their WF are,respectively, 203 lcd and 107 lcd. Tea (EU28 yearly consumption of0.6 kg/cap, Fig. 7) is not as widely consumed as coffee (EU28 yearlyconsumption of 4.8 kg/cap) in the EU and has a lower VWC. Its WFis only 13 lcd. The group sugar and sweeteners accounts for 5% ofthe total WF and other crops for 6%. Of the latter, potatoes accountfor 52 lcd. Although consumed in large amounts (EU28 yearly consumptionof 39.9 Mt or 81.9 kg/cap), the WF of potatoes is not sohigh because its VWC is relatively low.3.3.2. Regional differences within the EU28The EU28 WF accounting values represent average EU values,but there are substantial differences between the different nationsof the EU. There are however similarities between different regionsof the EU.As shown in Fig. 11a, per capita total WF cons values are generallythe highest in the southern zone and the lowest in the northernzone. The ratio of the external WF cons to the total WF cons isin the upper range in the western zone while the lowest values
68 D. <strong>Vanham</strong>, G. <strong>Bidoglio</strong> / Ecological Indicators 26 (2013) 61–75Fig. 6. Agricultural production and consumption of product groups in the EU28 for the period 1996–2005 (in Mt/yr): (a) the production balance with PROD = production,nImp = net import (import–export) and VAR = stock variation resulting in PROD + nIMP + VAR = DOM (domestic supply quantity) and (b) the different fractions of DOM beingFEED = feed, PROC = processing, seed and other utilities; FOOD = food supply; * is FOOD expressed in kg/cap/yr.Data sources: FAOSTAT (2012).Fig. 7. Agricultural production and consumption of specific agricultural products in the EU28 for the period 1996–2005: (a) the production (PROD) and food supply (FOOD)in Mt/yr as well as FOOD in kg/cap/yr (marked by *) and (b) the virtual water content VWC for production of these products, VWC glob and VWC EU28 = average global and EU28VWC (l/kg or m 3 /ton, includes green, blue and grey water).Data sources: FAOSTAT (2012) and Mekonnen and Hoekstra (2011) for the VWC.
D. <strong>Vanham</strong>, G. <strong>Bidoglio</strong> / Ecological Indicators 26 (2013) 61–75 69Fig. 8. Geographic WF accounting scheme for the EU28. The size of the grey boxes relates to the quantity of the components.Fig. 9. WF of (a) production (WF prod ) and (b) consumption (WF cons) for the EU28 (EU27 and Croatia) (in lcd and km 3 /yr), for agricultural products, industrial products anddomestic water.Figure resulting from national average annual WF values (1996–2005) data in Mekonnen and Hoekstra (2011).
70 D. <strong>Vanham</strong>, G. <strong>Bidoglio</strong> / Ecological Indicators 26 (2013) 61–75Fig. 10. WF cons of different product groups for the EU28 (in lcd).Based upon data from Mekonnen and Hoekstra (2011) for national average annual WF values of specific products (1996–2005).Fig. 11. Average annual WF cons values (period 1996–2005) for the countries of the EU28 for (a) green, blue and grey water; (b) green water; (c) blue water and (d) grey water.The X-axis shows the ratio of the external part of the total WF to the total WF (in %), the Y-axis shows the total WF in lcd. The size of each circle relates to the total annualWF of consumption of the country in absolute volume (km 3 ) (e.g. in the above figures min. 0.9 km 3 for MT and max. 132.5 km 3 for IT).Based upon data from Mekonnen and Hoekstra (2011).
D. <strong>Vanham</strong>, G. <strong>Bidoglio</strong> / Ecological Indicators 26 (2013) 61–75 71Fig. 12. Map on the net import (Mt/yr) of selected agricultural product groups/products for the four defined EU28 zones (period 1996–2005).Data source: FAOSTAT (2012).are observed in the eastern zone. The two main factors explainingthis divergence are the difference in virtual water content (VWC)of produced agricultural goods (generally lower in the northernand western EU zone as compared to the southern and easternzone) and the difference in amount and type of agricultural productsconsumed. Fig. 11b shows the same observations for greenwater. Fig. 11c shows that the blue WF is significantly higher in thecountries of the southern zone. Regarding grey WF (Fig. 11d) thereis no clear difference between the four EU zones.Figs. 12 and 6 show that cereals, meat and milk are net exportedproducts outside EU28, whereas oil crops and fruits are amongstproduct groups, which are net imported. However, there are alsoimportant intra-EU28 flows, resulting from the trade in agriculturaland industrial goods between Member States/regions. A shown inFig. 12, the western and northern EU zones are net exporters andthe southern zone a net importer for cereals, meat and milk. On theother hand, the western and northern zones are net importers andthe southern zone a net exporter for fruit and vegetables.4. Possible ways to reduce water footprintsIn the wake of climate change and global demographic changes,it is necessary to act on a reduction of the blue, green and greyWF of the EU28. The global objective to sustainably providea healthy diet (with eradicating hunger and obesity) to the9.3 billion people (UN, 2012) projected for 2050, can only beachieved by closing the yield gap on existing agricultural lands bymeans of sustainable intensification (Foley et al., 2011; Godfrayet al., 2010). To tackle the twin challenge of food security andenvironmental sustainability, the key element water needs to beregarded as a global resource and conventional approaches tointensify agriculture (which have contributed to environmentaldegradation in the past) must be adapted. The competition ofland and water for food, feed and bio-energy needs to be criticallyreviewed.One can argue, e.g. that it is not necessary to reduce blue WFin catchments where no water scarcity occurs. However, a moreefficient water use of a specific product in water-abundant areasresults in an increased production with the same amount of water,thereby (1) possibly reducing blue WF in water scarce-areas as less(virtual water) imports are required and (2) giving the possibility toallocate water for the production of other goods. The WF of waterintensiveproducts like meat can, e.g. not lead to water scarcity ina certain region, but in a global context they imply that less waterremains to be allocated to other purposes, such as growing cerealcrops to fulfil basic food demands (Hoekstra et al., 2011).There is also a need to reduce green WF, because of two reasons.The first is that green water is also a scarce resource, because itcompetes with other land uses like forests. Since part of the landin any river basin is occupied by other land uses, automatically acertain amount of green water is not available for agriculture. Thesecond reason is that increased production based on green waterresources (e.g. in northern Europe) reduces the need for productionwith blue water resources (e.g. in southern Europe). Thereforethe reduction of the green WF is also useful in areas wheregreen water is abundantly available. Also in the wake of climatechange this is an important factor. Increased summer droughts,e.g. in the Mediterranean region can lead to increased blue water
72 D. <strong>Vanham</strong>, G. <strong>Bidoglio</strong> / Ecological Indicators 26 (2013) 61–75Fig. 13. Possibilities to reduce the WF prod and WF cons per sector and WF component. Figure with input from Hoekstra et al. (2011); water productivity WP (ton/m 3 ) of aproduct is defined as the inverse of the virtual water content or VWC (m 3 /ton).consumption for irrigation, therefore stressing the necessity of thereduction of all WF components within the whole EU zone.Potential ways to reduce the WF components are displayed anddescribed in Fig. 13, and include:• a reduction in the domestic WF,• an increase in green and blue water productivity of agriculturalproducts at farm level including the closure of yield gaps withinthe EU or the increase of irrigation efficiencies. However, thereis a need for sustainable intensification, adopting lessons fromorganic systems and precision agriculture,• an increase in industrial processing water productivity,
D. <strong>Vanham</strong>, G. <strong>Bidoglio</strong> / Ecological Indicators 26 (2013) 61–75 73Fig. 14. Schematization of the different components to assess the indicator blue water scarcity.• a reduction of food waste along the entire food chain (EC, 2010).Recently the European Parliament called for urgent measures tohalve food wastage in the EU by 2025,• consumption adaptations by the citizens of the EU28 (<strong>Vanham</strong>et al., submitted for publication). Especially a reduced consumptionof animal products (especially meat) would have a largeimpact on the WF of the EU28, where more than 50% of cerealproduction is used as feed and additional feed imported.5. Critical aspects on the WF conceptThe WF concept is primarily intended to illustrate the hiddenlinks between human consumption and water use and betweenglobal trade and water resources management (Galli et al., 2012).With this respect it is a powerful communication tool. The WFconcept also has some limitations and challenges.Practical complexities with data (availability of and inconsistenciesin the underlying databases) are a first concern. Completing aWF assessment in practice can be difficult due to data availabilityand reliability. This is best shown in the WF accounting scheme ofthe EU28 (Fig. 8), where the different components are not absolutevalues. These differences are accounted to data quality. Thebottom-up approach for the WF prod , WF cons and VW flows dependson the quality of production, consumption and trade data, whereasthe top-down approach relies on the quality of production andtrade data (Hoekstra et al., 2011). The bottom-up approach for theWF cons is however generally recognized as more stable (Hoekstraet al., 2011; Van Oel et al., 2009). Where consumption over time israther constant, the trade balance, domestic production and overyearstorage vary more significantly. The outcome of the top-downapproach can be vulnerable to relatively small errors in the tradedata when the import and export of a country are large relativeto its domestic production. The bottom-up approach enables alsoto assess the WF cons in a detailed way per commodity or productcategory.This data concern is also valid for the blue WF of domesticand industrial use. Data on blue water withdrawals and especiallyconsumption (which is used for the WF) are – dependingon the purpose and/or geographical range – not always very reliable.The national WF values obtained from the WFN publicationsto synthesize the EU28 WF were estimated using water withdrawaldata from the AQUASTAT database and EUROSTAT (Hoekstra andMekonnen, 2012). The authors assumed that 5% of the water withdrawnfor industrial purposes is actual consumption (blue WF) andthat the remaining fraction is return flow; for the domestic watersupply sector, they assumed a consumptive portion of 10%.A critical issue is also that the grey WF methodology needsto be further standardized (Thaler et al., 2012). Some authorscriticize that representing the impacts of water pollution by transformingwater quality into water quantity gives loss to importantinformation. It does not consider factors such as ecotoxicity,biodegradability or water treatment (Hastings and Pegram, 2012).The quantification of the grey WF as presented in this paper isvery conservative (potentially an underestimated value), as it onlyaccounts for N but not, e.g. for P or pollution by pesticides. Dependenton the elements included, data and water quality standard used,the grey WF can therefore differ substantially (Thaler et al., 2012).Currently grey WF calculations heavily rely on assumptions andestimations (Galli et al., 2012). Further development and standardizationare necessary.Some authors argue that instead of “gross green water”, asdefined by the WFN and applied in most studies, “net green water”should be better used for the green WF (Hastings and Pegram,2012). This to account for the fact that also without cultivation,naturally occurring vegetation provides for ET (Postle et al., 2012).Net green thus refers to the difference between ET under croppedconditions and ET under natural conditions. This definition for the
74 D. <strong>Vanham</strong>, G. <strong>Bidoglio</strong> / Ecological Indicators 26 (2013) 61–75green WF however poses the problem that a negative net green WFis possible.One of the major concerns in WF assessment is the fact thatmany of the indicators for the sustainability assessment (Fig. 3)have yet to be further developed, tested and established (UNEP,2011). Only the indicator blue water scarcity is fully developed andtested, although the quantification of environmental flows needsfurther research. There is especially a need to further develop socialand economic indicators for the WF sustainability assessment.For developing strategies for sustainable water use, it is necessaryto use the more detailed layer of information embedded inthe composite (green, blue and grey) WF (sustainability) indicator.However, the total WF should not be discarded in this process.As an example, organic agriculture often leads to higher green WFas compared to industrialized agriculture (because yields are oftenlower), but the grey WF reduces to almost zero (and is substantialfor industrialized farming). Sustainability should therefore beevaluated also for the sum of both WF components.The most important limitation is the fact that it is still a partialtool (Hoekstra et al., 2011), as acknowledged by the WFN itself. Itdoes not account for water aspects like flooding or lack of waterinfrastructure, nor does it account for other (finite) resources likeland. The availability of agricultural land is a key factor for growingcrops, which is not accounted for in the WF or VW assessments.The WF also quantifies water consumption, but gives no informationon water withdrawals, although the difference between bothis very substantial (Fig. 5). The product group fish and seafood isnot assessed in WF analyses. A reduction of meat consumption buta shift to fish would indeed reduce the EU WF cons , but would put anextra burden on already stressed fish populations (<strong>Vanham</strong> et al.,submitted for publication). The WF assessment tool is thus a tool tobe used in combination with other analytical means or indicatorswhen making decisions.6. Implications for EU28 policiesThe WF and VW concepts provide the opportunity to link theuse of water resources to the consumption of goods. These conceptshave been brought into water management science in order to showthe importance of consumption patterns and global dimensions ingood water governance (Galli et al., 2012; Hoekstra, 2011; Hoekstraet al., 2011; UNEP, 2012). The strengths of the WF concept include(Galli et al., 2012):• Representation of the spatial distribution of a region’s (e.g. EU28)water demand/consumption.• Expansion of traditional water use accounting (water withdrawals)by the inclusion of green and grey water.• Visualization of the link between (local) consumption and(global) appropriation.Traditionally, nations or regions formulate water plans consideringoptions both to reduce water demand and increase supply,however without the inclusion of the global dimension of watermanagement. By focusing on domestic water use, most governmentsare unaware of the sustainability of national consumption(which includes both domestic and foreign products). The EU28has significantly externalized its WF cons (Fig. 2), without consideringwhether these imported products contribute to the depletionor pollution of water resources abroad. The <strong>Water</strong> FrameworkDirective aims at improving domestic water quality throughoutthe EU and the new Blueprint to Safeguard Europe’s <strong>Water</strong> willinclude water quantity issues. With so many global developments(climate change, global population increase, diet shifts, etc.) it isquestionable whether the current production and consumptionsituation of the EU28 can be sustained in future.The WF concept can contribute to sustainable solutions for EUpolicies like the <strong>Water</strong> Framework Directive (WFD) and the CAP(Common Agricultural Policy). It is nevertheless a partial tool, nottaking into account other resources like land, considerations aboutgreenhouse gas emissions or the consumption of fish. For integratedpolicy options, it requires the inclusion of other indicators, e.g.not to compete with policies like the Marine Strategy FrameworkDirective (MSFD).It was shown that the methodology requires further developmentand testing. In its current status the indicator blue waterscarcity can be implemented for case studies. Fig. 14 shows its relevancefor the EU28. A project recently started at the JRC of the ECwill conduct a blue WF sustainability assessment for the EU28 usingthis indicator. Consumption levels of regions in EU28 countries andthe impacts of measures to reduce the WF will be assessed.For a comprehensive WF assessment of the EU28 it has tobe stressed that there are substantial geographical differences inWF prod and WF cons (Figs. 11 and 12) within its borders. These shouldbe accounted for when formulating policies.7. ConclusionsThe water footprint (WF) and virtual water (VW) conceptsprovide the opportunity to link the use of water resources to theconsumption of goods. These concepts have been brought intowater management science in order to show the importance ofconsumption patterns and global dimensions in good water governance(Galli et al., 2012).A synthesis of existing national WF accounting amounts providedby the volumetric WF assessment approach of the <strong>Water</strong><strong>Footprint</strong> <strong>Network</strong> (WFN) results in the following WF quantificationfor the EU28:• The WF of production (WF prod ) amounts to 3420 lcd (609 km 3 /yr)and the WF of consumption (WF cons ) to 4815 lcd (857 km 3 /yr).Of the latter 60% is internal and 40% external. Included in thesevalues are the blue, green and grey WF components.• The EU28 is a net virtual water importer• The WF of agricultural products contributes by far the largest fractionof the total WF, i.e. 91% of the total WF prod and 89% of theWF cons . In other words, if consumers consider reducing their WF,they need to look at their diet rather than at their water use inthe kitchen, bathroom and garden. Especially animal products arevery water intensive. A comprehensive overview of possibilitiesto reduce the WF prod and WF cons is given in Fig. 13.• There are considerable differences in the WF cons between regionsof the EU (Fig. 11). The 2 main factors explaining these differencesare the difference in virtual water content (VWC) of producedagricultural goods (generally lower in the northern and westernEU zone as compared to the southern and eastern zone) and thedifference in amount and type of agricultural products consumed.A critical review on the WF assessment methodology shows thatto date, its development is still not completed, although the secondissue of the WF manual was published recently (Hoekstra et al.,2011). A concern is practical complexities with data, which wasdocumented in the EU28 WF accounting scheme (Fig. 8), wherethe components are not absolute values. Further development andstandardization of the grey WF is necessary. Many of the indicators(especially social and economic indicators) for the sustainabilityassessment (Fig. 3) have yet to be further developed, tested andestablished.
D. <strong>Vanham</strong>, G. <strong>Bidoglio</strong> / Ecological Indicators 26 (2013) 61–75 75It is also a partial tool, not accounting for other water relatedaspects like flooding or lack of water infrastructure. It also doesnot account for other resources like the availability of agriculturalland, nor does it include considerations about greenhouse gasemissions or the consumption of fish. To contribute to sustainablesolutions for EU policies like the <strong>Water</strong> Framework Directive (WFD)and the CAP (Common Agricultural Policy), it therefore requiresthe inclusion of additional indicators. The WF concept can supportawareness and policy development and contribute to positiveactions in watersheds.DisclaimerThe conclusions and statements presented are those of theauthors and may not in any circumstances be regarded as statingan official position of the European Commission.ReferencesAldaya, M.M., Garrido, A., Llamas, M.R., Varela, C., Novo, P., Rodriguez, R., 2008. Thewater footprint of Spain. J. Sustain. <strong>Water</strong> Manage. 3, 15–20.Bulsink, F., Hoekstra, A., Booij, M.J., 2010. The water footprint of Indonesian provincesrelated to the consumption of crop products. Hydrol. Earth Syst. Sci. 14, 119–128.EC, 2010. Preparatory study on food waste across EU 27, European Commission,Technical Report – 2010-054.EEA, 2009. <strong>Water</strong> Resources Across Europe—Confronting <strong>Water</strong> Scarcity andDrought. European Environment Agency, Copenhagen.EEA, 2010. The European Environment—State and Outlook 2010 (SOER2010)—<strong>Water</strong> Resources: Quantity and Flows. European EnvironmentAgency, Copenhagen.European Commission, 2010. <strong>Water</strong> is for Life: How the <strong>Water</strong> Framework DirectiveHelps Safeguard Europe’s Resources. Publications Office of the European Union,Luxembourg, ISBN: 978-92-79-13538-5.EUROSTAT, 2012. http://epp.eurostat.ec.europa.eu/portal/page/portal/eurostat/home/(accessed 16.04.12).Falkenmark, M., 2003. Freshwater as shared between society and ecosystems: fromdivided approaches to integrated challenges. Phil. Trans. R. Soc. B: Biol. Sci. 358,2037–2049.Falkenmark, M., Lannerstad, M., 2007. Consumptive water use to feedhumanity—curing a blind spot. Hydrol. Earth Syst. Sci. 9, 15–28.Statistical database FAO, 2012. http://faostat.fao.org/ (accessed 01.06.12).Foley, J.A., Ramankutty, N., Brauman, K.A., Cassidy, E.S., Gerber, J.S., Johnston, M.,Mueller, N.D., O’Connell, C., Ray, D.K., West, P.C., Balzer, C., Bennett, E.M., Carpenter,S.R., Hill, J., Monfreda, C., Polasky, S., Rockstrom, J., Sheehan, J., Siebert,S., Tilman, D., Zaks, D.P.M., 2011. Solutions for a cultivated planet. Nature 478,337–342, http://dx.doi.org/10.1038/nature10452.Galli, A., Wiedmann, T., Ercin, E., Knoblauch, D., Ewing, B., Giljum, S., 2012. Integratingecological, carbon and water footprint into a “footprint family” of indicators:definition and role in tracking human pressure on the planet. Ecol. Indic. 16,100–112, http://dx.doi.org/10.1016/j.ecolind.2011.06.017.Glavan, M., Pintar, M., Volk, M., 2012. Land use change in a 200-yearperiod and its effect on blue and green water flow in two SlovenianMediterranean catchments—lessons for the future. Hydrol. Process.,http://dx.doi.org/10.1002/hyp.9540.Gleeson, T., Wada, Y., Bierkens, M.F.P., van Beek, L.P.H., 2012. <strong>Water</strong> balanceof global aquifers revealed by groundwater footprint. Nature 488, 197–200,http://dx.doi.org/10.1038/nature11295.Godfray, H.C.J., Beddington, J.R., Crute, I.R., Haddad, L., Lawrence, D., Muir,J.F., Pretty, J., Robinson, S., Thomas, S.M., Toulmin, C., 2010. Food security:the challenge of feeding 9 billion people. Science 327, 812–818,http://dx.doi.org/10.1126/science.1185383.Hastings, E., Pegram, G., 2012. Literature Review for the Applicability of <strong>Water</strong> <strong>Footprint</strong>sin South Africa, WRC Report No. 2099/P/11, <strong>Water</strong> Research Commission,Gezina, South Africa.Hoekstra, A.Y., 2011. How sustainable is Europe’s water footprint? <strong>Water</strong> WastewaterInt. 26, 24–26.Hoekstra, A.Y., Chapagain, A.K., Aldaya, M.M., Mekonnen, M.M., 2011. The <strong>Water</strong><strong>Footprint</strong> Assessment Manual: Setting the Global Standard. Earthscan, London,UK.Hoekstra, A.Y., Mekonnen, M.M., 2012. The water footprint of humanity. Proceedingsof the National Academy of Sciences of the United States of America 109,3232–3237.Hoekstra, A.Y., Mekonnen, M.M., Chapagain, A.K., Mathews, R.E., Richter, B.D., 2012.Global monthly water scarcity: blue water footprints versus blue water availability.PLoS One 7, e32688, http://dx.doi.org/10.1371/journal.pone.0032688.Liu, J., Savenije, H.H.G., 2008. Food consumption patterns and their effect on waterrequirement in China. Hydrol. Earth Syst. Sci. 12, 887–898.Mekonnen, M.M., Hoekstra, A.Y., 2010. The Green, Blue and Grey <strong>Water</strong> <strong>Footprint</strong>of Crops and derived Crop Products, UNESCO-IHE Institute for <strong>Water</strong> Education,Delft, Value of <strong>Water</strong> Research Report Series No. 47.Mekonnen, M.M., Hoekstra, A.Y., 2011. National <strong>Water</strong> <strong>Footprint</strong> Accounts: TheGreen, Blue and Grey <strong>Water</strong> <strong>Footprint</strong> of Production and Consumption, UNESCO-IHE Institute for <strong>Water</strong> Education, Delft, Value of <strong>Water</strong> Research Report SeriesNo. 50.Postle, M., George, C., Upson, S., Hess, T., Morris, J., 2012. Assessment of the Efficiencyof the <strong>Water</strong> <strong>Footprint</strong>ing Approach and of the Agricultural Products and FoodstuffLabelling and Certification Schemes, Report for the European Commission,DG Environment.Rockström, J., Falkenmark, M., Karlberg, L., Hoff, H., Rost, S., Gerten, D., 2009. Futurewater availability for global food production: the potential of green waterfor increasing resilience to global change. <strong>Water</strong> Resour. Res. 45, W00A12,http://dx.doi.org/10.1029/2007WR006767.Sonnenberg, A., Chapagain, A., Geiger, M., August, D., 2009. The <strong>Water</strong> <strong>Footprint</strong> ofGermany—Where Does the <strong>Water</strong> Incorporated in our Food Come From? WWFGermany, Frankfurt am Main (in German).Thaler, S., Zessner, M., Bertran De Lis, F., Kreuzinger, N., Fehringer, R., 2012. Considerationson methodological challenges for water footprint calculations. <strong>Water</strong>Sci. Technol. 65, 1258–1264, http://dx.doi.org/10.2166/wst.2012.006.UN, 2012. Population Division of the Department of Economic andSocial Affairs, World Population Prospects: The 2010 Revision.http://esa.un.org/unpd/wpp/unpp/panel population.htm (accessed 17.04.12).UNEP, 2011. <strong>Water</strong> <strong>Footprint</strong> and Corporate <strong>Water</strong> Accounting for Resource Efficiency.United Nations Environment Programme, Paris.UNEP, 2012. Measuring <strong>Water</strong> Use in a Green Economy. A Report of the WorkingGroup on <strong>Water</strong> Efficiency to the International Resource Panel, McGlade,J., Werner, B., Young, M., Matlock, M., Jefferies, D., Sonnemann, G., Aldaya, M.,Pfister, S., Berger, M., Farell, C., Hyde, K., Wackernagel, M., Hoekstra, A., Mathews,R., Liu, J., Ercin, E., Weber, J.L., Alfieri, A., Martinez-Lagunes, R., Edens, B.,Schulte, P., von Wirén-Lehr, S., Gee, D.Van Oel, P., Mekonnen, M., Hoekstra, A., 2009. The external water footprint ofthe Netherlands: geographically-explicit quantification and impact assessment.Ecol. Econ. 69, 82–92.<strong>Vanham</strong>, D., Millinger, S., Pliessnig, H., Rauch, W., 2011. Rasterised water demands:methodology for their assessment and possible applications. <strong>Water</strong> Resour.Manage. 25, 3301–3320, http://dx.doi.org/10.1007/s11269-011-9857-3.<strong>Vanham</strong>, D. The water footprint of Austria for different diets, <strong>Water</strong> Sci. Technol., inpress, http://dx.doi.org/10.2166/wst.2012.623<strong>Vanham</strong>, D., 2012. A holistic water balance of Austria—how does the quantitativeproportion of urban water requirements relate to other users? <strong>Water</strong> Sci. Technol.66, 549–555, http://dx.doi.org/10.2166/wst.2012.201.<strong>Vanham</strong>, D., Mekonnen, M.M., Hoekstra, A.Y. The water footprint of the EU for differentdiets, Ecol. Indic., submitted for publication.Verma, S., Kampman, D.A., van der Zaag, P., Hoekstra, A.Y., 2009. Going against theflow: a critical analysis of inter-state virtual water trade in the context of India’sNational River Linking Program. Phys. Chem. Earth 34, 261–269.Willaarts, B.A., Volk, M., Aguilera, P.A., 2012. Assessing the ecosystem servicessupplied by freshwater flows in Mediterranean agroecosystems. Agric. <strong>Water</strong>Manage. 105, 21–31.