2004 Minnesota Student Survey - SPPS District ... - Data Center
2004 Minnesota Student Survey - SPPS District ... - Data Center
2004 Minnesota Student Survey - SPPS District ... - Data Center
- No tags were found...
Create successful ePaper yourself
Turn your PDF publications into a flip-book with our unique Google optimized e-Paper software.
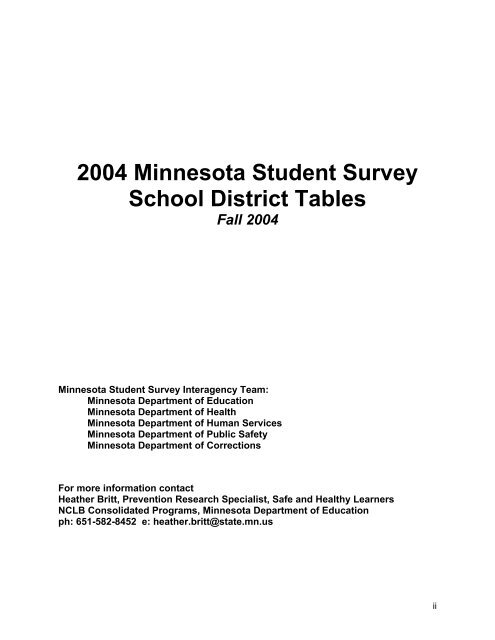
<strong>2004</strong> <strong>Minnesota</strong> <strong>Student</strong> <strong>Survey</strong>School <strong>District</strong> TablesFall <strong>2004</strong><strong>Minnesota</strong> <strong>Student</strong> <strong>Survey</strong> Interagency Team:<strong>Minnesota</strong> Department of Education<strong>Minnesota</strong> Department of Health<strong>Minnesota</strong> Department of Human Services<strong>Minnesota</strong> Department of Public Safety<strong>Minnesota</strong> Department of CorrectionsFor more information contactHeather Britt, Prevention Research Specialist, Safe and Healthy LearnersNCLB Consolidated Programs, <strong>Minnesota</strong> Department of Educationph: 651-582-8452 e: heather.britt@state.mn.usii
In AppreciationWe are indebted to the students, teachers, <strong>Minnesota</strong> <strong>Student</strong> <strong>Survey</strong> coordinators andsuperintendents across the state that agreed to participate in and willingly supported the studentsurvey when it was administered in the spring of <strong>2004</strong>. These data are made available as aresult of their interest and time and we are grateful for their efforts. A special note to studentsand parents—we hope these data can be used to help further prevention activities in yourschools and communities and thank you for supporting efforts to ensure healthy environmentsfor all youth. We are also indebted to the many state agency staff, especially the analysts withthe <strong>Center</strong> for Health Statistics at the <strong>Minnesota</strong> Department of Health, for their tireless work onmaking these data available.i
<strong>2004</strong> MINNESOTA STUDENT SURVEYTABLE OF CONTENTSTable Subject Area PageDEMOGRAPHICSTable 1 Sample description 1SCHOOLTable 2 Feelings about school, school plans, and truancy 2Table 3 Academic performance 3Table 4 Perceptions of school environment 4Table 5 Perceptions of school safety 5Table 6 Victimization at school 6USE OF TIMETable 7a-c Activities 7-9Table 8 Computer use at home 10FAMILY AND RELATIONSHIPSTable 9 Family composition and parental communication 11Table 10 Perception of family caring 12Table 11 Perceptions of others caring 13RISK FACTORSTable 12 Family substance abuse 14Table 13 Family/date violence 15Table 14 Sexual abuse 16HEALTH AND SAFETYTable 15 General health issues 17Table 16 Weight-related issues 18Table 17 Exercise 19Table 18 Nutrition 20Table 19 Seat belt use 21Table 20 Sources of information on risk behaviors 22MENTAL HEALTHTable 21 Self-esteem 23Table 22 Emotional well-being/distress 24Table 23 Suicidal thoughts and behavior 25Table 24 Gambling behavior 26Table 25 Gambling consequences 27Table 26 Destructive and antisocial behavior 28Continued on the next pageiii
<strong>2004</strong> MINNESOTA STUDENT SURVEYTABLE OF CONTENTS ContinuedTable Subject Area PageSUBSTANCE USETable 27 Summary of substance use 29Table 28 Cigarette use 30Table 29 Cigar and smokeless tobacco use 31Table 30 Access to tobacco 32Table 31 Alcohol use frequency and quantity 33Table 32 Access to alcohol 34Table 33 Drinking and driving 35Table 34 Marijuana, inhalants, and prescription drugs 36Table 35 Amphetamines, methamphetamine, cocaine, and ecstasy 37Table 36 Hallucinogens, opiates, and tranquilizers 38Table 37 Access to other drugs 39Table 38 Substance use patterns 40Table 39 Reasons for substance use 41Table 40 Reasons for substance non-use 42Table 41 a-b Consequences of substance use 43-44SEXUAL HEALTH AND PROTECTIVE FACTORSTable 42 a-b Sexual behavior 45-46Table 43 Reasons for sexual abstinence 47iv
<strong>2004</strong> <strong>Minnesota</strong> <strong>Student</strong> <strong>Survey</strong>TABLE 1SAMPLE DESCRIPTIONSt. PaulTotal number of surveysGenderAgeRace/ethnicityMaleFemale11 or younger1213141516171819-20No answerAmerican IndianBlack or AfricanAmericanHispanic or LatinoAsian American orPacific IslanderWhiteMixed race (checkedmore than onerace/ethnicity)I don't know / noanswerGrade6th9th12thN % N % N %2,129 100% 1,957 100% 934 100%1,042 49% 932 48% 432 46%1,087 51% 1,025 52% 502 54%469 22% 0 0% 0 0%1,543 72% 0 0% 0 0%98 5% 0 0% 0 0%5 0% 497 25% 0 0%0 0% 1,334 68% 0 0%0 0% 105 5% 4 0%0 0% 8 0% 241 26%0 0% 0 0% 617 66%0 0% 0 0% 69 7%14 1% 13 1% 3 0%52 2% 25 1% 1 0%425 20% 369 19% 137 15%180 8% 128 7% 57 6%612 29% 658 34% 342 37%495 23% 498 25% 315 34%256 12% 220 11% 60 6%109 5% 59 3% 22 2%Page 1
<strong>2004</strong> <strong>Minnesota</strong> <strong>Student</strong> <strong>Survey</strong>TABLE 2FEELINGS ABOUT SCHOOL, SCHOOL PLANS, AND TRUANCYSt. PaulHow do you feelabout going toschool?Which of thesebest describesyour school plans?During the last 30days, how oftenhave you skippedor cut full days ofschool?I like school verymuchI like school quite abitI like school a littleI don't like schoolvery muchI hate schoolI would like to quitschool as soon as IcanI plan to finish highschool but won't goto collegeI'd like to go tosome kind of tradeor vocational schoolI'd like to go tocollege after highschoolI'd like to go tocollege and then tograduate schoolNeverOnce or twice3 to 5 times6 to 10 timesMore than 10 times6thMale Female Male% % %Grade9thFemale%12thMale Female% %20% 27% 13% 16% 21% 21%34% 34% 33% 37% 30% 36%28% 25% 31% 31% 29% 27%11% 9% 13% 11% 13% 10%7% 5% 11% 6% 7% 6%3% 1% 2% 1% 1% 1%10% 6% 15% 9% 8% 7%1% 1% 5% 2% 10% 5%57% 54% 57% 53% 53% 45%30% 37% 21% 35% 28% 42%74% 71% 65% 65% 29% 31%17% 20% 22% 21% 38% 38%6% 7% 8% 9% 18% 20%2% 1% 2% 3% 8% 8%1% 1% 3% 3% 7% 4%Page 2
<strong>2004</strong> <strong>Minnesota</strong> <strong>Student</strong> <strong>Survey</strong>TABLE 3ACADEMIC PERFORMANCESt. PaulMark the twogrades you getthe most often.A onlyA and B onlyB onlyB and C onlyC onlyC and D onlyD onlyD and F onlyF onlyNot applicable or noanswer6thMale Female Male% % %Grade9thFemale%12thMale Female% %1% 1% 2% 2% 2% 3%22% 29% 29% 42% 37% 58%3% 4% 4% 3% 6% 4%15% 13% 25% 23% 30% 21%3% 2% 4% 3% 2% 3%4% 4% 13% 9% 13% 5%1% 1% 3% 1% 0% 0%2% 1% 6% 4% 2% 1%1% 0% 2% 1% 1% 0%49% 45% 13% 12% 6% 6%Page 3
<strong>2004</strong> <strong>Minnesota</strong> <strong>Student</strong> <strong>Survey</strong>TABLE 4PERCEPTIONS OF SCHOOL ENVIRONMENTSt. PaulHow many students inyour school arefriendly?How many students inyour school behavewell in the hallways andlunchroom?How many students inyour school have madefun of or threatenedstudents of differentraces or backgrounds?How many of yourteachers are interestedin you as a person?How many of yourteachers show respectfor students?AllMostSomeA fewNoneAllMostSomeA fewNoneAllMostSomeA fewNoneAllMostSomeA fewNoneAllMostSomeA fewNone6thMale%Female%Male%Grade9thFemale%12thMale Female% %7% 4% 2% 2% 4% 3%45% 44% 42% 42% 48% 44%36% 38% 42% 44% 36% 40%11% 13% 12% 11% 11% 13%1% 0% 2% 1% 2% 0%4% 2% 3% 2% 3% 2%30% 25% 25% 25% 29% 26%42% 43% 41% 47% 43% 43%22% 27% 27% 21% 23% 25%3% 2% 4% 4% 3% 3%3% 3% 5% 3% 2% 1%14% 13% 15% 13% 12% 13%19% 20% 29% 28% 30% 32%38% 39% 35% 41% 41% 40%27% 25% 16% 15% 15% 14%27% 28% 9% 8% 6% 9%31% 33% 28% 27% 32% 39%21% 19% 31% 29% 35% 31%14% 16% 20% 27% 21% 17%6% 4% 13% 9% 5% 4%46% 45% 22% 24% 19% 22%33% 34% 40% 42% 46% 50%11% 10% 22% 18% 24% 19%8% 8% 13% 13% 9% 9%2% 3% 4% 2% 2% 1%Page 4
<strong>2004</strong> <strong>Minnesota</strong> <strong>Student</strong> <strong>Survey</strong>TABLE 5PERCEPTIONS OF SCHOOL SAFETYSt. PaulHow much do you agree or disagreewith the following statements?I feel safe going toand from schoolI feel safe at schoolBathrooms in thisschool are a safeplace to beIllegal gang activityis a problem at thisschool<strong>Student</strong> use ofalcohol or drugs isa problem at thisschoolStrongly agreeAgreeDisagreeStrongly disagreeStrongly agreeAgreeDisagreeStrongly disagreeStrongly agreeAgreeDisagreeStrongly disagreeStrongly agreeAgreeDisagreeStrongly disagreeStrongly agreeAgreeDisagreeStrongly disagree6thMale%Female%Male%Grade9thFemale%12thMale Female% %42% 35% 32% 26% 39% 36%50% 54% 56% 63% 52% 57%6% 8% 7% 8% 6% 6%3% 2% 4% 2% 4% 2%38% 38% 25% 21% 34% 30%49% 49% 56% 65% 55% 58%9% 10% 14% 11% 9% 11%3% 2% 5% 3% 3% 1%22% 25% 12% 12% 18% 17%43% 48% 45% 54% 44% 49%24% 21% 30% 27% 29% 25%11% 7% 13% 7% 10% 8%12% 9% 16% 11% 8% 5%13% 14% 30% 28% 28% 26%27% 26% 42% 49% 47% 51%48% 50% 11% 12% 18% 18%11% 11% 22% 19% 19% 15%9% 10% 36% 35% 39% 39%20% 20% 30% 36% 32% 37%59% 60% 12% 10% 11% 9%Page 5
<strong>2004</strong> <strong>Minnesota</strong> <strong>Student</strong> <strong>Survey</strong>During the last12 months, hasanyone offered,sold, or givenyou an illegaldrug on schoolproperty?During the last12 months, howmany times hassomeone stolenor deliberatelydamaged yourproperty atschool?YesNo0 times1 time2 or 3 times4 or 5 times6 or more timesTABLE 6VICTIMIZATION AT SCHOOLSt. PaulMale%6thFemale%Grade9thMale Female% %12thMale Female% %4% 3% 30% 18% 28% 12%96% 97% 70% 82% 72% 88%53% 52% 58% 60% 63% 69%17% 18% 19% 22% 18% 21%17% 21% 16% 14% 15% 8%5% 4% 3% 2% 1% 2%7% 4% 5% 1% 3% 0%During the last30 days, howmany days didyou not go toschool becauseyou felt unsafeat school orgoing to/fromschool?0 days1 day2 or 3 days4 or 5 days6 or more days90% 90% 90% 91% 91% 92%5% 5% 4% 4% 3% 3%3% 3% 2% 3% 3% 3%1% 1% 1% 1% 1% 0%1% 1% 3% 1% 2% 1%During the last12 months,which of thefollowing hashappened toyou on schoolproperty? Hasa student:Insulted you?Threatenedyou?Pushed, shoved,or grabbed you?YesNoYesNoYesNo56% 56% 47% 37% 43% 30%44% 44% 53% 63% 57% 70%38% 32% 28% 18% 20% 10%62% 68% 72% 82% 80% 90%56% 50% 35% 33% 28% 23%44% 50% 65% 67% 72% 77%Kicked, bitten,or hit you?YesNo45% 36% 24% 17% 16% 5%55% 64% 76% 83% 84% 95%Stabbed you orfired a gun atyou?YesNo3% 1% 4% 1% 3% 0%97% 99% 96% 99% 97% 100%Page 6
<strong>2004</strong> <strong>Minnesota</strong> <strong>Student</strong> <strong>Survey</strong>TABLE 7AACTIVITIESSt. PaulDuring the school year, how manyhours in a typical week do youspend doing the following?Homework orstudyBand, choir,orchestra, musiclessons, orpracticing voiceor an instrumentActivities-Clubsor organizationsoutside of schoolActivities-Playingsports on aschool team0 hours1-2 hours3-5 hours6-10 hours11-20 hours21 hours or more0 hours1-2 hours3-5 hours6-10 hours11-20 hours21 hours or more0 hours1-2 hours3-5 hours6-10 hours11-20 hours21 hours or more0 hours1-2 hours3-5 hours6-10 hours11-20 hours21 hours or more6thMale Female Male% % %Grade9thFemale%12thMale Female% %6% 5% 15% 9% 14% 5%59% 53% 44% 41% 42% 34%19% 24% 22% 27% 26% 28%10% 11% 12% 13% 10% 18%4% 4% 5% 6% 6% 12%2% 3% 3% 4% 2% 4%64% 51% 72% 67% 67% 72%22% 31% 15% 18% 14% 10%8% 11% 7% 7% 7% 8%4% 4% 4% 5% 6% 6%1% 2% 1% 2% 3% 4%1% 2% 1% 1% 4% 0%62% 58% 57% 50% 48% 41%18% 22% 19% 21% 22% 25%12% 11% 13% 16% 15% 19%5% 5% 7% 6% 9% 8%2% 2% 2% 3% 4% 5%1% 1% 3% 3% 2% 3%70% 73% 57% 62% 57% 64%14% 14% 10% 9% 6% 6%7% 7% 10% 10% 9% 8%4% 3% 10% 10% 11% 9%3% 1% 8% 6% 11% 9%2% 1% 5% 2% 5% 3%Page 7
<strong>2004</strong> <strong>Minnesota</strong> <strong>Student</strong> <strong>Survey</strong>TABLE 7BACTIVITIESSt. PaulDuring the school year, how manyhours in a typical week do youspend doing the following?Activities-Otherphysical activitiesAttending services,groups, or programsat a church,synagogue, ormosqueActivities-Readingfor pleasureActivities-WatchingTV or videosActivities-Playingcomputer or videogames0 hours1-2 hours3-5 hours6-10 hours11-20 hours21 hours or more0 hours1-2 hours3-5 hours6-10 hours11-20 hours21 hours or more0 hours1-2 hours3-5 hours6-10 hours11-20 hours21 hours or more0 hours1-2 hours3-5 hours6-10 hours11-20 hours21 hours or more0 hours1-2 hours3-5 hours6-10 hours11-20 hours21 hours or moreGrade6th9th12thMale Female Male Female Male Female% % % % % %20% 22% 23% 29% 25% 33%34% 40% 26% 34% 25% 30%21% 22% 24% 21% 23% 25%12% 10% 13% 11% 15% 9%7% 4% 6% 4% 6% 2%6% 3% 7% 2% 6% 1%60% 55% 65% 57% 68% 59%25% 25% 18% 22% 18% 21%10% 14% 11% 13% 8% 10%3% 3% 4% 5% 4% 7%1% 2% 1% 2% 1% 1%1% 1% 1% 2% 2% 1%25% 14% 47% 28% 41% 21%50% 48% 34% 43% 36% 41%14% 19% 12% 16% 12% 19%6% 10% 4% 7% 6% 10%3% 4% 1% 3% 2% 4%3% 4% 2% 3% 2% 5%3% 5% 4% 5% 8% 9%32% 36% 23% 28% 21% 30%25% 26% 27% 28% 30% 28%18% 17% 22% 19% 18% 20%9% 8% 11% 9% 11% 8%12% 9% 12% 10% 12% 6%10% 28% 13% 31% 21% 48%34% 42% 29% 34% 28% 32%22% 15% 24% 19% 23% 10%15% 7% 16% 9% 12% 6%8% 4% 8% 3% 7% 2%11% 4% 10% 3% 9% 2%Page 8
<strong>2004</strong> <strong>Minnesota</strong> <strong>Student</strong> <strong>Survey</strong>TABLE 7CACTIVITIESSt. PaulDuring the school year, how manyhours in a typical week do youspend doing the following?Activities-Volunteerwork or communityserviceChores athome/babysittingfor familyWork for pay(includingbabysitting forothers)Activities-Hangingout0 hours1-2 hours3-5 hours6-10 hours11-20 hours21 hours or more0 hours1-2 hours3-5 hours6-10 hours11-20 hours21 hours or more0 hours1-2 hours3-5 hours6-10 hours11-20 hours21 hours or more0 hours1-2 hours3-5 hours6-10 hours11-20 hours21 hours or more6thMale Female Male% % %Grade9thFemale%12thMale Female% %71% 66% 71% 61% 59% 42%17% 20% 17% 21% 26% 31%6% 10% 6% 10% 10% 16%2% 2% 3% 4% 2% 5%1% 1% 2% 2% 1% 2%1% 1% 1% 2% 0% 2%23% 11% 23% 11% 32% 17%41% 36% 38% 32% 33% 33%18% 28% 20% 29% 21% 22%10% 13% 10% 13% 7% 11%5% 5% 4% 7% 1% 9%3% 6% 4% 8% 4% 9%54% 41% 56% 49% 38% 30%23% 24% 18% 19% 9% 10%12% 19% 13% 16% 11% 12%7% 9% 7% 9% 12% 14%2% 4% 4% 3% 14% 17%2% 3% 3% 3% 17% 17%15% 12% 12% 9% 7% 7%23% 25% 17% 16% 16% 17%22% 24% 18% 23% 20% 23%17% 17% 20% 21% 22% 28%11% 9% 14% 13% 16% 15%12% 12% 19% 17% 18% 10%Page 9
Do you use acomputer at home?YesNo<strong>2004</strong> <strong>Minnesota</strong> <strong>Student</strong> <strong>Survey</strong>TABLE 8COMPUTER USE AT HOMESt. PaulMale%6thFemale%Grade9thMale Female% %12thMale Female% %79% 80% 79% 80% 85% 81%21% 20% 21% 20% 15% 19%Do you use theInternet at home?What do you usethe Internet for athome? (Mark allthat apply)YesNoE-mailSurfing the webChat roomsListening to ordownloading musicPlaying gamesEntertainment orsportsHomework or otherresearchShopping6thMale%Female%Male%Grade9thFemale%12thMale Female% %70% 70% 70% 72% 79% 74%30% 30% 30% 28% 21% 26%32% 47% 45% 63% 64% 68%42% 42% 51% 52% 63% 56%21% 25% 28% 27% 27% 16%34% 37% 45% 47% 52% 36%59% 52% 51% 39% 46% 25%27% 12% 34% 18% 39% 17%46% 55% 46% 58% 58% 67%12% 13% 15% 19% 26% 26%Page 10
<strong>2004</strong> <strong>Minnesota</strong> <strong>Student</strong> <strong>Survey</strong>TABLE 9FAMILY COMPOSITION AND PARENTAL COMMUNICATIONSt. PaulWhich adults doyou live with?Can you talk toyour fatherabout problemsyou are having?Can you talk toyour motherabout problemsyou are having?Both biologicalparentsBoth adoptiveparentsMother andstepfatherFather andstepmotherMother onlyFather onlySometimes withmother, sometimeswith fatherOtherNo adults or noanswerYes, most of thetimeYes, some of thetimeNo, not very oftenNo, not at allMy father is notaroundYes, most of thetimeYes, some of thetimeNo, not very oftenNo, not at allMy mother is notaround6thMale%Female%Male%Grade9thFemale%12thMale Female% %48% 43% 47% 46% 48% 49%0% 1% 0% 2% 1% 1%5% 8% 4% 5% 4% 4%1% 2% 2% 1% 1% 1%24% 29% 27% 31% 24% 24%3% 2% 4% 3% 5% 4%9% 10% 6% 4% 4% 3%7% 6% 8% 6% 9% 11%2% 1% 2% 2% 3% 3%33% 19% 28% 16% 33% 20%28% 29% 30% 26% 30% 27%18% 21% 15% 24% 14% 21%8% 13% 12% 18% 12% 16%13% 18% 14% 18% 11% 16%51% 50% 36% 40% 42% 45%26% 28% 32% 33% 31% 31%14% 12% 20% 16% 16% 16%6% 7% 9% 8% 7% 6%3% 2% 3% 3% 4% 3%* 6th grade survey did not ask this question.Page 11
<strong>2004</strong> <strong>Minnesota</strong> <strong>Student</strong> <strong>Survey</strong>TABLE 10PERCEPTIONS OF FAMILY CARINGSt. PaulHow much do you feel ...... your parentscare about you?... other adultrelatives careabout you?... your familycares about yourfeelings?... your familyunderstands you?... your family haslots of funtogether?... your familyrespects yourprivacy?Not at allA littleSomeQuite a bitVery muchNot at allA littleSomeQuite a bitVery muchNot at allA littleSomeQuite a bitVery muchNot at allA littleSomeQuite a bitVery muchNot at allA littleSomeQuite a bitVery muchNot at allA littleSomeQuite a bitVery much6thMale%Female%Male%Grade9thFemale%12thMale Female% %2% 2% 3% 2% 2% 3%2% 3% 6% 6% 5% 4%4% 3% 7% 7% 10% 8%8% 7% 14% 13% 19% 15%84% 85% 71% 73% 64% 70%3% 3% 5% 5% 4% 7%5% 4% 9% 10% 10% 8%9% 8% 15% 13% 20% 19%22% 20% 24% 25% 30% 24%60% 65% 46% 47% 35% 41%7% 6% 9% 9% 6% 6%8% 10% 12% 12% 12% 10%11% 13% 18% 20% 25% 19%23% 23% 27% 23% 23% 25%51% 49% 34% 36% 35% 39%8% 14% 17% 18% 13% 13%13% 15% 16% 22% 15% 17%15% 18% 23% 22% 27% 28%26% 23% 22% 19% 23% 22%39% 30% 23% 19% 23% 19%6% 9% 12% 12% 11% 10%12% 13% 18% 20% 17% 18%16% 17% 24% 22% 29% 24%23% 23% 23% 21% 23% 23%43% 38% 23% 25% 20% 26%9% 13% 13% 17% 10% 12%11% 12% 18% 19% 15% 16%14% 15% 20% 21% 23% 20%24% 22% 24% 17% 25% 22%43% 38% 26% 27% 26% 29%Page 12
<strong>2004</strong> <strong>Minnesota</strong> <strong>Student</strong> <strong>Survey</strong>TABLE 11PERCEPTIONS OF OTHERS CARINGSt. PaulHow much do you feel ...... friends careabout you?... teachers or otheradults at schoolcare about you? *... church orspiritual leaderscare about you? *... police officerscare about you?... other adults inyour communitycare about you?Not at allA littleSomeQuite a bitVery muchNot at allA littleSomeQuite a bitVery muchNot at allA littleSomeQuite a bitVery muchNot at allA littleSomeQuite a bitVery muchNot at allA littleSomeQuite a bitVery much6thMale%Female%Male%Grade9thFemale%12thMale Female% %4% 4% 5% 3% 3% 3%14% 12% 15% 12% 10% 9%25% 21% 24% 20% 25% 25%28% 24% 35% 30% 37% 30%28% 40% 21% 35% 25% 33%6% 7% 14% 11% 7% 6%16% 14% 23% 27% 21% 23%20% 22% 32% 32% 40% 33%26% 30% 21% 21% 22% 26%32% 27% 11% 9% 9% 12%28% 23% 36% 33% 35% 37%11% 14% 15% 15% 14% 15%16% 15% 15% 18% 21% 18%18% 17% 17% 17% 16% 15%28% 31% 18% 17% 14% 16%22% 18% 45% 40% 44% 41%17% 17% 19% 26% 27% 25%19% 16% 20% 18% 17% 23%17% 19% 9% 9% 8% 7%24% 30% 6% 7% 4% 4%16% 15% 25% 25% 26% 24%20% 18% 23% 25% 23% 25%21% 19% 27% 24% 27% 25%23% 24% 16% 16% 15% 18%20% 25% 8% 10% 8% 8%* Variations in wording for this item affect year-to-year comparisons.Page 13
Has alcohol use byany family memberrepeatedly causedfamily, health, job,or legal problems?YesNo<strong>2004</strong> <strong>Minnesota</strong> <strong>Student</strong> <strong>Survey</strong>TABLE 12FAMILY SUBSTANCE ABUSESt. PaulMale%6thFemale%Grade9thMale Female% %12thMale Female% %18% 22% 12% 15% 11% 13%82% 78% 88% 85% 89% 87%Whose use? (Markall that apply)Has drug use byany family memberrepeatedly causedfamily, health, job,or legal problems?Whose use? (Markall that apply)Family alcproblems-Parent wholives with meFamily alcproblems-Parent whodoesn't live with meFamily alcproblems-OtherrelativeYesNoFamily drugproblems-Parent wholives with meFamily drugproblems-Parent whodoesn't live with meFamily drugproblems-Otherrelative5% 8% 4% 5% 4% 4%5% 5% 4% 4% 3% 4%14% 14% 7% 8% 6% 8%15% 18% 9% 14% 8% 10%83% 80% 88% 85% 91% 89%5% 5% 2% 4% 2% 2%3% 4% 2% 3% 2% 1%11% 13% 7% 9% 5% 7%Page 14
<strong>2004</strong> <strong>Minnesota</strong> <strong>Student</strong> <strong>Survey</strong>TABLE 13FAMILY/DATE VIOLENCESt. PaulGrade6th9th12thMaleFemaleMaleFemaleMaleFemale%%%%%%Have you ever been thevictim of violence on adate? *YesNo7% 5% 6% 5%93% 95% 94% 95%Has any adult in yourhousehold ever hit you sohard that you had marksor were afraid of thatperson?Has anyone in your familyever hit anyone else in thefamily so hard that theyhad marks or were afraidof that person?YesNoYesNo17% 20% 10% 17% 10% 13%83% 80% 90% 83% 90% 87%19% 24% 13% 21% 13% 16%81% 76% 87% 79% 87% 84%* 6th grade survey did not ask this question.Page 15
<strong>2004</strong> <strong>Minnesota</strong> <strong>Student</strong> <strong>Survey</strong>TABLE 14SEXUAL ABUSESt. PaulGrade6th9th12thMaleFemaleMaleFemaleMaleFemale%%%%%%Have you ever been thevictim of date rape? *Yes3% 3% 3% 4%No97% 97% 97% 96%Has any older personoutside the familytouched you sexuallyagainst your wishes orforced you to touchthem sexually?Has any older/strongermember of your familytouched you sexually orhad you touch themsexually?YesNoYesNo4% 8% 5% 11% 4% 8%96% 92% 95% 89% 96% 92%2% 4% 2% 6% 2% 4%98% 96% 98% 94% 98% 96%* 6th grade survey did not ask this question.Page 16
<strong>2004</strong> <strong>Minnesota</strong> <strong>Student</strong> <strong>Survey</strong>TABLE 15GENERAL HEALTH ISSUESSt. PaulWhen was the lasttime you had aphysical exam?Have you ever beentreated for analcohol or other drugproblem? *Do you have amental or physicalhealth problem thathas lasted at least 12months?In the past 12months, how oftenhave you blackedout becausesomeone hit you inthe head?In the past 12months, how oftenhave you blackedout because you fellor were accidentallyhit in the head?Within the last 12months1-2 years ago3-4 years agoMore than 4 years agoI have never had aphysical examNoYesNoYesNeverOnceTwo times or moreNeverOnceTwo times or more6thMale Female Male% % %Grade9thFemale%12thMale Female% %53% 54% 46% 48% 39% 47%20% 23% 36% 37% 37% 34%6% 6% 9% 8% 15% 10%7% 5% 2% 2% 4% 5%14% 12% 7% 5% 5% 4%95% 96% 97% 98%5% 4% 3% 2%86% 86% 88% 89% 87% 90%14% 14% 12% 11% 13% 10%92% 94% 93% 96% 96% 97%6% 4% 4% 3% 3% 2%2% 2% 3% 1% 1% 1%79% 85% 88% 91% 93% 95%16% 12% 9% 7% 5% 4%5% 3% 3% 2% 2% 1%* 6th grade survey did not ask this question.Page 17
<strong>2004</strong> <strong>Minnesota</strong> <strong>Student</strong> <strong>Survey</strong>TABLE 16WEIGHT-RELATED ISSUESSt. PaulDuring the last12 months, haveyou ever eatenso much in ashort time thatyou felt out ofcontrol(binge-eating)? *At the presenttime, do youthink you are...YesNoUnderweightAbout the right weightOverweight6thMale%Female%Male%Grade9thFemale%12thMale Female% %16% 26% 17% 28%84% 74% 83% 72%14% 11% 11% 9% 14% 8%69% 66% 69% 59% 68% 61%17% 24% 19% 31% 18% 31%During the last12 months, haveyou done any ofthe following tolose or controlweight? (Markall that apply) *ExerciseFast or skipmealsSmokecigarettesYesNoYesNoYesNo74% 76% 66% 73%26% 24% 34% 27%16% 34% 17% 39%84% 66% 83% 61%4% 6% 6% 7%96% 94% 94% 93%Use diet pillsor speedYesNo1% 3% 3% 5%99% 97% 97% 95%Vomit onpurpose aftereatingYesNo1% 3% 2% 3%99% 97% 98% 97%Use laxativesYes1% 1% 1% 2%No99% 99% 99% 98%* 6th grade survey did not ask this question.Page 18
On how many ofthe last 7 daysdid you exerciseor play sportsthat made yousweat or breathehard for at least20 minutes?On how many ofthe last 7 dayswere youphysically activefor a combinedtotal of at least 30minutes?0 days1 day2 days3 days4 days5 days6 days7 days0 days1 day2 days3 days4 days5 days6 days7 days<strong>2004</strong> <strong>Minnesota</strong> <strong>Student</strong> <strong>Survey</strong>Male%TABLE 17EXERCISESt. Paul6thFemale%Grade9thMale Female% %Male%12thFemale%15% 17% 16% 18% 17% 26%10% 10% 6% 9% 9% 13%11% 14% 11% 13% 16% 21%10% 15% 10% 12% 11% 12%10% 12% 11% 10% 12% 10%11% 12% 15% 18% 13% 10%5% 4% 6% 6% 7% 4%27% 15% 23% 13% 14% 4%16% 17% 10% 15% 11% 21%10% 12% 6% 10% 9% 16%11% 14% 11% 12% 15% 20%10% 15% 10% 13% 9% 12%10% 11% 12% 9% 15% 9%11% 12% 17% 19% 17% 10%5% 4% 7% 6% 8% 6%27% 15% 27% 16% 17% 6%Page 19
<strong>2004</strong> <strong>Minnesota</strong> <strong>Student</strong> <strong>Survey</strong>TABLE 18NUTRITIONSt. PaulHow many glasses of each of thefollowing did you drink yesterday?Milk100% fruit juiceFruit juice drinksPop or sodaSports drinksWaterHow many servingsof fruits, fruit juices,or vegetables didyou eat yesterday?0 glasses1-2 glasses3-4 glasses5 or more glasses0 glasses1-2 glasses3-4 glasses5 or more glasses0 glasses1-2 glasses3-4 glasses5 or more glasses0 glasses1-2 glasses3-4 glasses5 or more glasses0 glasses1-2 glasses3-4 glasses5 or more glasses0 glasses1-2 glasses3-4 glasses5 or more glasses0 servings1 serving2 servings3 servings4 servings5 or more servingsGrade6th9th12thMale Female Male Female Male Female% % % % % %23% 30% 25% 42% 24% 40%50% 51% 49% 46% 54% 49%18% 14% 18% 9% 16% 9%9% 5% 8% 3% 5% 3%32% 38% 26% 33% 25% 33%43% 38% 48% 49% 53% 51%15% 14% 17% 14% 16% 11%10% 9% 9% 5% 6% 5%33% 37% 35% 37% 34% 49%42% 42% 41% 46% 49% 37%13% 13% 15% 13% 12% 12%11% 8% 8% 4% 5% 2%30% 37% 30% 41% 33% 43%43% 41% 37% 38% 44% 42%14% 12% 18% 14% 14% 8%13% 10% 14% 7% 9% 7%54% 70% 53% 75% 59% 83%24% 18% 25% 17% 26% 12%11% 6% 10% 5% 10% 3%11% 6% 12% 2% 6% 2%6% 6% 8% 9% 8% 9%19% 24% 24% 27% 29% 29%23% 25% 24% 27% 26% 27%52% 46% 44% 38% 37% 36%7% 7% 12% 8% 11% 9%16% 14% 13% 14% 14% 16%18% 19% 22% 24% 26% 24%21% 23% 22% 24% 24% 27%16% 17% 15% 19% 10% 13%20% 20% 16% 12% 14% 12%Page 20
<strong>2004</strong> <strong>Minnesota</strong> <strong>Student</strong> <strong>Survey</strong>TABLE 19SEAT BELT USESt. PaulHow often do you wear a seat beltwhen you ......ride in a car?...drive a car? *NeverSometimesOftenAlwaysI never do thisactivityNeverSometimesOftenAlways6thMale Female Male% % %Grade9thFemale%12thMale Female% %4% 3% 5% 4% 2% 3%23% 18% 29% 21% 22% 15%26% 26% 25% 25% 21% 19%47% 54% 41% 49% 54% 64%39% 51% 9% 10%6% 4% 2% 3%12% 6% 14% 4%9% 6% 10% 6%35% 34% 64% 76%* 6th grade survey did not ask this question.Page 21
<strong>2004</strong> <strong>Minnesota</strong> <strong>Student</strong> <strong>Survey</strong>TABLE 20SOURCES OF INFORMATION ON RISK BEHAVIORSSt. PaulWhere have youreceived most ofyour informationabout alcohol andother drugs? (Markall that apply)Where have youreceived most ofyour informationabout sex? (Markall that apply)Alc-drug info:Friends or peersAlc-drug info:ParentsAlc-drug info:Brothers or sistersAlc-drug info:School, teachers, orcounselorsAlc-drug info:Clinics, doctors, ornursesAlc-drug info:InternetAlc-drug info: TV,radio, magazines,newspapers, orbooksAlc-drug info: I donot know muchabout alcohol ordrugsSex info: Friends orpeersSex info: ParentsSex info: Brothersor sistersSex info: School,teachers, orcounselorsSex info: Clinics,doctors, or nursesSex info: InternetSex info: TV, radio,magazines,newspapers, orbooksSex info: I do notknow much aboutsex6thMale Female Male% % %Grade9thFemale%12thMale Female% %32% 39% 58% 69% 65% 68%56% 65% 48% 56% 40% 47%24% 31% 25% 35% 23% 30%59% 66% 53% 62% 50% 56%25% 28% 19% 32% 20% 31%10% 12% 15% 16% 20% 20%39% 38% 39% 41% 40% 46%12% 10% 8% 8% 8% 9%30% 33% 59% 63% 68% 69%43% 52% 37% 48% 29% 43%18% 22% 19% 25% 14% 20%49% 52% 50% 56% 48% 49%20% 24% 24% 41% 21% 44%12% 8% 22% 12% 29% 15%28% 24% 36% 33% 40% 42%12% 15% 5% 6% 4% 6%Page 22
<strong>2004</strong> <strong>Minnesota</strong> <strong>Student</strong> <strong>Survey</strong>TABLE 21SELF-ESTEEM *St. PaulI usually feel goodabout myself.I am able to dothings as well asmost other peoplemy age.On the whole, I'msatisfied withmyself.I feel I do not havemuch to be proudof.Sometimes I thinkthat I am no good.I feel that I can'tdo anything right.I feel that my lifeis not very useful.DisagreeMostly disagreeMostly agreeAgreeDisagreeMostly disagreeMostly agreeAgreeDisagreeMostly disagreeMostly agreeAgreeAgreeMostly agreeMostly disagreeDisagreeAgreeMostly agreeMostly disagreeDisagreeAgreeMostly agreeMostly disagreeDisagreeAgreeMostly agreeMostly disagreeDisagreeGrade6th9thMale%Female%Male%Female%Male%12thFemale%8% 9% 8% 10% 6% 6%5% 8% 6% 11% 7% 11%39% 39% 38% 37% 36% 48%48% 44% 48% 42% 51% 35%8% 9% 6% 7% 5% 5%5% 6% 5% 7% 4% 6%33% 34% 35% 38% 30% 38%55% 51% 54% 49% 61% 51%11% 12% 9% 12% 5% 5%4% 7% 7% 11% 10% 12%31% 32% 33% 33% 26% 37%53% 50% 51% 43% 59% 45%21% 19% 17% 16% 18% 13%10% 17% 15% 16% 12% 12%22% 20% 23% 22% 21% 26%47% 45% 46% 46% 49% 49%27% 28% 18% 24% 18% 16%13% 19% 13% 19% 13% 16%23% 19% 24% 21% 23% 29%37% 33% 45% 36% 46% 39%18% 19% 11% 15% 10% 9%11% 14% 12% 15% 9% 13%24% 23% 23% 25% 20% 22%47% 44% 53% 44% 62% 56%15% 17% 11% 14% 12% 10%9% 15% 11% 14% 9% 9%27% 20% 22% 22% 21% 22%49% 49% 57% 51% 58% 59%* Responses on this table have been ordered so that the highest risk response is always first and the lowest riskresponse is always last.Page 23
<strong>2004</strong> <strong>Minnesota</strong> <strong>Student</strong> <strong>Survey</strong>TABLE 22EMOTIONAL WELL-BEING/DISTRESSSt. PaulDuring the last 30 days ...... how has yourmood been?... have you felt youwere under anystress or pressure?... have you feltsad?... have you felt sodiscouraged orhopeless that youwondered ifanything wasworthwhile?... have you feltnervous, worried,or upset?... how satisfiedhave you been withyour personal life?Very badBadUp and down a lotVery goodExcellentYes, almost morethan I could takeYes, quite a bit ofpressureYes, more thanusualYes, a littleNot at allAll the timeMost of the timeSome of the timeLittle of the timeNone of the timeExtremely so, to thepoint that I havejust about given upQuite a bitSome, enough tobother meA little bitNot at allAll the timeMost of the timeSome of the timeLittle of the timeNone of the timeVery dissatisfiedSomewhatdissatisfiedSatisfiedVery satisfiedExtremely satisfiedGrade6th9th12thMale Female Male Female Male Female% % % % % %5% 5% 4% 4% 2% 2%4% 4% 3% 4% 3% 2%49% 59% 43% 61% 40% 59%29% 23% 35% 24% 39% 31%13% 9% 14% 6% 16% 7%11% 15% 10% 17% 13% 17%12% 15% 15% 23% 26% 31%11% 14% 15% 16% 14% 15%38% 38% 36% 33% 32% 30%28% 17% 24% 11% 14% 7%4% 8% 5% 9% 4% 5%9% 15% 8% 18% 10% 14%22% 28% 22% 32% 28% 36%40% 38% 38% 33% 39% 39%24% 12% 27% 8% 19% 6%6% 9% 6% 9% 7% 6%13% 13% 11% 15% 12% 11%12% 17% 13% 18% 15% 17%27% 29% 27% 27% 23% 31%42% 33% 44% 31% 43% 35%7% 9% 6% 8% 5% 4%11% 18% 9% 17% 9% 19%22% 29% 27% 34% 33% 31%39% 31% 35% 32% 36% 36%22% 13% 22% 10% 17% 10%6% 7% 6% 7% 5% 5%11% 18% 14% 26% 16% 22%41% 43% 38% 42% 38% 43%25% 19% 26% 19% 26% 22%17% 13% 16% 7% 16% 8%Page 24
<strong>2004</strong> <strong>Minnesota</strong> <strong>Student</strong> <strong>Survey</strong>TABLE 23SUICIDAL THOUGHTS AND BEHAVIORSt. PaulHave you everthought aboutkilling yourself?Have you ever triedto kill yourself?NoYes, during the lastyearYes, more than ayear agoNoYes, during the lastyearYes, more than ayear ago6thMale%Female%Male%Grade9thFemale%12thMale Female% %72% 63% 77% 61% 73% 66%16% 26% 12% 26% 17% 15%12% 11% 11% 13% 10% 19%89% 85% 92% 85% 92% 87%6% 9% 4% 10% 4% 3%5% 5% 4% 6% 3% 10%Page 25
<strong>2004</strong> <strong>Minnesota</strong> <strong>Student</strong> <strong>Survey</strong>TABLE 24GAMBLING BEHAVIOR *St. PaulDuring the last 12 months, how oftenhave you done these activities?Played cardsfor moneyBet on gamesof personalskill like pool,golf, or bowlingBet money onsports teamsBought lotterytickets orscratch-offsGambled in acasinoNot at allLess than once a monthAbout once a monthAbout once a weekDailyNot at allLess than once a monthAbout once a monthAbout once a weekDailyNot at allLess than once a monthAbout once a monthAbout once a weekDailyNot at allLess than once a monthAbout once a monthAbout once a weekDailyNot at allLess than once a monthAbout once a monthAbout once a weekDailyGrade9th12thMale Female Male Female%%%%59% 80% 57% 84%20% 13% 20% 10%9% 3% 10% 4%7% 2% 8% 1%6% 2% 4% 2%62% 84% 59% 88%15% 9% 21% 8%12% 2% 11% 3%6% 2% 5% 1%5% 2% 4% 0%63% 87% 67% 92%15% 8% 17% 5%10% 2% 8% 2%7% 1% 5% 1%5% 2% 3% 0%87% 91% 70% 79%5% 5% 14% 14%4% 2% 8% 4%2% 1% 6% 2%2% 1% 2% 1%94% 98% 72% 84%2% 1% 16% 14%1% 1% 7% 1%1% 0% 3% 1%2% 1% 3% 0%* 6th grade survey did not ask these questions.Page 26
<strong>2004</strong> <strong>Minnesota</strong> <strong>Student</strong> <strong>Survey</strong>TABLE 25GAMBLING CONSEQUENCES *St. PaulDuring the last 12 months, have you everfelt ...... bad about theamount you bet, orabout whathappens when youbet money?... that you wouldlike to stop bettingmoney but didn'tthink you could?YesNoI don't bet for moneyYesNoI don't bet for moneyGrade9thMale Female%%12thMale Female%%8% 3% 10% 5%50% 25% 51% 27%42% 71% 39% 67%7% 3% 7% 2%50% 25% 54% 31%43% 72% 39% 67%* 6th grade survey did not ask these questions.Page 27
<strong>2004</strong> <strong>Minnesota</strong> <strong>Student</strong> <strong>Survey</strong>TABLE 26DESTRUCTIVE AND ANTISOCIAL BEHAVIORSt. PaulDuring the last 12months, how oftenhave you run awayfrom home?During the last 12months, how oftenhave you damagedor destroyedproperty at schoolor somewhere else?During the last 12months, how oftenhave you hit or beatup another person?During the last 12months, how oftenhave you takensomething from astore without payingfor it?Do you get a realkick out of doingthings that are alittle dangerous?On how many of thelast 30 days did youcarry a gun onschool property?On how many of thelast 30 days did youcarry a weapon(other than a gun)on school property?NeverOnce or twice3 to 5 times6 to 10 timesMore than 10 timesNeverOnce or twice3 to 5 times6 to 10 timesMore than 10 timesNeverOnce or twice3 to 5 times6 to 10 timesMore than 10 timesNeverOnce or twice3 to 5 times6 to 10 timesMore than 10 timesNot at allA littleQuite a bitVery much0 days1 day2 or 3 days4 or 5 days6 or more days0 days1 day2 or 3 days4 or 5 days6 or more days6thMale%Female%Grade9thMale%Female%12thMale Female%%83% 87% 89% 84% 94% 90%13% 10% 7% 12% 2% 8%2% 1% 2% 3% 2% 1%0% 0% 0% 1% 1% 0%2% 1% 1% 1% 1% 1%64% 77% 65% 77% 80% 89%25% 17% 21% 16% 12% 9%6% 3% 7% 5% 4% 1%2% 1% 3% 1% 3% 0%4% 2% 5% 1% 2% 0%50% 64% 58% 64% 75% 84%34% 24% 27% 25% 17% 13%8% 6% 8% 6% 3% 2%3% 2% 2% 1% 1% 1%5% 3% 6% 4% 4% 1%80% 81% 70% 70% 78% 87%14% 12% 16% 16% 8% 8%2% 2% 6% 8% 5% 3%1% 2% 2% 2% 2% 1%3% 3% 6% 4% 7% 1%40% 47% 35% 46% 38% 52%36% 37% 38% 39% 39% 38%13% 9% 15% 9% 12% 6%12% 8% 12% 6% 12% 5%99% 99% 94% 99% 96% 99%0% 0% 1% 0% 1% 0%0% 0% 1% 0% 1% 0%0% 0% 1% 0% 1% 0%0% 0% 3% 0% 1% 0%92% 95% 86% 95% 91% 97%5% 3% 4% 2% 2% 1%1% 1% 3% 1% 2% 1%1% 0% 1% 0% 0% 0%1% 1% 6% 2% 5% 1%Page 28
Use of any tobaccoproducts during the pastyearDAILY use of anytobacco products duringthe past yearNoYesNoYes<strong>2004</strong> <strong>Minnesota</strong> <strong>Student</strong> <strong>Survey</strong>TABLE 27SUMMARY OF SUBSTANCE USE *St. PaulMale%6thFemale%Grade9thMale Female% %12thMale Female% %94% 92% 79% 78% 66% 77%6% 8% 21% 22% 34% 23%98% 99% 93% 93% 88% 90%2% 1% 7% 7% 12% 10%Frequent binge drinkingin the past year (typicallydrank 5 or more drinks ata time and drank on 10or more occasionsduring the past year)Any alcohol and/or otherdrug use during the pastyear (excluding tobacco)NoYesNo alcohol or other druguse in the past yearUsed only alcohol in thepast yearUsed only other drugs inthe past yearUsed both alcohol andother drugs in the pastyear99% 99% 95% 97% 85% 94%1% 1% 5% 3% 15% 6%80% 80% 56% 59% 48% 54%11% 13% 20% 19% 21% 28%3% 2% 5% 2% 2% 1%6% 5% 19% 20% 29% 17%* These are all computed variables based on combinations of responses to two or more survey items.Page 29
<strong>2004</strong> <strong>Minnesota</strong> <strong>Student</strong> <strong>Survey</strong>TABLE 28CIGARETTE USESt. PaulDuring the last 12months, how oftenhave you usedcigarettes? *During the last 30days, on how manydays did yousmoke a cigarette?During the last 30days, howfrequently have yousmoked cigarettes?If you have notsmoked a cigarettein the last year, doyou think you willduring the nextyear?Not at allLess than monthlyMonthlyWeeklyDaily0 days1 or 2 days3 to 5 days6 to 9 days10 to 19 days20 to 29 daysAll 30 daysNeverLess than onecigarette per dayOne to fivecigarettes per dayAbout one-half packper dayAbout one pack perdayAbout one andone-half packs perdayTwo packs or moreper dayDefinitely yesProbably yesProbably notDefinitely not6thMale Female Male% % %Grade9thFemale%12thMale Female% %95% 94% 85% 80% 76% 79%3% 4% 7% 9% 8% 6%0% 1% 1% 3% 4% 2%0% 0% 1% 3% 2% 4%1% 1% 6% 6% 10% 10%95% 95% 87% 83% 79% 82%3% 3% 4% 6% 6% 4%1% 1% 2% 2% 4% 1%0% 0% 1% 2% 4% 2%0% 0% 1% 1% 1% 3%0% 0% 1% 2% 2% 2%1% 1% 4% 3% 5% 6%96% 95% 89% 84% 81% 82%2% 3% 4% 8% 7% 7%1% 1% 3% 6% 8% 7%1% 0% 2% 1% 2% 3%0% 0% 1% 0% 1% 0%0% 0% 1% 0% 0% 0%1% 1% 1% 0% 1% 0%2% 2% 6% 6% 7% 5%5% 6% 9% 8% 9% 7%15% 14% 14% 16% 13% 12%79% 78% 72% 70% 71% 76%* Variations in wording for this item affect year-to-year comparisons.Page 30
<strong>2004</strong> <strong>Minnesota</strong> <strong>Student</strong> <strong>Survey</strong>TABLE 29CIGAR AND SMOKELESS TOBACCO USESt. PaulDuring the last 12months, how oftenhave you usedchewing tobaccoor snuff? *During the last 12months, how oftenhave you usedcigars, cigarillos,or little cigars?Not at allLess than monthlyMonthlyWeeklyDailyNot at allLess than monthlyMonthlyWeeklyDaily6thMale Female Male% % %Grade9thFemale%12thMale Female% %98% 98% 95% 99% 94% 100%1% 1% 2% 0% 3% 0%0% 0% 1% 0% 1% 0%0% 0% 1% 0% 1% 0%1% 1% 1% 0% 1% 0%97% 97% 87% 92% 79% 94%2% 1% 6% 4% 10% 4%1% 0% 2% 2% 5% 0%0% 1% 2% 1% 4% 1%1% 1% 2% 1% 3% 1%* Variations in wording for this item affect year-to-year comparisons.Page 31
<strong>2004</strong> <strong>Minnesota</strong> <strong>Student</strong> <strong>Survey</strong>TABLE 30ACCESS TO TOBACCOSt. PaulINCLUDES ONLY THOSE WHO USEDTOBACCO IN THE LAST 30 DAYSIf you used tobacco,how did you get it inthe last 30 days?(Mark all that apply)Bought it at gas stationsor convenience storesBought it at bars orrestaurantsBought it at grocery,discount, or drug storesBought it at places likebowling alleys, videoarcades, or pool hallsBought it from vendingmachinesBought it on the Internet *Got it from friendsGot it from familymembersGot it by getting someoneelse to buy for meTook it from my homeTook it from a friend'shomeTook it from stores6thMale%Female%Grade9thMale%Female%12thMale Female%%7% 6% 26% 17% 47% 56%3% 3% 4% 2% 5% 6%3% 5% 10% 3% 18% 21%10% 3% 5% 2% 7% 3%12% 2% 5% 1% 2% 2%4% 1% 1% 1%29% 45% 44% 51% 36% 41%14% 17% 16% 19% 14% 16%14% 11% 28% 32% 10% 12%15% 28% 10% 21% 5% 10%8% 23% 11% 10% 6% 6%14% 11% 21% 7% 10% 6%INCLUDES ONLY THOSE WHO BOUGHTTOBACCO IN THE LAST 30 DAYSIf you bought tobaccoin the last 30 days, didyou use a fake ID?YesNo6thMale%Female%Grade9thMale%Female%12thMale Female%%6% 5% 16% 9% 7% 10%94% 95% 84% 91% 93% 90%* 6th grade survey did not provide this response option.Page 32
<strong>2004</strong> <strong>Minnesota</strong> <strong>Student</strong> <strong>Survey</strong>TABLE 31ALCOHOL USE FREQUENCY AND QUANTITYSt. PaulOn how manyoccasions (if any)have you hadalcoholic beveragesto drink during thelast 12 months?On how manyoccasions (if any)have you hadalcoholic beveragesto drink during thelast 30 days?If you drinkbeer/wine/winecoolers/hard liquor,generally, howmuch (if any) do youdrink at one time?Over the last 2weeks, how manytimes (if any) haveyou had five or moredrinks in a row? *01-23-56-910-1920-3940+01-23-56-910-1920-3940+I don't drinkbeer/wine/winecoolers/hard liquor1 glass, can, or drink2 glasses, cans, ordrinks3 glasses, cans, ordrinks4 glasses, cans, ordrinks5 glasses, cans, ordrinks6 or more glasses,cans, or drinksNeverOnceTwice3 - 5 times6 - 9 times10 or more timesGrade6th9thMale%Female%Male%Female%Male%12thFemale%85% 84% 62% 60% 51% 55%8% 11% 14% 16% 7% 11%4% 3% 8% 9% 10% 10%2% 1% 5% 6% 10% 8%1% 0% 5% 6% 9% 8%0% 0% 3% 3% 6% 3%1% 1% 3% 1% 8% 5%93% 92% 74% 75% 61% 69%5% 6% 13% 14% 17% 17%1% 1% 6% 6% 13% 8%0% 0% 3% 3% 5% 3%0% 0% 2% 1% 3% 2%0% 0% 1% 1% 0% 0%0% 0% 1% 0% 2% 0%87% 87% 62% 62% 52% 57%9% 10% 14% 15% 7% 9%1% 2% 6% 8% 7% 9%1% 1% 6% 6% 7% 10%1% 0% 3% 3% 6% 6%0% 0% 3% 3% 7% 4%1% 1% 5% 4% 14% 6%83% 85% 74% 86%6% 8% 12% 5%5% 3% 6% 5%4% 4% 6% 3%1% 0% 1% 0%2% 1% 1% 0%* 6th grade survey did not ask this question.Page 33
<strong>2004</strong> <strong>Minnesota</strong> <strong>Student</strong> <strong>Survey</strong>TABLE 32ACCESS TO ALCOHOLSt. PaulINCLUDES ONLY THOSE WHO USEDALCOHOL IN THE LAST 30 DAYS *If you used alcohol,how did you get itin the last 30 days?(Mark all that apply)Bought it at bars orrestaurantsBought it at storesBought it on theInternet **Got it from friendsGot it from familymembersGot it by gettingsomeone else to buyfor meGot it at partiesTook it from myhomeTook it from afriend's homeTook it from stores6thMale%Female%Male%Grade9thFemale%12thMale Female% %5% 3% 7% 0% 5% 5%8% 1% 17% 9% 14% 10%4% 1% 3% 0%25% 33% 47% 59% 66% 71%43% 32% 31% 25% 21% 20%11% 5% 17% 23% 33% 31%29% 23% 34% 43% 45% 53%22% 29% 20% 23% 7% 13%8% 11% 11% 15% 9% 8%11% 4% 12% 4% 9% 3%INCLUDES ONLY THOSE WHO BOUGHTALCOHOL IN THE LAST 30 DAYSIf you boughtalcohol in the last30 days, did youuse a fake ID?YesNo6thMale%Female%Male%Grade9thFemale%12thMale Female% %7% 2% 13% 8% 9% 6%93% 98% 87% 92% 91% 94%* In 1998, percentages were based on only recent alcohol users who cited a source. This year, as in 2001,percentages are based on all recent alcohol users, even if they skipped this question. Therefore, thesepercentages are comparable only to the 2001 survey results.** 6th grade survey did not provide this response option.Page 34
<strong>2004</strong> <strong>Minnesota</strong> <strong>Student</strong> <strong>Survey</strong>TABLE 33DRINKING AND DRIVING *St. PaulDuring the last 12months, how manytimes have you driven amotor vehicle afterusing alcohol or drugs?Do you ever ride withfriends after they havebeen using alcohol ordrugs?0 times or no useOnceTwice3 or more timesNoYes, but rarelyYes, oftenNone of my friends usealcohol or other drugs9thMale%GradeFemale Male%%12thFemale%94% 97% 78% 92%2% 1% 4% 4%1% 1% 5% 2%2% 1% 13% 3%66% 69% 60% 67%18% 18% 25% 23%7% 5% 12% 5%9% 8% 3% 5%* 6th grade survey did not ask these questions.Page 35
<strong>2004</strong> <strong>Minnesota</strong> <strong>Student</strong> <strong>Survey</strong>TABLE 34MARIJUANA, INHALANTS, AND PRESCRIPTION DRUGSSt. PaulOn how many occasions (if any)have you ...... used marijuana(grass, pot) orhashish (hash, hashoil) during the last12 months?... used marijuana(grass, pot) orhashish (hash, hashoil) during the last30 days?... sniffed glue orinhaled any othergases or sprays inorder to get highduring the last 12months? *... taken otherpeople'sprescription drugsduring the last 12months? *01-23-56-910-1920-3940+01-23-56-910-1920-3940+01-23-56-910-1920-3940+01-23-56-910-1920-3940+Grade6th9th12thMale Female Male Female Male Female% % % % % %96% 97% 81% 81% 73% 84%2% 2% 4% 7% 4% 4%1% 1% 4% 3% 2% 3%0% 1% 2% 3% 4% 2%0% 0% 2% 2% 2% 2%0% 0% 2% 1% 3% 1%1% 1% 6% 2% 11% 3%97% 98% 85% 87% 80% 90%2% 1% 5% 6% 4% 5%0% 1% 3% 3% 3% 1%0% 0% 2% 2% 1% 1%0% 0% 2% 1% 3% 2%0% 0% 2% 0% 5% 0%0% 0% 2% 1% 4% 0%96% 96% 95% 96% 96% 99%2% 3% 2% 2% 2% 1%0% 1% 0% 1% 1% 0%0% 0% 1% 0% 0% 0%0% 0% 0% 1% 0% 0%0% 0% 0% 0% 0% 0%1% 0% 0% 0% 0% 0%97% 97% 96% 93% 94% 96%2% 2% 2% 4% 4% 2%0% 0% 1% 2% 2% 0%0% 0% 0% 1% 0% 0%0% 0% 0% 1% 0% 0%0% 0% 0% 0% 0% 1%1% 0% 0% 0% 0% 0%* Questions regarding use of these substances in the past 30 days were dropped due to low prevalence rates.Page 36
<strong>2004</strong> <strong>Minnesota</strong> <strong>Student</strong> <strong>Survey</strong>TABLE 35AMPHETAMINES, METHAMPHETAMINE, COCAINE, AND ECSTASY *St. PaulDuring the last 12 months, on how manyoccasions (if any) have you ...... taken amphetamines onyour own without a doctortelling you to take them?... used methamphetamine(meth, speed, crank,crystal meth) by anymethod?... used "crack" (cocaine inchunk or rock form), orcocaine in any other form?... used MDMA("ecstasy")?01-23-56-910-1920-3940+01-23-56-910-1920-3940+01-23-56-910-1920-3940+01-23-56-910-1920-3940+Grade9th12thMale Female Male Female%%%%96% 95% 96% 97%1% 3% 2% 1%0% 1% 2% 0%1% 1% 0% 0%0% 1% 0% 1%0% 0% 0% 1%0% 0% 0% 0%95% 95% 94% 98%2% 2% 4% 0%1% 0% 0% 0%1% 1% 1% 0%0% 1% 0% 0%0% 0% 0% 0%0% 0% 1% 0%97% 96% 96% 99%1% 2% 2% 1%1% 1% 1% 0%0% 1% 1% 1%0% 0% 1% 0%0% 0% 0% 0%0% 0% 0% 0%95% 96% 94% 99%2% 1% 2% 0%1% 1% 2% 0%1% 1% 1% 0%0% 0% 0% 0%0% 0% 0% 0%0% 0% 0% 0%* 6th grade survey did not ask these questions. Questions regarding use of these substances in the past 30 days weredropped due to low prevalence rates.Page 37
<strong>2004</strong> <strong>Minnesota</strong> <strong>Student</strong> <strong>Survey</strong>TABLE 36HALLUCINOGENS, OPIATES, AND TRANQUILIZERS *St. PaulDuring the last 12 months, on howmany occasions (if any) have you ...... used LSD("acid"), PCP, orotherpsychedelics?... used heroinor any othernarcotics oropiates?... takenbarbiturates ortranquilizerswithout a doctortelling you totake them?01-23-56-910-1920-3940+01-23-56-910-1920-3940+01-23-56-910-1920-3940+Grade9th12thMaleFemaleMaleFemale%%%%96% 98% 96% 98%2% 1% 2% 1%0% 0% 2% 0%1% 0% 1% 0%0% 0% 0% 0%0% 0% 0% 0%0% 0% 0% 0%97% 98% 96% 99%1% 1% 2% 1%1% 1% 0% 0%1% 0% 0% 0%1% 0% 0% 0%0% 0% 1% 0%1% 0% 0% 0%97% 97% 95% 99%1% 2% 2% 1%1% 0% 2% 0%1% 0% 0% 0%0% 0% 0% 0%0% 0% 0% 0%0% 0% 0% 0%* 6th grade survey did not ask these questions. Questions regarding use of these substances in the past 30 dayswere dropped due to low prevalence rates.Page 38
<strong>2004</strong> <strong>Minnesota</strong> <strong>Student</strong> <strong>Survey</strong>TABLE 37ACCESS TO OTHER DRUGS *St. PaulINCLUDES ONLY PAST-YEAR DRUG USERS WHOREPORTED OBTAINING DRUGS IN THE LAST30 DAYS **If you useddrugs otherthan alcohol,how did youget them inthe last 30days? (Markall that apply)Bought them from people I knowBought them from people I don't knowBought them on the InternetGot them from friendsGot them from family membersGot them by getting someone else tobuy for meGot them at partiesTook them from my homeTook them from a friend's home9thMale%Grade12thFemale Male Female%%%61% 58% 71% 38%17% 13% 19% 2%5% 1% 6% 2%68% 80% 68% 86%23% 15% 14% 16%17% 19% 17% 8%24% 47% 31% 32%8% 9% 8% 2%25% 22% 13% 4%* 6th grade survey did not ask this question.** In 1998, percentages were based on recent drug users. This year, as in 2001, because recent use questionswere dropped for most substances, the percentages are based on past-year drug users who cited a source, i.e.those who answered this question. Due to this difference, results are comparable only to 2001 results.Page 39
<strong>2004</strong> <strong>Minnesota</strong> <strong>Student</strong> <strong>Survey</strong>TABLE 38SUBSTANCE USE PATTERNSSt. PaulDo you ever use alcohol orother drugs ......beforeschool?YesNo6thMale%Female%Grade9thMale%Female%12thMale Female% %2% 2% 11% 8% 15% 7%98% 98% 89% 92% 85% 93%...duringschool?...right afterschool?YesNoYesNo1% 1% 7% 5% 10% 4%99% 99% 93% 95% 90% 96%4% 5% 15% 13% 20% 10%96% 95% 85% 87% 80% 90%Page 40
<strong>2004</strong> <strong>Minnesota</strong> <strong>Student</strong> <strong>Survey</strong>TABLE 39REASONS FOR SUBSTANCE USE *St. PaulALCOHOL AND/OR DRUG USERS ONLY **If you usealcohol ordrugs,which arereasons youuse? (Markall thatapply)Reasons to use: To relaxReasons to use: To get high or smashedReasons to use: To have fun at partiesTo escape from school, family orpersonal problemsBecause my parents aren't aroundBecause my friends doBecause my parents doBecause I like the tasteBecause I'm sad, lonely, or angryBecause it's illegalBecause of peer pressure9thMale%GradeFemale%12thMale Female%%51% 48% 62% 48%43% 35% 45% 39%47% 54% 66% 72%24% 44% 28% 29%7% 11% 16% 10%11% 18% 30% 20%4% 4% 4% 3%22% 25% 28% 32%17% 34% 13% 18%6% 5% 8% 7%12% 20% 13% 10%* 6th grade survey did not ask this question.** In 2001, the percentages for this table were inadvertently based on ALL students, not only alcohol and/ordrug users as the table was labeled.Page 41
If you do not usealcohol or otherdrugs, whatfactors influenceyour choice notto use? (Mark allthat apply) **<strong>2004</strong> <strong>Minnesota</strong> <strong>Student</strong> <strong>Survey</strong>TABLE 40REASONS FOR SUBSTANCE NON-USE *St. PaulReasons not using alc: My friends don't useReasons not using alc: One or both of myparents would objectReasons not using alc: I have no desire to useReasons not using alc: Use is against myprinciples or religious beliefsReasons not using alc: Alcohol and drugs aredangerousReasons not using alc: Alcohol and drugeducation at schoolReasons not using alc: Use could affect myperformance in school, sports, or other activitiesGrade6thMale Female%%62% 64%51% 59%73% 74%17% 19%65% 75%30% 35%66% 68%* 9th-12th grade survey did not ask this question.** In 2001, the percentages for this table were inadvertently based on ALL students, not only those who actuallyanswered the question.Page 42
<strong>2004</strong> <strong>Minnesota</strong> <strong>Student</strong> <strong>Survey</strong>TABLE 41ACONSEQUENCES OF SUBSTANCE USE *St. PaulDuring the last 12 months ......have you found that youhad to use a lot more alcoholor other drugs than before toget the same effect?...have you tried to cut downon your alcohol or other druguse but couldn't?...has alcohol or other druguse hurt your relationshipswith friends or family?...how many times have youspent all or most of the dayusing alcohol or other drugs,or getting over their effects?...how many times have yougiven up activities in order touse alcohol or other drugs orget over their effects?...how many times hasalcohol or other drug use leftyou feeling depressed,agitated, paranoid, or unableto concentrate?No or no useYesNo or no useYesNo or no useYes0 times or no useOnceTwice3 or more times0 times or no useOnceTwice3 or more times0 times or no useOnceTwice3 or more timesGrade9th12thMale Female Male Female% % % %93% 93% 86% 93%7% 7% 14% 7%89% 90% 90% 92%11% 10% 10% 8%93% 92% 92% 91%7% 8% 8% 9%84% 85% 79% 87%9% 7% 7% 7%3% 4% 4% 2%5% 4% 10% 4%95% 94% 91% 93%1% 3% 4% 4%2% 2% 2% 1%2% 1% 4% 3%93% 89% 84% 90%3% 6% 7% 4%1% 2% 2% 3%3% 3% 7% 3%* 6th grade survey did not ask these questions.Page 43
<strong>2004</strong> <strong>Minnesota</strong> <strong>Student</strong> <strong>Survey</strong>TABLE 41BCONSEQUENCES OF SUBSTANCE USE *St. PaulDuring the last 12 months ......how many times haveyou neglected yourresponsibilities because ofalcohol or other drug use?...how many times haveyou missed work or schoolbecause of alcohol orother drug use?...how many times hasalcohol or other drug usecaused you problems withthe law?...how many times haveyou hit someone orbecome violent whileusing alcohol or otherdrugs?...how many times haveyou used so much alcoholor other drugs that lateryou couldn't recall whatyou had said/done?...how many times haveyou used more alcohol orother drugs than youintended to?0 times or no useOnceTwice3 or more times0 times or no useOnceTwice3 or more times0 times or no useOnceTwice3 or more times0 times or no useOnceTwice3 or more times0 times or no useOnceTwice3 or more times0 times or no useOnceTwice3 or more times9thMale%GradeFemale Male% %12thFemale%94% 92% 90% 92%3% 4% 3% 3%1% 3% 3% 3%2% 2% 4% 3%94% 94% 88% 94%2% 3% 5% 3%1% 1% 1% 1%3% 2% 5% 3%94% 96% 91% 96%2% 2% 3% 3%2% 1% 3% 1%1% 1% 3% 0%92% 93% 94% 96%3% 3% 4% 2%2% 2% 1% 2%3% 1% 2% 1%89% 86% 81% 86%5% 7% 9% 7%2% 3% 4% 4%4% 4% 5% 3%89% 88% 80% 86%6% 6% 9% 8%2% 2% 4% 3%3% 3% 8% 4%* 6th grade survey did not ask these questions.Page 44
<strong>2004</strong> <strong>Minnesota</strong> <strong>Student</strong> <strong>Survey</strong>TABLE 42ASEXUAL BEHAVIOR *St. PaulHave you ever hadsexual intercourse("gone all the way")?During the last 12months, with howmany different malepartners have you hadsexual intercourse?During the last 12months, with howmany different femalepartners have you hadsexual intercourse?How many times haveyou been pregnant orgotten someonepregnant?NoYes, once or twiceYes, 3 times or moreNone1 person2 persons3 persons4 persons5 persons6 or more personsNone1 person2 persons3 persons4 persons5 persons6 or more persons0 times1 time2 or more timesNot sure9thMale%GradeFemale Male%%12thFemale%71% 76% 58% 57%13% 9% 12% 8%17% 15% 29% 36%96% 77% 94% 59%0% 12% 2% 29%0% 5% 1% 6%1% 2% 1% 3%1% 1% 0% 1%0% 1% 0% 1%1% 1% 2% 2%73% 97% 60% 98%6% 1% 23% 1%6% 1% 7% 0%5% 0% 3% 0%4% 0% 2% 0%1% 0% 1% 0%7% 1% 5% 0%95% 94% 96% 92%1% 4% 1% 7%2% 1% 2% 1%2% 1% 2% 1%* 6th grade survey did not ask these questions.Page 45
<strong>2004</strong> <strong>Minnesota</strong> <strong>Student</strong> <strong>Survey</strong>TABLE 42BSEXUAL BEHAVIOR *St. PaulSEXUALLY ACTIVE STUDENTS ONLYHave you talked withyour partner(s) aboutprotecting yourselvesfrom gettingSTDs/HIV/AIDS? **Have you talked withpartner(s) aboutpreventing pregnancy? **NeverNot with every partnerAt least once with everypartnerNeverNot with every partnerGrade9thMale Female%%12thMale%Female%33% 26% 30% 17%20% 13% 14% 9%47% 61% 56% 74%34% 27% 27% 20%17% 13% 10% 8%If you have sexualintercourse, how oftendo you and/or yourpartner use any birthcontrol method?If you have sexualintercourse, how often isa condom used?The last time you hadsexual intercourse, didyou or your partner use acondom?At least once with everypartnerNeverRarelySometimesUsuallyAlwaysNeverRarelySometimesUsuallyAlwaysYesNo49% 60% 63% 72%30% 28% 20% 15%11% 6% 8% 7%12% 8% 12% 6%11% 12% 7% 10%37% 46% 53% 61%11% 9% 13% 19%5% 8% 12% 18%8% 14% 10% 13%12% 18% 19% 16%63% 51% 46% 34%74% 65% 62% 48%26% 35% 38% 52%* 6th grade survey did not ask these questions.** In 1998, the percentages for these questions included sexually inactive students who responded to the question.This year, as in 2001, the percentages include only sexually active students. Accordingly, the results for thesequestions are comparable only to 2001 survey results.Page 46
<strong>2004</strong> <strong>Minnesota</strong> <strong>Student</strong> <strong>Survey</strong>TABLE 43REASONS FOR SEXUAL ABSTINENCE *St. PaulIf you do not havesexual intercourse,what factorsinfluence yourchoice not to?(Mark all that apply)Reasons not havingsex: One or both ofmy parents wouldobjectReasons not havingsex: I don't want tohave sexReasons not havingsex: Most studentsin my school don'thave sexReasons not havingsex: My friends don'thave sexI don't think it's rightfor a person my ageto have sexI'm afraid of gettingcaughtMy religious orspiritual beliefsSex education atschool has shownme the advantagesof waiting until I'molderI don't want to get asexually transmitteddiseaseFear of pregnancy **My parents taughtme the advantagesof waiting until I'molderI have chosen towait until I'mmarried9thMale%GradeFemale%12thMale Female%%30% 44% 30% 35%26% 62% 27% 56%7% 6% 7% 3%15% 22% 7% 17%41% 63% 26% 39%18% 19% 14% 14%18% 22% 21% 29%29% 41% 24% 31%47% 65% 43% 55%32% 67% 40% 58%29% 47% 18% 38%40% 51% 36% 51%* 6th grade survey did not ask these questions.** Variations in wording for this item affect year-to-year comparisons.Page 47


