Final Report - Center for Invasive Plant Management
Final Report - Center for Invasive Plant Management
Final Report - Center for Invasive Plant Management
- No tags were found...

Create successful ePaper yourself
Turn your PDF publications into a flip-book with our unique Google optimized e-Paper software.
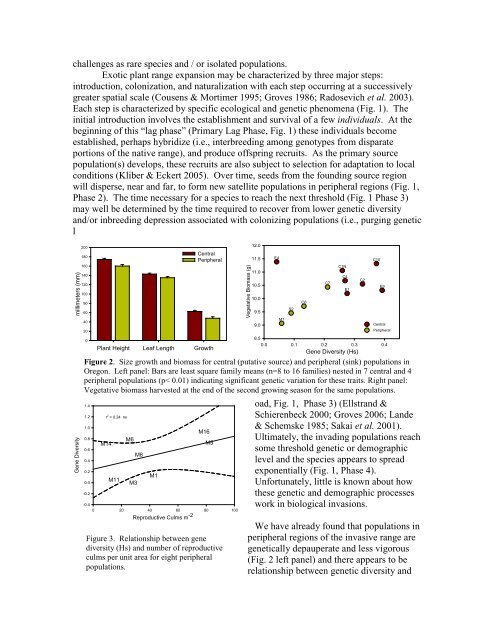
challenges as rare species and / or isolated populations.Exotic plant range expansion may be characterized by three major steps:introduction, colonization, and naturalization with each step occurring at a successivelygreater spatial scale (Cousens & Mortimer 1995; Groves 1986; Radosevich et al. 2003).Each step is characterized by specific ecological and genetic phenomena (Fig. 1). Theinitial introduction involves the establishment and survival of a few individuals. At thebeginning of this “lag phase” (Primary Lag Phase, Fig. 1) these individuals becomeestablished, perhaps hybridize (i.e., interbreeding among genotypes from disparateportions of the native range), and produce offspring recruits. As the primary sourcepopulation(s) develops, these recruits are also subject to selection <strong>for</strong> adaptation to localconditions (Kliber & Eckert 2005). Over time, seeds from the founding source regionwill disperse, near and far, to <strong>for</strong>m new satellite populations in peripheral regions (Fig. 1,Phase 2). The time necessary <strong>for</strong> a species to reach the next threshold (Fig. 1 Phase 3)may well be determined by the time required to recover from lower genetic diversityand/or inbreeding depression associated with colonizing populations (i.e., purging geneticlmillimeters (mm)Gene Diversity200180160140120100806040200CentralPeripheral<strong>Plant</strong> Height Leaf Length GrowthVegetative Biomass (g)8.50.0 0.1 0.2 0.3 0.4Gene Diversity (Hs)Figure 2. Size growth and biomass <strong>for</strong> central (putative source) and peripheral (sink) populations inOregon. Left panel: Bars are least square family means (n=8 to 16 families) nested in 7 central and 4peripheral populations (p< 0.01) indicating significant genetic variation <strong>for</strong> these traits. Right panel:Vegetative biomass harvested at the end of the second growing season <strong>for</strong> the same populations.1.41.21.00.80.60.40.20.0-0.2-0.4r 2 = 0.24 nsM14M11M6M3M8M1M16M50 20 40 60Reproductive Culms m -280 100Figure 3. Relationship between genediversity (Hs) and number of reproductiveculms per unit area <strong>for</strong> eight peripheralpopulations.12.011.511.010.510.09.59.0E4M1S2C6C7oad, Fig. 1, Phase 3) (Ellstrand &Schierenbeck 2000; Groves 2006; Lande& Schemske 1985; Sakai et al. 2001).Ultimately, the invading populations reachsome threshold genetic or demographiclevel and the species appears to spreadexponentially (Fig. 1, Phase 4).Un<strong>for</strong>tunately, little is known about howthese genetic and demographic processeswork in biological invasions.We have already found that populations inperipheral regions of the invasive range aregenetically depauperate and less vigorous(Fig. 2 left panel) and there appears to berelationship between genetic diversity andC1NC4E1C2C10E9CentralPeripheral