Fuel Indexes: A Novel Method for the Evaluation of Relevant ...
Fuel Indexes: A Novel Method for the Evaluation of Relevant ...
Fuel Indexes: A Novel Method for the Evaluation of Relevant ...

You also want an ePaper? Increase the reach of your titles
YUMPU automatically turns print PDFs into web optimized ePapers that Google loves.
Articlepubs.acs.org/EF<strong>Fuel</strong> <strong>Indexes</strong>: A <strong>Novel</strong> <strong>Method</strong> <strong>for</strong> <strong>the</strong> <strong>Evaluation</strong> <strong>of</strong> <strong>Relevant</strong>Combustion Properties <strong>of</strong> New Biomass <strong>Fuel</strong>sPeter Sommersacher,* ,† Thomas Brunner, †,‡,§ and Ingwald Obernberger †,‡,§† BIOENERGY 2020+ GmbH, Inffeldgasse 21b, A-8010 Graz, Austria‡ Institute <strong>for</strong> Process and Particle Engineering, Graz University <strong>of</strong> Technology, Inffeldgasse 21a, A-8010 Graz, Austria§ BIOS BIOENERGIESYSTEME GmbH, Inffeldgasse 21b, A-8010 Graz, AustriaABSTRACT: The increasing demand <strong>for</strong> biomass fuels leads to <strong>the</strong> introduction <strong>of</strong> new biomass fuels into <strong>the</strong> market. Thesenew biomass fuels (e.g., wastes and residues from agriculture and <strong>the</strong> food industry, short rotation coppices, and energy crops)are usually not well-defined regarding <strong>the</strong>ir combustion behavior. There<strong>for</strong>e, fuel characterization methods with a special focus oncombustion-related problems (gaseous NO x , HCl, and SO x emissions, ash-melting behavior, and PM emissions) have to bedeveloped. For this purpose, fuel indexes are an interesting option. <strong>Fuel</strong> indexes are derived from chemical fuel analyses and arechecked and evaluated regarding <strong>the</strong>ir applicability by measurements per<strong>for</strong>med at lab- and real-scale combustion plants <strong>for</strong> alarge variety <strong>of</strong> fuels. They provide <strong>the</strong> possibilities <strong>for</strong> a pre-evaluation <strong>of</strong> combustion-relevant problems that may arise from <strong>the</strong>use <strong>of</strong> a new biomass fuel. A possible relation to describe <strong>the</strong> corrosion risk is, <strong>for</strong> instance, <strong>the</strong> molar 2S/Cl ratio. The N contentin <strong>the</strong> fuel is an indicator <strong>for</strong> NO x emissions, and <strong>the</strong> sum <strong>of</strong> <strong>the</strong> concentrations <strong>of</strong> K, Na, Zn, and Pb in <strong>the</strong> fuel can give aprediction <strong>of</strong> <strong>the</strong> aerosol emissions, whereas <strong>the</strong> molar (K + Na)/[x(2S + Cl)] ratio provides a first indication regarding <strong>the</strong>potential <strong>for</strong> gaseous HCl and SO x emissions. The molar Si/K ratio can supply in<strong>for</strong>mation about <strong>the</strong> K release from <strong>the</strong> fuel to<strong>the</strong> gas phase. The molar Si/(Ca + Mg) ratio can give indications regarding <strong>the</strong> ash-melting temperatures <strong>for</strong> P-poor fuels. For P-rich fuels, <strong>the</strong> (Si + P + K)/(Ca + Mg) ratio can be used <strong>for</strong> <strong>the</strong> same purpose. The fuel indexes mentioned can provide a firstpre-evaluation <strong>of</strong> combustion-relevant properties <strong>of</strong> biomass fuels. There<strong>for</strong>e, time-consuming and expensive combustion testscan partly be saved. The indexes mentioned are especially developed <strong>for</strong> grate combustion plants, because interactions <strong>of</strong> <strong>the</strong> bedmaterial possible in fluidized-bed combustion systems are not considered.1. INTRODUCTION, BACKGROUND, AND SCOPEThe general increase in energy demand, higher costs, andoncoming depletion <strong>of</strong> fossil fuels are reasons <strong>for</strong> considerableresearch on renewable energies and raw material resources.Biomass energy can be an important factor in reducinggreenhouse gas emissions and energy source independence. 1To increase <strong>the</strong> biomass use in <strong>the</strong> energy sector, productssuch as wastes and residues from agriculture and <strong>the</strong> foodindustry, as well as short-rotation plants, such as poplar, andenergy crops, such as Miscanthus, Arundo donax, and grasses,can be used. These new biomass fuels gain rising interest <strong>for</strong>use in biomass combustion systems. As a result, new biomassfuels are <strong>of</strong> relevance <strong>for</strong> furnace and boiler manufacturers aswell as utilities. According to <strong>the</strong> increasing prices <strong>for</strong>conventional biomass fuels (e.g., wood), new options <strong>for</strong> heatand power generation from cheap feedstocks have to beidentified to increase <strong>the</strong> economic efficiency <strong>of</strong> biomassheating and combined heat and power (CHP) plants. Theintroduction <strong>of</strong> new biomass fuels may also create newemployment opportunities in rural areas and, <strong>the</strong>re<strong>for</strong>e, alsocontribute to <strong>the</strong> social aspect <strong>of</strong> sustainability. 2,3For <strong>the</strong> past decade, agricultural studies throughout Europehave been focusing on introducing new nonfeed crops with aperspective <strong>for</strong> industrial applications. Perennial rhizomatousgrasses, such as switchgrass (Panicum virgatum), Miscanthusspp., giant reed (A. donax), and red canarygrass (Phalarisarundinacea), have been considered as <strong>the</strong> most promisingenergy crops <strong>for</strong> Europe. The employment <strong>of</strong> such rawmaterials contributes to reduce anthropogenic CO 2 emissions.Also, <strong>the</strong> situation <strong>of</strong> <strong>the</strong> agricultural sector in <strong>the</strong> EuropeanUnion (EU) can be improved. This sector is characterized byfood surplus, which has led to a policy <strong>of</strong> setting land aside.There<strong>for</strong>e, introducing alternative nonfood crops as energycrops can represent a new opportunity <strong>for</strong> <strong>the</strong> population <strong>of</strong>rural areas. Perennial grasses, such as Miscanthus and giant reed,show some ecological advantages. They require limited soilmanagement and a low demand <strong>for</strong> nutrient inputs. Also,fur<strong>the</strong>r restoration <strong>of</strong> degraded land may be possible. 4Short-rotation coppices (SRCs) are fast-growing tree species,which are used to produce biomass as a renewable energysource. The most common SRCs are willow and poplar, whichhave been shown to be viable alternatives to fossil fuels. 2Agricultural residues, such as olive stones, are already used asfuels <strong>for</strong> combustion processes; however, a great fur<strong>the</strong>rpotential <strong>of</strong> <strong>the</strong>se fuels exist, which is presently not used butdisposed. 5However, because new biomass fuels are not well-defined yetregarding <strong>the</strong>ir combustion behavior, fuel characterization witha special focus on combustion-related fuel properties is a firstimportant step <strong>for</strong> <strong>the</strong>ir introduction. Possible ash-relatedproblems (ash melting on grates, bed agglomeration influidized-bed combustion systems, deposit <strong>for</strong>mation andReceived: August 29, 2011Revised: November 25, 2011© XXXX American Chemical Society A dx.doi.org/10.1021/ef201282y | Energy <strong>Fuel</strong>s XXXX, XXX, XXX−XXX
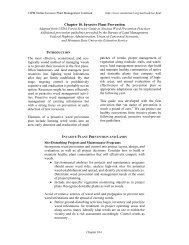
Energy & <strong>Fuel</strong>sArticleFigure 1. Scheme <strong>of</strong> <strong>the</strong> lab-scale reactor, including measurement setup (left), definition <strong>of</strong> common test conditions <strong>for</strong> all experiments (middle),and projection <strong>of</strong> <strong>the</strong> lab-scale reactor fuel bed to <strong>the</strong> fuel layer in a grate furnace (right). 10,112.2. <strong>Method</strong>ology. Proximate and ultimate analyses <strong>of</strong> <strong>the</strong> fuelsinvestigated (ash content, contents <strong>of</strong> N, S, Cl, and major and minorash-<strong>for</strong>ming elements) are applied as <strong>the</strong> basis <strong>for</strong> <strong>the</strong> work presented.The analytical methods are described in section 3. From <strong>the</strong> results <strong>of</strong><strong>the</strong>se analyses, fuel indexes are calculated and evaluated. They aredefined by considering <strong>the</strong> physical behavior and chemical reactions <strong>of</strong>dedicated elements during biomass combustion, known interactions <strong>of</strong>different ash-<strong>for</strong>ming elements during <strong>the</strong>rmal biomass conversion,and correlations and experiences gained from pilot- and real-scalecombustion as well as lab-scale combustion tests with conventionaland new biomass fuels. Data derived from combustion tests per<strong>for</strong>medat BIOENERGY 2020+, <strong>the</strong> Institute <strong>for</strong> Process and ParticleEngineering, Graz University <strong>of</strong> Technology, and BIOS BIOEN-ERGIESYSTEME GmbH, Graz, Austria, were considered.2.3. Pilot- and Real-Scale Combustion Tests. All combustionplants have geometrically separated primary and secondary combustionzones and, thus, enable an efficient air staging. The primary airratio (amount <strong>of</strong> primary air/stoichiometric amount <strong>of</strong> air) is typicallybelow 1 (0.6−0.9), and <strong>the</strong> overall air ratio applied is between 1.4 and1.6. The plants are also equipped with flue gas recirculation, whichensures that <strong>the</strong> bed temperature is kept in a range <strong>of</strong> 900−1100 °C.The real-scale combustion plants investigated are also grate-firedcombustion systems with nominal <strong>the</strong>rmal boiler capacities between0.5 and 110 MW. Also, <strong>the</strong>se boilers are equipped with air-stagingtechnology, and most <strong>of</strong> <strong>the</strong>m are equipped with flue gas recirculation.Grate combustion plants representing <strong>the</strong> present state-<strong>of</strong>-<strong>the</strong>-art werechosen, and only comparable combustion setups were consideredwithin <strong>the</strong> evaluation.During <strong>the</strong> pilot- and real-scale combustion tests, <strong>the</strong> following datawere collected: (1) <strong>Fuel</strong> sampling and subsequent analyses: (i)moisture content, ash content, and chemical composition. (2) Aerosoland fly ash sampling: (i) For aerosol emissions, low-pressure-cascadeimpactors (Berner-type low-pressure impactors) were used. (ii) Fortotal fly ash emissions, <strong>the</strong> gravimetric method according to VDI 2066was used. (3) Deposit sampling with deposit probes. (4) Emissionmeasurements concerning CO, CO 2 , NO, NO x ,O 2 ,SO x , and HCl: (i)CO, CO 2 , and O 2 were measured with a multi-component gas analyzer(Rosemount NGA 2000). This device uses non-dispersive infraredmeasurement technique (NDIR) <strong>for</strong> CO and CO 2 analyses andparamagnetism as a measurement principle <strong>for</strong> O 2 detection. (ii) Anitric oxide analyzer (ECO Physis CLD 700 El ht), which uses <strong>the</strong>principle <strong>of</strong> chemiluminescence, has been used <strong>for</strong> NO and NO xdetection. (iii) The SO x and HCl emissions were per<strong>for</strong>med bydiscontinuous measurements according to VDI 3480, Sheet 1. (5)Determination <strong>of</strong> <strong>the</strong> furnace temperatures. (6) Sampling <strong>of</strong> allrelevant ash fractions (bottom ash, furnace ash, cyclone ash, filter flyash, and aerosols) and subsequent analyses: (i) chemical composition.(7) Recording <strong>of</strong> all relevant operating parameters (O 2 content in <strong>the</strong>flue gas, furnace temperature, load, combustion air supply, etc.)The methods used <strong>for</strong> fuel and ash analyses are described in section3. On <strong>the</strong> basis <strong>of</strong> <strong>the</strong> analysis results and measurement data, energy,mass, and element balances over <strong>the</strong> plant were calculated. Moreover,recovery rates <strong>for</strong> all ash-<strong>for</strong>ming elements considered were evaluatedto ensure <strong>the</strong> quality <strong>of</strong> <strong>the</strong> data. Only test runs with recovery rates>90% were used <strong>for</strong> fur<strong>the</strong>r evaluation.2.4. Lab-Scale Reactor Tests. In addition, results from test runswith a lab-scale reactor especially designed <strong>for</strong> <strong>the</strong> investigation <strong>of</strong> <strong>the</strong><strong>the</strong>rmal decomposition behavior <strong>of</strong> biomass fuels have beenconsidered.This lab-scale reactor consists <strong>of</strong> a cylindrical retort (height, 35 cm;inner diameter, 12 cm), which is heated electrically and controlled bytwo separated proportional−integral−derivative (PID) controllers (seeFigure 1, left). The fuel is put in a cylindrical holder <strong>of</strong> 100 mm heightand 95 mm inner diameter. The material <strong>of</strong> <strong>the</strong> reactor wall andsample holder is silicon carbide, which is inert under reducing andoxidizing conditions; <strong>the</strong>re<strong>for</strong>e, <strong>the</strong> wall does not react with <strong>the</strong> fuel,ash, and flue gas. The mounting and vessel <strong>for</strong> <strong>the</strong> fuel bed are placedon <strong>the</strong> plate <strong>of</strong> a scale. The scale is mechanically separated from <strong>the</strong>retort by a liquid sealing (syn<strong>the</strong>tic <strong>the</strong>rmal oil: Therminol 66). Thescale is used to determine <strong>the</strong> weight loss <strong>of</strong> <strong>the</strong> sample.With this setup, it is possible to continuously measure <strong>the</strong> massreduction <strong>of</strong> <strong>the</strong> sample during drying, pyrolysis, gasification, andcharcoal combustion. The sample is introduced into <strong>the</strong> preheatedreactor, and <strong>the</strong>re<strong>for</strong>e, a rapid heating, which is well-comparable to <strong>the</strong>heating in real <strong>the</strong>rmal conversion processes, can be achieved. The testconditions <strong>for</strong> all test runs per<strong>for</strong>med with <strong>the</strong> lab-scale reactor aredefined in Figure 1.The following measurements/analyses were per<strong>for</strong>med during each<strong>of</strong> <strong>the</strong> combustion test runs: (1) Mass decrease <strong>of</strong> <strong>the</strong> fuel over time(balance). (2) Concentrations <strong>of</strong> flue gas species over time: (i)Determination <strong>of</strong> CO 2 ,H 2 O, CO, CH 4 ,NH 3 , HCN, N 2 O, and basichydrocarbons was per<strong>for</strong>med with a multi-component Fouriertrans<strong>for</strong>m infrared (FTIR) spectroscopy device (Ansyco Series 447).(ii) The O 2 and H 2 concentrations were measured with a multicomponentgas analyzer (Rosemount NGA 2000). This device usesparamagnetism as a measurement principle <strong>for</strong> O 2 detection and a<strong>the</strong>rmal conductivity detector (TCD) <strong>for</strong> H 2 detection. (iii) Theamount <strong>of</strong> total hydrocarbons (C x H y ) was determined with a flameionization detector (FID, Bernath Atomic 3005), which detectsorganic compounds by ionization in a burning H 2 flame. (iv) Widebandλ sensor (O 2 ). (v) A nitric oxide analyzer (ECO Physis CLD 700El ht), which uses <strong>the</strong> principle <strong>of</strong> chemiluminescence, has been used<strong>for</strong> NO and NO 2 detection. (3) Temperature measurements overtime: (i) Five <strong>the</strong>rmocouples in <strong>the</strong> fuel bed (three different heightsNiCr−Ni). (ii) Thermocouples in <strong>the</strong> gas phase (NiCr−Ni). (4)Analysis <strong>of</strong> <strong>the</strong> biomass fuel used and residual ash produced (seesection 3).The data <strong>of</strong> <strong>the</strong> fuel analysis and <strong>the</strong> residual ash analysis as well as<strong>the</strong> weight measurements <strong>of</strong> <strong>the</strong> fuel sample and <strong>the</strong> ash sample can beCdx.doi.org/10.1021/ef201282y | Energy <strong>Fuel</strong>s XXXX, XXX, XXX−XXX
Energy & <strong>Fuel</strong>sused to calculate <strong>the</strong> elemental release to <strong>the</strong> gas phase. This isper<strong>for</strong>med by calculating <strong>the</strong> mass balance <strong>for</strong> every relevant elementas well as <strong>the</strong> total ash.The lab-scale reactor has been designed to represent <strong>the</strong> burningconditions <strong>of</strong> a biomass fuel layer on a grate as well as possible (Figure1, right). This approach is valid if diffusional transport and mixingeffects on <strong>the</strong> grate can be neglected in comparison to <strong>the</strong> transport <strong>of</strong><strong>the</strong> fuel along <strong>the</strong> grate. The validation has been achieved in previousresearch, which has shown that <strong>the</strong> fuel transport along <strong>the</strong> grate canbe fluidically characterized by a plug flow in good approximation. 10,112.5. Definition <strong>of</strong> <strong>Fuel</strong> <strong>Indexes</strong>. On <strong>the</strong> basis <strong>of</strong> <strong>the</strong> evaluation <strong>of</strong><strong>the</strong> fuel analysis and test runs as well as a <strong>the</strong>oretical evaluation, <strong>the</strong>following fuel indexes have been investigated and are presented in <strong>the</strong>following: (1) N concentration in <strong>the</strong> fuel as an indicator <strong>for</strong> NO xemissions, (2) sum <strong>of</strong> K, Na, Zn, and Pb as an indicator regardingaerosol emissions (fine particles smaller than 1 μm) and depositbuildup, (3) molar Si/K ratio <strong>for</strong> an estimation <strong>of</strong> <strong>the</strong> K release from<strong>the</strong> fuel to <strong>the</strong> gas phase, (4) molar 2S/Cl ratio <strong>for</strong> <strong>the</strong> prediction <strong>of</strong><strong>the</strong> risk <strong>of</strong> high-temperature corrosion, (5) molar (K + Na)/[x(2S +Cl)] ratio <strong>for</strong> <strong>the</strong> prediction <strong>of</strong> <strong>the</strong> gaseous emissions <strong>of</strong> SO x and HCl,and (6) <strong>the</strong> prediction <strong>of</strong> <strong>the</strong> ash-melting temperatures with <strong>the</strong> molarSi/(Ca + Mg) and molar (Si + K + P)/(Ca + Mg) ratios.The definitions <strong>of</strong> <strong>the</strong> above-mentioned indexes are based on<strong>the</strong>oretical considerations. With <strong>the</strong> exception <strong>of</strong> <strong>the</strong> molar Si/K ratioand <strong>the</strong> factor x occurring in <strong>the</strong> index (K + Na)/[x(2S + Cl)], allindexes were validated using results <strong>of</strong> pilot- and real-scale combustiontests. The factor x is a function <strong>of</strong> <strong>the</strong> release <strong>of</strong> K, Na, S, and Cl from<strong>the</strong> fuel to <strong>the</strong> gas phase, which has been derived from lab-scale reactortests (see Figure 1), because <strong>of</strong> <strong>the</strong> well-defined conditions providedby this unit. To evaluate <strong>the</strong> index <strong>of</strong> <strong>the</strong> molar Si/K ratio, data from<strong>the</strong> lab-scale reactor have also been used.3. CHEMICAL FUEL ANALYSES: THE BASIS FOR THECALCULATION OF FUEL INDEXES3.1. General Aspects. Because <strong>the</strong> quality <strong>of</strong> <strong>the</strong> fuelanalyses applied <strong>for</strong>ms <strong>the</strong> most important basis <strong>for</strong> <strong>the</strong>evaluation <strong>of</strong> fuel indexes, only highly accurate methods, whichhave already proven <strong>the</strong>ir applicability <strong>for</strong> biomass fuels, shouldbe applied. Moreover, it has to be taken into consideration that<strong>the</strong> fuel sample investigated is representative <strong>for</strong> <strong>the</strong> biomassfuel <strong>of</strong> interest. Especially when new agricultural biomass fuelsare evaluated, it must always be clearly defined if <strong>the</strong> fuelcontains, <strong>for</strong> instance, leaves, stalks, grains, whole fruits, etc.,because usually different parts <strong>of</strong> a plant show stronglydeviating chemical compositions. The application <strong>of</strong> <strong>the</strong>following analysis methods, which have also been used by <strong>the</strong>authors, is strongly recommended. The recommendation <strong>of</strong> <strong>the</strong>methods is a result <strong>of</strong> <strong>the</strong> FP6 project BioNorm, 12 whichamong o<strong>the</strong>r aspects also dealt with <strong>the</strong> definition <strong>of</strong> standardsand best practice guidelines <strong>for</strong> biomass fuel analyses.Recommendations <strong>of</strong> this project also resulted in newEuropean standards implemented by CEN/TC 335.3.2. Moisture Content. The moisture content <strong>of</strong> fuelsamples has been determined according to ÖNORM CEN/TS14774 (determination <strong>of</strong> <strong>the</strong> weight loss during drying at 105°C until a constant weight is reached).3.3. <strong>Fuel</strong> Sample Preparation. Sample preparation hasbeen carried out according to CEN/TS 14780: <strong>the</strong> samples arehomogenized, and a cone is <strong>for</strong>med and subsequently dividedinto four portions. The two opposing portions are mixed toreceive two sub-samples. One <strong>of</strong> <strong>the</strong> two sub-samples is storedas a retain sample. The o<strong>the</strong>r sub-sample is handled as follows:(1) drying <strong>of</strong> <strong>the</strong> sample at 105 °C, (2) milling <strong>of</strong> <strong>the</strong> wholesample in a cutting mill to a particle size
Energy & <strong>Fuel</strong>sFor <strong>the</strong> evaluation <strong>of</strong> <strong>the</strong> ash-melting behavior, primarily <strong>the</strong>sintering temperature (start <strong>of</strong> ash melting) and <strong>the</strong> temperaturewindow between <strong>the</strong> sintering and melting temperaturesare <strong>of</strong> relevance. It has to be considered that <strong>the</strong> characteristicash-melting temperatures are valid <strong>for</strong> <strong>the</strong> total ash (fuel ash).In real-scale applications, <strong>the</strong> distribution <strong>of</strong> certain elements indifferent ash fractions may influence <strong>the</strong> melting temperatures<strong>of</strong> <strong>the</strong> individual fractions.4. SELECTED RELEVANT FUEL INDEXES AND THEIRAPPLICATION4.1. N Content as an Indicator <strong>for</strong> <strong>the</strong> NO x EmissionPotential. In biomass combustion processes, NO x emissionsmainly result from <strong>the</strong> fuel N, while <strong>the</strong>ir <strong>for</strong>mation from <strong>the</strong>combustion air (prompt and <strong>the</strong>rmal NO x <strong>for</strong>mation) playsonly a minor role. 13−15 For <strong>the</strong> pre-evaluation <strong>of</strong> a new biomassfuel, it is important to know if problems with NO x emissionsexceeding <strong>the</strong> emission limits have to be expected, whichcannot be overcome by primary measures and make secondarymeasures <strong>for</strong> NO x emission control [e.g., selective non-catalyticreduction (SNCR)] af<strong>for</strong>dable.On <strong>the</strong> basis <strong>of</strong> results <strong>of</strong> test runs at modern state-<strong>of</strong>-<strong>the</strong>-artgrate combustion plants (see section 2.3) equipped with airstagingtechnology, a correlation between <strong>the</strong> conversion rate <strong>of</strong>fuel N to N in NO x emissions has been derived (see Figure 2),Figure 2. NO x emissions and fuel N converted to N in NO xdependent upon <strong>the</strong> N content. Explanation: both correlations arestatically significant (p < 0.05).which can be applied to estimate <strong>the</strong> NO x emissions <strong>for</strong>medduring <strong>the</strong> combustion <strong>of</strong> a certain fuel in grate combustionsystems. Because combustion plants investigated are equippedwith air-staging technology, <strong>the</strong> index is only valid <strong>for</strong> state-<strong>of</strong><strong>the</strong>-artgrate-fired combustion units with air-staging technology.As seen in Figure 2, <strong>the</strong> NO x emissions increase with <strong>the</strong> Ncontent <strong>of</strong> <strong>the</strong> fuel. However, <strong>the</strong>re is no linear correlationArticlebecause, as <strong>the</strong> second diagram shows, with an increasing Ncontent <strong>of</strong> <strong>the</strong> fuel, <strong>the</strong> conversion <strong>of</strong> fuel N to NO x decreases.The N concentrations in <strong>the</strong> biomass fuels can be categorizedinto (1) low-N fuels (200 mg N −1 m −3 (related to dry flue gas and 13 vol%O 2 ) have to be expected.4.2. Sum <strong>of</strong> K, Na, Zn, and Pb as an IndicatorRegarding Aerosol Emissions (Fine Particles Smallerthan 1 μm) and Deposit Buildup. This indicator can beused to evaluate if highly efficient dust precipitators [electrostaticprecipitators (ESPs) and baghouse filter] will be neededto keep <strong>the</strong> particulate matter (PM) emission limits <strong>for</strong> a plantusing a specific fuel. It is also an indicator <strong>for</strong> <strong>the</strong> depositbuildup on heat-exchanger surfaces. This index is related to <strong>the</strong><strong>for</strong>mation <strong>of</strong> aerosols (particles with a diameter smaller than 1μm = PM 1 ) during <strong>the</strong> combustion process and does notinclude coarse fly ashes.A part <strong>of</strong> <strong>the</strong> semi-volatile and volatile ash-<strong>for</strong>ming elements,such as K, Na, S, Cl, Zn, and Pb, is released from <strong>the</strong> fuel to <strong>the</strong>gas phase during combustion. In <strong>the</strong> gas phase, <strong>the</strong>se elementsundergo homogeneous gas-phase reactions, and later, because<strong>of</strong> supersaturation in <strong>the</strong> gas phase, <strong>the</strong>se ash-<strong>for</strong>ming vaporsstart to nucleate or condense on <strong>the</strong> surfaces <strong>of</strong> existingparticles or heat-exchanger tubes. 16,17Because <strong>for</strong> most biomass fuels K usually shows significantlyhigher concentrations than o<strong>the</strong>r aerosol-<strong>for</strong>ming elements(e.g., Na, Zn, and Pb), <strong>the</strong> release <strong>of</strong> K is most relevant <strong>for</strong> <strong>the</strong><strong>for</strong>mation <strong>of</strong> aerosol emissions.It is reported in previous studies 18,19 that <strong>the</strong> main part <strong>of</strong> Kreleased to <strong>the</strong> gas phase consists <strong>of</strong> KOH and KCl in <strong>the</strong> entiretemperature range <strong>of</strong> 500−1150 °C. Smaller amounts <strong>of</strong> K arereleased as K 2 SO 4 and K 2 CO 3 in this temperature range. It isevident that <strong>the</strong>re is a number <strong>of</strong> parameters influencing <strong>the</strong> Krelease.It has also been reported 20 that ash-<strong>for</strong>ming elements, suchas Ca, Si, and P, may influence <strong>the</strong> K release to <strong>the</strong> gas phase toa certain degree. There<strong>for</strong>e, well-defined mixtures <strong>of</strong> K, Ca, andSi (or P) species were heat-treated in a reactor at a constanttemperature (900 and 1000 °C). The main findings <strong>of</strong> <strong>the</strong>seexperiments are summarized as follows. The presence <strong>of</strong> waterin <strong>the</strong> gas flow was found to significantly enhance <strong>the</strong> K-releaserate in both <strong>the</strong> K−Ca−Si and K−Ca−P systems. The K−Ca−Si system shows higher release rates at 1000 °C than at 900 °C.Doubling <strong>of</strong> <strong>the</strong> molar Ca/Si ratio in K 2 CO 3 −CaO−SiO 2mixtures increased <strong>the</strong> K-release rate about 2 times. Thissuggests that it is more likely that SiO 2 reacts with CaO and Kis being released to <strong>the</strong> gas phase instead <strong>of</strong> being incorporatedinto silicate structures. For <strong>the</strong> K−Ca−P system, where K 2 CO 3was used as <strong>the</strong> K source, it has been observed that, with adecreasing molar Ca/P ratio, <strong>the</strong> K-release rate significantlydecreases. In <strong>the</strong> case <strong>of</strong> K−Ca−P mixtures, with KCl as <strong>the</strong> Ksource, <strong>the</strong> Ca/P ratio had no effect on <strong>the</strong> K-release rate. It hasbeen proven that <strong>the</strong> sublimation <strong>of</strong> KCl is less influenced byo<strong>the</strong>r elements, whereas <strong>the</strong> release <strong>of</strong> K 2 CO 3 is enhanced in<strong>the</strong> presence <strong>of</strong> water vapor because <strong>of</strong> <strong>the</strong> reaction to KOH.Straw, Miscanthus, and maize residues are typical fuels withincreased Si and slightly increased P concentrations. Because <strong>of</strong>still existing uncertainties regarding <strong>the</strong> K release, <strong>the</strong>Edx.doi.org/10.1021/ef201282y | Energy <strong>Fuel</strong>s XXXX, XXX, XXX−XXX
Energy & <strong>Fuel</strong>sArticleindications made by this index must be handled with care <strong>for</strong>Si- and P-rich fuels (see also section 4.3).As presented in Figure 3, <strong>the</strong> sum <strong>of</strong> K, Na, Zn and Pb in <strong>the</strong>fuel can be applied as an indicator regarding <strong>the</strong> potential <strong>for</strong>Figure 4. Molar Si/K ratio versus K release <strong>for</strong> different biomass fuels.Explanations: no statistical significance.Figure 3. PM 1 emissions in <strong>the</strong> flue gas downstream <strong>of</strong> <strong>the</strong> boilerversus concentrations <strong>of</strong> aerosol-<strong>for</strong>ming elements in <strong>the</strong> fuel.Explanation: <strong>the</strong> correlation is statistically significant (p < 0.05).PM 1 emissions. The fuel and PM 1 emission data presented aretaken from a considerable number <strong>of</strong> pilot- and real-scale testruns at grate-fired combustion plants (see also section 2).It can be seen in Figure 3 that, with an increasing sum <strong>of</strong> K,Na, Zn, and Pb in <strong>the</strong> fuel, <strong>the</strong> aerosol emissions increase.According to this index regarding aerosol emissions, biomassfuels may be categorized in (1) low PM 1 emission range, index10 000 mg/kg db <strong>for</strong> grasspellets and straw.New biomass fuel assortments (e.g., poplar, Miscanthus, andmaize residues) are most commonly located in <strong>the</strong> medium tohigh PM 1 emission range.Because increasing aerosol emissions are usually associatedwith increased deposit <strong>for</strong>mation on heat-exchanger tubes(because <strong>of</strong> <strong>the</strong> fact that aerosol <strong>for</strong>mation is alwaysaccompanied by direct condensation <strong>of</strong> ash vapors on coldheat-exchanger surfaces), with increased values <strong>of</strong> this index,also, deposit buildup usually increases. In future work, <strong>the</strong>influence <strong>of</strong> Si and P on <strong>the</strong> K release and, thus, aerosol<strong>for</strong>mation will be investigated in more detail, especially <strong>for</strong> newbiomass fuels.4.3. Molar Si/K Ratio as an Indicator <strong>for</strong> <strong>the</strong> KRelease. A high molar Si/K ratio leads to a preferred<strong>for</strong>mation <strong>of</strong> potassium silicates, 19−21 which are bound in <strong>the</strong>bottom ash. There<strong>for</strong>e, <strong>the</strong> K release is reduced. This is <strong>of</strong>relevance because, <strong>for</strong> instance, aerosol <strong>for</strong>mation stronglydepends upon <strong>the</strong> amount <strong>of</strong> K released from <strong>the</strong> fuel.Moreover, if less K is available in <strong>the</strong> gas phase <strong>for</strong> reactionswith S and Cl, <strong>the</strong> gaseous SO x and HCl emissions mayincrease.In Figure 4, data regarding <strong>the</strong> correlation between <strong>the</strong> molarSi/K ratio and <strong>the</strong> K release, gained from lab-scale test runs, arepresented.For very high Si/K ratios (i.e., <strong>for</strong> sewage sludge), a goodembedding <strong>of</strong> K in <strong>the</strong> bottom ash and, consequently, a verylow K release prevails. However, <strong>for</strong> low Si/K ratios (
Energy & <strong>Fuel</strong>s<strong>for</strong> aerosol and deposit <strong>for</strong>mation, gaseous HCl emissions, andregarding corrosion risks.In Figure 6, data from lab-scale reactor tests are presentedthat clearly show that <strong>the</strong>re is an almost linear increase <strong>of</strong> <strong>the</strong>Figure 6. Cl concentration <strong>of</strong> <strong>the</strong> fuel versus Cl release to <strong>the</strong> gasphase. Explanation: <strong>the</strong> trend is statistically significant (p < 0.05).amount <strong>of</strong> Cl released from <strong>the</strong> fuel to <strong>the</strong> gas phase and <strong>the</strong> Clconcentration in <strong>the</strong> fuel. As <strong>for</strong> S, this indicates that <strong>the</strong> Clrelease does not strongly depend upon o<strong>the</strong>r fuel propertiesand is usually in <strong>the</strong> range <strong>of</strong> >90 wt %.4.6. Molar 2S/Cl Ratio as an Indicator <strong>for</strong> High-Temperature Corrosion Risks. With regard to corrosion inbiomass-fired boilers, in particular, three mechanisms arerelevant: 25,26 (1) <strong>the</strong> direct attack <strong>of</strong> gaseous HCl or Cl 2 toheat-exchanger surfaces, (2) <strong>the</strong> <strong>for</strong>mation <strong>of</strong> alkali sulfate and/or alkali chloride melts, which dissolve <strong>the</strong> protective oxidelayer <strong>of</strong> <strong>the</strong> heat-exchanger surface, and (3) <strong>the</strong> sulfation <strong>of</strong>alkali metal or heavy metal chlorides in <strong>the</strong> tube near <strong>the</strong>deposition layer. From this mechanism, Cl is released, whichsubsequently attacks <strong>the</strong> tube surface (so-called activeoxidation).Among <strong>the</strong> three mechanisms mentioned, active oxidation is<strong>the</strong> most relevant mechanism regarding high-temperaturecorrosion in boilers. 25As already explained in sections 4.4 and 4.5, S and Cl showalmost constant release ratios <strong>for</strong> different biomass fuels. Bo<strong>the</strong>lements are relevant <strong>for</strong> aerosol and deposit <strong>for</strong>mationbecause, in <strong>the</strong> gas phase, <strong>the</strong>y <strong>for</strong>m alkaline sulfates andalkaline chlorides, which subsequently <strong>for</strong>m particles orcondense on heat-exchanger surfaces. There<strong>for</strong>e, a link between<strong>the</strong> 2S/Cl ratio in <strong>the</strong> fuel and <strong>the</strong> respective aerosol deposits<strong>for</strong>med prevails. In Figure 7, data regarding <strong>the</strong> 2S/Cl ratio inArticleaerosol emissions are plotted over <strong>the</strong> respective index relatedto <strong>the</strong> fuel. A clear correlation can be derived. For fuels withhigh 2S/Cl ratios, a protective sulfate layer is <strong>for</strong>med at <strong>the</strong> tubesurfaces. According to <strong>the</strong> literature, 25 <strong>the</strong>re<strong>for</strong>e, only minorcorrosion risks have to be expected <strong>for</strong> 2S/Cl ratios in <strong>the</strong> fuel<strong>of</strong> >4. It is additionally suggested that <strong>the</strong> molar 2S/Cl ratio in<strong>the</strong> fuel should be at least 8 to achieve negligible chlorine levelsin boiler deposits and <strong>the</strong>reby eliminate corrosion from thissource. Figure 7 shows that s<strong>of</strong>twood and grass pellets showonly minor corrosion risks.According to Figure 7, <strong>the</strong> Cl concentrations in aerosolsincrease with decreasing 2S/Cl ratios in <strong>the</strong> fuel, while <strong>the</strong>sulfate concentrations decrease. For 2S/Cl ratios in <strong>the</strong> fuel 90%, respectively. Duringcombustion, S and Cl preferably <strong>for</strong>m alkaline (K and Na)sulfates and chlorides. S also <strong>for</strong>ms Ca and Mg sulfate, and to asmaller extent, Ca and Mg chlorides can be <strong>for</strong>med. Cl and S,which are not bound by <strong>the</strong>se elements to <strong>the</strong> solid phase, <strong>for</strong>mgaseous emissions, namely, HCl and SO x . Because <strong>of</strong> <strong>the</strong> factthat in biomass fuels usually <strong>the</strong> K concentration is muchhigher than <strong>the</strong> Na concentration, <strong>the</strong> K release to <strong>the</strong> gasphase is <strong>of</strong> great relevance <strong>for</strong> <strong>the</strong> reaction schemes explainedabove.The factor x in <strong>the</strong> molar (K + Na)/[x(2S + Cl)] ratiodescribes <strong>the</strong> average release rates <strong>of</strong> K and Na in relation to<strong>the</strong> average release rates <strong>of</strong> S and Cl. When considering <strong>the</strong>reaction schemes mentioned above, this index can be defined topredict <strong>the</strong> potential <strong>for</strong> SO x and HCl emissions associated with<strong>the</strong> combustion <strong>of</strong> a specific fuel.A molar ratio (K + Na)/[x(2S + Cl)] > 1 indicates a surplus<strong>of</strong> released alkaline metals. There<strong>for</strong>e, <strong>for</strong> a value clearly >1,very small HCl and SO x emissions have to be expected, becausemost S and Cl will be bound in <strong>the</strong> ash. If <strong>the</strong> value <strong>of</strong> <strong>the</strong> indexis clearly
Energy & <strong>Fuel</strong>sOn <strong>the</strong> basis <strong>of</strong> <strong>the</strong> results from pilot, real, and lab reactorcombustion tests with different biomass fuels, <strong>the</strong> release rates<strong>for</strong> K were calculated. The release was quantified by a massbalance based on weight measurements and chemical analysis<strong>of</strong> <strong>the</strong> fuel and ash obtained. The <strong>for</strong>mula <strong>of</strong> <strong>the</strong> release rate <strong>for</strong>pilot- and real-scale combustion tests is shown in eq 1, and <strong>the</strong><strong>for</strong>mula <strong>of</strong> <strong>the</strong> release rate <strong>for</strong> lab-scale combustion tests isshown in eq 2.The incoming mass flow <strong>of</strong> fuel is m fuel(db) . The mass flow thatis not released to <strong>the</strong> gas phase is <strong>the</strong> sum <strong>of</strong> <strong>the</strong> remaining ashfraction on <strong>the</strong> grate m bottom ash(db) (kg/h, db) and <strong>the</strong> mass <strong>of</strong>entrained particles from <strong>the</strong> fuel bed. The mass flows (kg/h,db) that are entrained from <strong>the</strong> fuel bed and separated in <strong>the</strong>boiler are m furnace ash(db) and m boiler ash(db) . The chemicalcomposition <strong>of</strong> <strong>the</strong> fuel is c K,fuel(db) (mg/kg, db), and <strong>the</strong>chemical composition <strong>for</strong> <strong>the</strong> ash sample is c K,bottom ash(db) .Itisassumed that <strong>the</strong> entrained ash particles [m furnace ash(db) andm boiler ash(db) ] have <strong>the</strong> same composition as <strong>the</strong> bottom ash.This <strong>of</strong> course neglects <strong>the</strong> mass <strong>of</strong> ash-<strong>for</strong>ming vapors, whichend up on <strong>the</strong> surface <strong>of</strong> coarse fly ash particles (e.g., bycondensation or surface reactions) in <strong>the</strong> boiler (e.g., K 2 SO 4and KCl). However, <strong>the</strong>se processes have only a minorinfluence on <strong>the</strong> total mass <strong>of</strong> entrained particles.In equation (2) m input(db) is <strong>the</strong> mass (g, db) <strong>of</strong> <strong>the</strong> sample fedto <strong>the</strong> reactor, c K,input(db) is <strong>the</strong> concentration <strong>of</strong> K in <strong>the</strong> fuel(mg/kg, db), m output(db) is <strong>the</strong> mass (g, db) <strong>of</strong> <strong>the</strong> ash residualafter <strong>the</strong> experiment in <strong>the</strong> reactor and c K,output(db) is <strong>the</strong>concentration <strong>of</strong> K in <strong>the</strong> ash residual (mg/kg, db). The mass<strong>of</strong> entrained fly ash particle is negligible because <strong>of</strong> <strong>the</strong> muchlower air velocities in <strong>the</strong> fuel bed compared to pilot- or realscaleapplications.The determined release rates are shown in Figure 8.Figure 8. K release <strong>for</strong> different biomass fuels during combustion.(1)(2)It can be assumed that Na shows a comparable releasebehavior to <strong>the</strong> gas phase as K. There<strong>for</strong>e, <strong>the</strong> values <strong>of</strong> Krelease can be used <strong>for</strong> calculating <strong>the</strong> factor x <strong>of</strong> <strong>the</strong> molar (K+ Na)/[x(2S + Cl)] ratio. An averaged release <strong>for</strong> S and Cl (90wt %) is divided by <strong>the</strong> average K release to obtain <strong>the</strong> factor x.The calculated values are summarized in Table 1.Table 1. Experimentally Determined K-Release Rates <strong>for</strong>Different Biomass <strong>Fuel</strong>s and <strong>the</strong> Resulting Factor xaverage K release(wt %)standard deviation(wt %)Articlefactorxhardwood chips 32.8 12.0 2.7s<strong>of</strong>twood chips 24.9 8.1 3.6waste wood 18.5 3.2 4.9bark 6.8 1.3 13.2A. donax 18.5 4.6 4.9straw 20.1 2.6 4.5maize residues 12.1 1.7 7.4grass pellets 13.5 1.3 6.7decanter and rapeseed8.6 1.6 10.5press cakeresidues <strong>of</strong> starchproduction10.8 2.5 8.4For biomass fuels <strong>for</strong> which <strong>the</strong> release behavior has not beeninvestigated thus far, <strong>the</strong> release can be determined with a labscalereactor experiment, such as, <strong>for</strong> instance, described insection 2.4. On <strong>the</strong> basis <strong>of</strong> <strong>the</strong> results <strong>of</strong> such an experiment, ameaningful assumption <strong>for</strong> <strong>the</strong> K release can be made and, thus,<strong>the</strong> factor x can be calculated.The estimated values from Table 1 can be used <strong>for</strong> <strong>the</strong>calculation <strong>of</strong> <strong>the</strong> index (K + Na)/[x(2S + Cl)]. Figure 9 shows<strong>the</strong> correlation <strong>of</strong> <strong>the</strong> molar (K + Na)/[x(2S + Cl)] ratio versus<strong>the</strong> SO x emissions and <strong>the</strong> conversion <strong>of</strong> fuel S to S in SO x .From Figure 9, it can be seen that, with a decreasing molar(K + Na)/[x(2S + Cl)] ratio, SO x emissions are increasing.The SO x emissions <strong>of</strong> <strong>the</strong> different fuels can be categorizedinto (1) a low SO x emission range (500 mg <strong>of</strong> SO xN −1 m −3 , with dry flue gas, at 13 vol % O 2 ), e.g., grass pellets, amixture <strong>of</strong> decanter and rapeseed press cake, and residues <strong>of</strong>starch production with high S content.In <strong>the</strong> second diagram <strong>of</strong> Figure 9, <strong>the</strong> molar (K + Na)/[x(2S + Cl)] ratio is plotted against <strong>the</strong> conversion <strong>of</strong> fuel S toSinSO x . The same trend <strong>of</strong> <strong>the</strong> molar (K + Na)/[x(2S + Cl)]ratio and <strong>the</strong> conversion <strong>of</strong> fuel S to SO x can be observed. SO xemissions are negligible <strong>for</strong> a fuel molar (K + Na)/[x(2S + Cl)]ratio bigger or close to 0.5. This index is suitable to estimate <strong>the</strong>SO x emission range to be expected.Figure 10 shows <strong>the</strong> correlation <strong>of</strong> <strong>the</strong> molar (K + Na)/[x(2S + Cl)] ratio versus HCl emissions and <strong>the</strong> conversion <strong>of</strong>fuel Cl to Cl in HCl.No clear correlation between <strong>the</strong> molar (K + Na)/[x(2S +Cl)] ratio and <strong>the</strong> HCl emissions can be seen. For a molar ratio<strong>of</strong> (K + Na)/[x(2S + Cl)] < 0.5, <strong>the</strong> HCl emissions are variedfrom 0 to 110 mg N −1 m −3 , with dry flue gas, at 13 vol % O 2 .The reason <strong>for</strong> this strong scattering in comparison to S is notyet understood. Fur<strong>the</strong>r investigations are needed. In our case,it can be seen from Figure 10 that, with a molar ratio <strong>of</strong> (K +Hdx.doi.org/10.1021/ef201282y | Energy <strong>Fuel</strong>s XXXX, XXX, XXX−XXX
Energy & <strong>Fuel</strong>sArticleFigure 9. Molar (K + Na)/[x(2S + Cl)] ratio versus SO x emissions and <strong>the</strong> conversion <strong>of</strong> fuel S to SO x . Explanation: both correlations arestatistically significant (p < 0.05).Na)/[x(2S + Cl)] bigger or close to 0.5, <strong>the</strong> HCl emissions arevery low. There<strong>for</strong>e, this index can also be used to make a firstestimation <strong>of</strong> <strong>the</strong> gaseous HCl emissions to be expected.When using this index, it has to be noted that <strong>the</strong> factor x isbased on first estimations regarding <strong>the</strong> release <strong>of</strong> K and Na.Fur<strong>the</strong>r investigations are recommended to ensure <strong>the</strong> alkalimetal release described.4.9. Indicators <strong>for</strong> Ash-Melting Problems. It isgenerally well known that Ca and Mg increases <strong>the</strong> ash-meltingtemperature, while Si in combination with K decreases <strong>the</strong> ashmeltingtemperature. 9,27,28 The molar Si/(Ca + Mg) ratio 9 can<strong>the</strong>re<strong>for</strong>e provide first in<strong>for</strong>mation about ash-melting tendenciesin ash systems dominated by Si, Ca, Mg, and K. However,<strong>for</strong> P-rich systems (e.g., grass pellets), this correlation is notvalid (see Figure 11).As seen in Figure 11, <strong>the</strong> ash-sintering temperature dropsbelow 1100 °C as soon as <strong>the</strong> Si/(Ca + Mg) ratio exceeds 1. Itcan also be seen that <strong>the</strong>re is a linear correlation <strong>of</strong> <strong>the</strong> molarSi/(Ca + Mg) ratio with <strong>the</strong> ash-sintering temperature, except<strong>for</strong> grass pellets that show a low ash-sintering temperaturebecause <strong>of</strong> <strong>the</strong> high P concentration.From <strong>the</strong> ternary-phase diagrams <strong>for</strong> CaO−K 2 O−P 2 O 5 andMgO−K 2 O−P 2 O 5 , 23 it can be derived that, at constant K 2 O/P 2 O 5 ratios, <strong>the</strong> melting point increases with increasing CaOand MgO concentrations. It can be concluded that CaO andMgO increase <strong>the</strong> ash-sintering temperature, whereas K 2 O andP 2 O 5 decrease <strong>the</strong> sintering temperature. In combination withSi, a modified index (Si + P + K)/(Ca + Mg) can be introduced(see Figure 12). With this index, also <strong>for</strong> P-rich fuels, aprediction regarding <strong>the</strong> ash-melting behavior is possible. Thereis a linear correlation given between <strong>the</strong> molar (Si +P+K)/(Ca + Mg) ratio and <strong>the</strong> ash-sintering temperature.5. SUMMARY AND CONCLUSIONThe application <strong>of</strong> fuel indexes as a characterization toolprovides a good basis <strong>for</strong> a quick pre-evaluation <strong>of</strong> combustionrelatedproblems that may arise. This new and advanced fuelcharacterization method can <strong>the</strong>re<strong>for</strong>e be applied to supportdecision making concerning <strong>the</strong> application <strong>of</strong> new biomassfuels or fuel blends in existing combustion plants, as well as <strong>for</strong><strong>the</strong> preliminary design and engineering <strong>of</strong> new combustionplants, which should be tailored to <strong>the</strong> needs <strong>of</strong> a specific fuelor fuel mixture. During this first decision phase regarding <strong>the</strong>applicability <strong>of</strong> a certain fuel, time-consuming and expensivecombustion tests can <strong>the</strong>re<strong>for</strong>e be saved.The investigation <strong>of</strong> <strong>the</strong> fuel indexes has been per<strong>for</strong>med <strong>for</strong>a broad spectrum <strong>of</strong> biomass fuels ranging from different types<strong>of</strong> wood to herbaceous and agricultural biomass, as well asindustrial biomass residues. The data <strong>for</strong> <strong>the</strong> investigation arebased on test runs from fixed-bed lab-, pilot-, and real-scalecombustion systems, and <strong>the</strong>re<strong>for</strong>e, <strong>the</strong> indexes derived in thiswork are applicable <strong>for</strong> grate combustion plants.<strong>Fuel</strong> indexes, which allow <strong>for</strong> accurate qualitative predictions,are <strong>the</strong> N content, <strong>the</strong> molar 2S/Cl ratio, and <strong>the</strong> molar ratio <strong>of</strong>(Si + P + K)/(Ca + Mg). <strong>Indexes</strong> that can be applied withsome restrictions regarding o<strong>the</strong>r constraints are <strong>the</strong> sum <strong>of</strong> K,Na, Zn, and Pb and <strong>the</strong> molar ratios <strong>of</strong> (K + Na)/[x(2S + Cl)])and Si/(Ca + Mg).The N content generally determines <strong>the</strong> potential <strong>for</strong> NO xemission <strong>for</strong>mation. A correlation between <strong>the</strong> conversion ratesIdx.doi.org/10.1021/ef201282y | Energy <strong>Fuel</strong>s XXXX, XXX, XXX−XXX
Energy & <strong>Fuel</strong>sArticleFigure 10. Molar (K + Na)/[x(2S + Cl)] ratio versus HCl emissions and <strong>the</strong> conversion <strong>of</strong> fuel Cl to HCl. Explanation: both correlations are notstatistically significant.Figure 11. Molar Si/(Ca + Mg) ratio versus ash-sintering temperature<strong>for</strong> different biomass fuels. Explanation: if grass pellets are excluded,<strong>the</strong> correlation is statistically significant (p < 0.05); ash-sinteringtemperature according to prCEN/TS 15370-1.<strong>of</strong> fuel N to NO x emissions has been derived, showing anonlinear correlation <strong>of</strong> <strong>the</strong> NO x emissions with rising fuel Ncontent. When this correlation is applied, a first estimation <strong>of</strong><strong>the</strong> NO x emissions can be made. During combustion, easilyvolatile and semi-volatile elements (K, Na, S, Cl, Zn, and Pb)are partly released from <strong>the</strong> fuel to <strong>the</strong> gas phase, where <strong>the</strong>yundergo chemical reactions and finally contribute to problemsconcerning emissions, deposit <strong>for</strong>mation, and corrosion. With adecreasing molar 2S/Cl ratio, <strong>for</strong> instance, <strong>the</strong> amount <strong>of</strong>alkaline chlorides in ash deposits on heat-exchanger surfacesincreases. According to <strong>the</strong> literature, 25 a molar ratio <strong>of</strong> 2S/Cl 0.5, it is very likely that most S and Cl will be embedded in <strong>the</strong>ashes. The molar ratio <strong>of</strong> Si/(Ca + Mg) can provide firstin<strong>for</strong>mation about ash-melting tendencies in systems dominatedby Si, Ca, Mg, and K (decreasing melting temperatureswith an increasing value). The molar ratio <strong>of</strong> (Si + P + K)/(Ca+ Mg) is also valid <strong>for</strong> P-rich fuels and is <strong>the</strong>re<strong>for</strong>e an index thatcan generally be applied regarding <strong>the</strong> pre-evaluation <strong>of</strong> ashmeltingtendencies.Jdx.doi.org/10.1021/ef201282y | Energy <strong>Fuel</strong>s XXXX, XXX, XXX−XXX
Energy & <strong>Fuel</strong>sPresently, ongoing work is focusing on <strong>the</strong> fur<strong>the</strong>r improvement<strong>of</strong> existing fuel indexes. For <strong>the</strong> prediction <strong>of</strong> HCl andSO x emissions, a more detailed investigation <strong>of</strong> <strong>the</strong> K release to<strong>the</strong> gas phase and also possible Ca interactions is necessary. Toinvestigate <strong>the</strong> K release from biomass fuels in more detail,interactions <strong>of</strong> Si and P with K as well as <strong>the</strong> combustiontemperature need to be considered. However, more research on■this special issue is needed.AUTHOR INFORMATIONCorresponding Author*Telephone: +43-(0)-316-481300-73. Fax: +43-(0)-316-481300-4. E-mail: peter.sommersacher@bioenergy2020.eu.■ ACKNOWLEDGMENTSThis paper is <strong>the</strong> result <strong>of</strong> a project carried out in cooperationwith BIOENERGY 2020+ (a research center within <strong>the</strong>framework <strong>of</strong> <strong>the</strong> Austrian COMET program), which is fundedby <strong>the</strong> Republic <strong>of</strong> Austria as well as <strong>the</strong> federal provinces <strong>of</strong>Styria, Lower Austria, and Burgenland.■ REFERENCES(1) Gustavson, L.; Holmberg, J.; Dornburg, V.; Sathre, R.; Eggers, T.;Mahapatra, K.; Marland, G. Using biomass <strong>for</strong> climate changemitigation and oil use reduction. Energy Policy 2007, 35, 5671−5691.(2) McKendry, P. Energy production from biomass (Part 1):Overview <strong>of</strong> biomass. Bioresour. Technol. 2002, 83, 37−46.(3) Hoogwijk, M.; Faaij, A.; van den Broek, R.; Berndes, G.; Gielen,D.; Turkenburg, W. Exploration <strong>of</strong> <strong>the</strong> ranges <strong>of</strong> <strong>the</strong> global potential <strong>of</strong>biomass <strong>for</strong> energy. Biomass Bioenergy 2003, 25, 119−133.(4) Lewandowski, I.; Scurlock, J. M. O.; Lindvall, E; Christou, M.The development and current status <strong>of</strong> perennial rhizomatous grassesas energy crops in <strong>the</strong> U.S. and Europe. Biomass Bioenergy 2002, 25,335−361.(5) Chouchene, A.; Jeguirim, M.; Khiari, B; Zagrouba, F.; Trouvé, G.Thermal degradation <strong>of</strong> olive solid waste: Influence <strong>of</strong> particle size andoxygen concentration. Resour., Conserv. Recycl. 2010, 54, 271−277.(6) Bryers, R. W. Fireside slagging, fouling, and high-temperaturecorrosion <strong>of</strong> heat-transfer surfaces due to impurities in steam-raisingfuels. Prog. Energy Combust. Sci. 1996, 22, 29−120.(7) Visser, H. J. M. The Influence <strong>of</strong> <strong>Fuel</strong> Composition on AgglomerationBehaviour in Fluidised-Bed Combustion; Energy Research Centre <strong>of</strong> <strong>the</strong>Ne<strong>the</strong>rlands (ECN): Petten, The Ne<strong>the</strong>rlands, 2004; ECN-C-04-054.(8) Gilbe, C.; Öhman, M.; Lindström, E.; Boström, D.; Backman, R.;Samuelsson, R.; Burval, J. Slagging characteristics during residentialcombustion <strong>of</strong> biomass pellets. Energy <strong>Fuel</strong>s 2008, 22, 3536−3543.(9) Lindström, E.; Öhman, M.; Backman, R.; Boström, D. Influence<strong>of</strong> sand contamination on slag <strong>for</strong>mation during combustion <strong>of</strong> woodderived fuels. Energy <strong>Fuel</strong>s 2008, 22, 2216−2220.(10) Weissinger, A.; Fleckl, T.; Obernberger, I. Application <strong>of</strong> FT-IRin-situ absorption spectroscopy <strong>for</strong> <strong>the</strong> investigation <strong>of</strong> <strong>the</strong> release <strong>of</strong>gaseous compounds from biomass fuels in a laboratory scale reactorPart II: <strong>Evaluation</strong> <strong>of</strong> <strong>the</strong> N-release as functions <strong>of</strong> combustion specificparameters. Combust. Flame 2004, 137, 403−417.(11) Stubenberger, G.; Scharler, R.; Obernberger, I. Nitrogen releasebehaviour <strong>of</strong> different biomass fuels under lab-scale and pilot-scaleconditions. Proceedings <strong>of</strong> <strong>the</strong> 15th European Biomass Conference andExhibition; Berlin, Germany, May 7−11, 2007; ISBN: 978-88-89407-59-X, ISBN: 3-936338-21-3, pp 1412−14120.(12) Bärenthaler, G.; Zischka, M.; Hanraldsson, C.; Obernberger, I.Determination <strong>of</strong> major and minor ash-<strong>for</strong>ming elements in solidbi<strong>of</strong>uels. Biomass Bioenergy 2006, 983−997.(13) Keller, R. Primärmaßnahmen zur NO x -Minderung bei derHolzverbrennung mit dem Schwerpunkt der Luftstufung. Forschungsbericht18: Laboratory <strong>for</strong> Energy Systems; ETH Zürich: Zürich,Switzerland, 1994.KArticle(14) Glarborg, P.; Jensen, A. D.; Johnsson, J. E. <strong>Fuel</strong> nitrogenconversion in solid fuel fired systems. Prog. Energy Combust. Sci. 2003,29, 89−113.(15) Weissinger, A. Experimentelle Untersuchungen und reaktionskinetischeSimulationen zur NO x -Reduktion durch Primärmaßnahmenbei Biomasse-Rostfeuerungen. Ph.D. Thesis, Graz University <strong>of</strong>Technology, Graz, Austria, 2002(16) Brunner, T. Aerosols and coarse fly ashes in fixed-bed biomasscombustion. Ph.D. Thesis, Graz University <strong>of</strong> Technology, Graz,Austria, 2006.(17) Christensen, K. The <strong>for</strong>mation <strong>of</strong> submicron particles from <strong>the</strong>combustion <strong>of</strong> straw. Ph.D. Thesis, Department <strong>of</strong> ChemicalEngineering, Technical University <strong>of</strong> Denmark, Lyngby, Denmark,1995; ISBN: 87-90142-04-7.(18) Jöller, M. Modelling <strong>of</strong> aerosol <strong>for</strong>mation and behaviour infixed-bed biomass combustion systemsInfluencing aerosol <strong>for</strong>mationand behaviour in furnaces and boilers. Ph.D. Thesis, GrazUniversity <strong>of</strong> Technology, Graz, Austria, 2008.(19) Knudsen, J.; Jensen, P.; Dam-Johansen, K. Trans<strong>for</strong>mation andrelease to <strong>the</strong> gas phase <strong>of</strong> Cl, K, and S during combustion <strong>of</strong> annualbiomass. Energy <strong>Fuel</strong>s 2004, 18, 1385−1399.(20) Novaković, A.; Van Lith, S.; Frandsen, F.; Jensen, P.; Holgersen,L. Release <strong>of</strong> potassium from <strong>the</strong> systems K−Ca−Si and K−Ca−P.Energy <strong>Fuel</strong>s 2009, 23, 3423−3428.(21) Müller, M.; Wolf, K. J.; Smeda, A.; Hilpert, K. Release <strong>of</strong> K, Cland S species during co-combustion <strong>of</strong> coal and straw. Energy <strong>Fuel</strong>s2006, 20, 1444−1449.(22) Boström, D.; Broström, M.; Skoglund, N.; Boman, C.; Backman,R.; Öhman, M.; Grimm, A. Ash trans<strong>for</strong>mation chemistry duringenergy conversion <strong>of</strong> biomass. Proceedings <strong>of</strong> <strong>the</strong> Impact <strong>of</strong> <strong>Fuel</strong> Qualityon Power Production and Environment; Puchberg, Austria, Sept 23−27,2010; pp 1−20.(23) Sandström, M. Structural and solid state EMF studies <strong>of</strong> phasesin <strong>the</strong> CaO−K 2 O−P 2 O 5 system with relevance <strong>for</strong> biomasscombustion. Ph.D. Thesis, Luleå University <strong>of</strong> Technology, Luleå,Sweden, 2006; ETPC Report 06-06, ISSN: 1653-0551, ISBN: 91-7264-149-5.(24) Risnesa, H.; Fjellerupb, J.; Henriksenc, U.; Moilanend, A.;Norbye, P.; Papadakisb, K.; Posseltf, D.; Sorensenb, L. H. Calciumaddition in straw gasification. <strong>Fuel</strong> 2003, 82, 641−651.(25) Salmenoja, K. Field and laboratory studies on chlorine-inducedsuperheater corrosion in boilers fired with bi<strong>of</strong>uels. Ph.D. Thesis,Faculty <strong>of</strong> Chemical Engineering, Abo Akademi, Abo/Turku, Finland,2000.(26) Obernberger, I.; Brunner, T. Depositionen und Korrosion inBiomassefeuerungen. Tagungsband zum VDI-Seminar 430504 “Belägeund Korrosion in Großfeuerungsanlagen; Goẗtingen, Germany, 2004.(27) Öhman, M.; Boman, C.; Hedman, H.; Nordin, A.; Boström, D.Slagging tendencies <strong>of</strong> wood pellet ash during combustion inresidential pellet burners. Biomass Bioenergy 2003, 27, 585−596.(28) Baxter, L.; Miles, T.; Miles, T. Jr.; Jenkins, B.; Milne, T.; Dayton,D.; Bryers, R.; Oden, L. The behavior <strong>of</strong> inorganic material in biomassfiredpower boilers: Field and laboratory experiences. <strong>Fuel</strong> Process.Technol. 1998, 54, 47−78.dx.doi.org/10.1021/ef201282y | Energy <strong>Fuel</strong>s XXXX, XXX, XXX−XXX