Energy & <strong>Fuel</strong>sOn <strong>the</strong> basis <strong>of</strong> <strong>the</strong> results from pilot, real, and lab reactorcombustion tests with different biomass fuels, <strong>the</strong> release rates<strong>for</strong> K were calculated. The release was quantified by a massbalance based on weight measurements and chemical analysis<strong>of</strong> <strong>the</strong> fuel and ash obtained. The <strong>for</strong>mula <strong>of</strong> <strong>the</strong> release rate <strong>for</strong>pilot- and real-scale combustion tests is shown in eq 1, and <strong>the</strong><strong>for</strong>mula <strong>of</strong> <strong>the</strong> release rate <strong>for</strong> lab-scale combustion tests isshown in eq 2.The incoming mass flow <strong>of</strong> fuel is m fuel(db) . The mass flow thatis not released to <strong>the</strong> gas phase is <strong>the</strong> sum <strong>of</strong> <strong>the</strong> remaining ashfraction on <strong>the</strong> grate m bottom ash(db) (kg/h, db) and <strong>the</strong> mass <strong>of</strong>entrained particles from <strong>the</strong> fuel bed. The mass flows (kg/h,db) that are entrained from <strong>the</strong> fuel bed and separated in <strong>the</strong>boiler are m furnace ash(db) and m boiler ash(db) . The chemicalcomposition <strong>of</strong> <strong>the</strong> fuel is c K,fuel(db) (mg/kg, db), and <strong>the</strong>chemical composition <strong>for</strong> <strong>the</strong> ash sample is c K,bottom ash(db) .Itisassumed that <strong>the</strong> entrained ash particles [m furnace ash(db) andm boiler ash(db) ] have <strong>the</strong> same composition as <strong>the</strong> bottom ash.This <strong>of</strong> course neglects <strong>the</strong> mass <strong>of</strong> ash-<strong>for</strong>ming vapors, whichend up on <strong>the</strong> surface <strong>of</strong> coarse fly ash particles (e.g., bycondensation or surface reactions) in <strong>the</strong> boiler (e.g., K 2 SO 4and KCl). However, <strong>the</strong>se processes have only a minorinfluence on <strong>the</strong> total mass <strong>of</strong> entrained particles.In equation (2) m input(db) is <strong>the</strong> mass (g, db) <strong>of</strong> <strong>the</strong> sample fedto <strong>the</strong> reactor, c K,input(db) is <strong>the</strong> concentration <strong>of</strong> K in <strong>the</strong> fuel(mg/kg, db), m output(db) is <strong>the</strong> mass (g, db) <strong>of</strong> <strong>the</strong> ash residualafter <strong>the</strong> experiment in <strong>the</strong> reactor and c K,output(db) is <strong>the</strong>concentration <strong>of</strong> K in <strong>the</strong> ash residual (mg/kg, db). The mass<strong>of</strong> entrained fly ash particle is negligible because <strong>of</strong> <strong>the</strong> muchlower air velocities in <strong>the</strong> fuel bed compared to pilot- or realscaleapplications.The determined release rates are shown in Figure 8.Figure 8. K release <strong>for</strong> different biomass fuels during combustion.(1)(2)It can be assumed that Na shows a comparable releasebehavior to <strong>the</strong> gas phase as K. There<strong>for</strong>e, <strong>the</strong> values <strong>of</strong> Krelease can be used <strong>for</strong> calculating <strong>the</strong> factor x <strong>of</strong> <strong>the</strong> molar (K+ Na)/[x(2S + Cl)] ratio. An averaged release <strong>for</strong> S and Cl (90wt %) is divided by <strong>the</strong> average K release to obtain <strong>the</strong> factor x.The calculated values are summarized in Table 1.Table 1. Experimentally Determined K-Release Rates <strong>for</strong>Different Biomass <strong>Fuel</strong>s and <strong>the</strong> Resulting Factor xaverage K release(wt %)standard deviation(wt %)Articlefactorxhardwood chips 32.8 12.0 2.7s<strong>of</strong>twood chips 24.9 8.1 3.6waste wood 18.5 3.2 4.9bark 6.8 1.3 13.2A. donax 18.5 4.6 4.9straw 20.1 2.6 4.5maize residues 12.1 1.7 7.4grass pellets 13.5 1.3 6.7decanter and rapeseed8.6 1.6 10.5press cakeresidues <strong>of</strong> starchproduction10.8 2.5 8.4For biomass fuels <strong>for</strong> which <strong>the</strong> release behavior has not beeninvestigated thus far, <strong>the</strong> release can be determined with a labscalereactor experiment, such as, <strong>for</strong> instance, described insection 2.4. On <strong>the</strong> basis <strong>of</strong> <strong>the</strong> results <strong>of</strong> such an experiment, ameaningful assumption <strong>for</strong> <strong>the</strong> K release can be made and, thus,<strong>the</strong> factor x can be calculated.The estimated values from Table 1 can be used <strong>for</strong> <strong>the</strong>calculation <strong>of</strong> <strong>the</strong> index (K + Na)/[x(2S + Cl)]. Figure 9 shows<strong>the</strong> correlation <strong>of</strong> <strong>the</strong> molar (K + Na)/[x(2S + Cl)] ratio versus<strong>the</strong> SO x emissions and <strong>the</strong> conversion <strong>of</strong> fuel S to S in SO x .From Figure 9, it can be seen that, with a decreasing molar(K + Na)/[x(2S + Cl)] ratio, SO x emissions are increasing.The SO x emissions <strong>of</strong> <strong>the</strong> different fuels can be categorizedinto (1) a low SO x emission range (500 mg <strong>of</strong> SO xN −1 m −3 , with dry flue gas, at 13 vol % O 2 ), e.g., grass pellets, amixture <strong>of</strong> decanter and rapeseed press cake, and residues <strong>of</strong>starch production with high S content.In <strong>the</strong> second diagram <strong>of</strong> Figure 9, <strong>the</strong> molar (K + Na)/[x(2S + Cl)] ratio is plotted against <strong>the</strong> conversion <strong>of</strong> fuel S toSinSO x . The same trend <strong>of</strong> <strong>the</strong> molar (K + Na)/[x(2S + Cl)]ratio and <strong>the</strong> conversion <strong>of</strong> fuel S to SO x can be observed. SO xemissions are negligible <strong>for</strong> a fuel molar (K + Na)/[x(2S + Cl)]ratio bigger or close to 0.5. This index is suitable to estimate <strong>the</strong>SO x emission range to be expected.Figure 10 shows <strong>the</strong> correlation <strong>of</strong> <strong>the</strong> molar (K + Na)/[x(2S + Cl)] ratio versus HCl emissions and <strong>the</strong> conversion <strong>of</strong>fuel Cl to Cl in HCl.No clear correlation between <strong>the</strong> molar (K + Na)/[x(2S +Cl)] ratio and <strong>the</strong> HCl emissions can be seen. For a molar ratio<strong>of</strong> (K + Na)/[x(2S + Cl)] < 0.5, <strong>the</strong> HCl emissions are variedfrom 0 to 110 mg N −1 m −3 , with dry flue gas, at 13 vol % O 2 .The reason <strong>for</strong> this strong scattering in comparison to S is notyet understood. Fur<strong>the</strong>r investigations are needed. In our case,it can be seen from Figure 10 that, with a molar ratio <strong>of</strong> (K +Hdx.doi.org/10.1021/ef201282y | Energy <strong>Fuel</strong>s XXXX, XXX, XXX−XXX
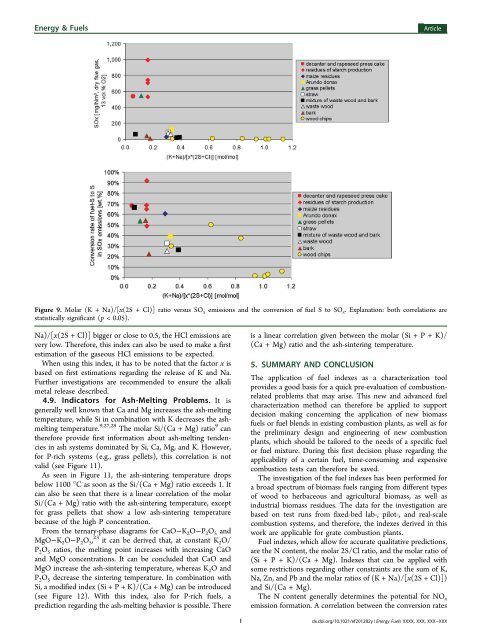
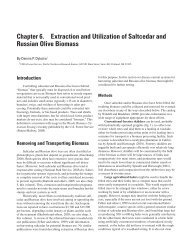
Energy & <strong>Fuel</strong>sArticleFigure 9. Molar (K + Na)/[x(2S + Cl)] ratio versus SO x emissions and <strong>the</strong> conversion <strong>of</strong> fuel S to SO x . Explanation: both correlations arestatistically significant (p < 0.05).Na)/[x(2S + Cl)] bigger or close to 0.5, <strong>the</strong> HCl emissions arevery low. There<strong>for</strong>e, this index can also be used to make a firstestimation <strong>of</strong> <strong>the</strong> gaseous HCl emissions to be expected.When using this index, it has to be noted that <strong>the</strong> factor x isbased on first estimations regarding <strong>the</strong> release <strong>of</strong> K and Na.Fur<strong>the</strong>r investigations are recommended to ensure <strong>the</strong> alkalimetal release described.4.9. Indicators <strong>for</strong> Ash-Melting Problems. It isgenerally well known that Ca and Mg increases <strong>the</strong> ash-meltingtemperature, while Si in combination with K decreases <strong>the</strong> ashmeltingtemperature. 9,27,28 The molar Si/(Ca + Mg) ratio 9 can<strong>the</strong>re<strong>for</strong>e provide first in<strong>for</strong>mation about ash-melting tendenciesin ash systems dominated by Si, Ca, Mg, and K. However,<strong>for</strong> P-rich systems (e.g., grass pellets), this correlation is notvalid (see Figure 11).As seen in Figure 11, <strong>the</strong> ash-sintering temperature dropsbelow 1100 °C as soon as <strong>the</strong> Si/(Ca + Mg) ratio exceeds 1. Itcan also be seen that <strong>the</strong>re is a linear correlation <strong>of</strong> <strong>the</strong> molarSi/(Ca + Mg) ratio with <strong>the</strong> ash-sintering temperature, except<strong>for</strong> grass pellets that show a low ash-sintering temperaturebecause <strong>of</strong> <strong>the</strong> high P concentration.From <strong>the</strong> ternary-phase diagrams <strong>for</strong> CaO−K 2 O−P 2 O 5 andMgO−K 2 O−P 2 O 5 , 23 it can be derived that, at constant K 2 O/P 2 O 5 ratios, <strong>the</strong> melting point increases with increasing CaOand MgO concentrations. It can be concluded that CaO andMgO increase <strong>the</strong> ash-sintering temperature, whereas K 2 O andP 2 O 5 decrease <strong>the</strong> sintering temperature. In combination withSi, a modified index (Si + P + K)/(Ca + Mg) can be introduced(see Figure 12). With this index, also <strong>for</strong> P-rich fuels, aprediction regarding <strong>the</strong> ash-melting behavior is possible. Thereis a linear correlation given between <strong>the</strong> molar (Si +P+K)/(Ca + Mg) ratio and <strong>the</strong> ash-sintering temperature.5. SUMMARY AND CONCLUSIONThe application <strong>of</strong> fuel indexes as a characterization toolprovides a good basis <strong>for</strong> a quick pre-evaluation <strong>of</strong> combustionrelatedproblems that may arise. This new and advanced fuelcharacterization method can <strong>the</strong>re<strong>for</strong>e be applied to supportdecision making concerning <strong>the</strong> application <strong>of</strong> new biomassfuels or fuel blends in existing combustion plants, as well as <strong>for</strong><strong>the</strong> preliminary design and engineering <strong>of</strong> new combustionplants, which should be tailored to <strong>the</strong> needs <strong>of</strong> a specific fuelor fuel mixture. During this first decision phase regarding <strong>the</strong>applicability <strong>of</strong> a certain fuel, time-consuming and expensivecombustion tests can <strong>the</strong>re<strong>for</strong>e be saved.The investigation <strong>of</strong> <strong>the</strong> fuel indexes has been per<strong>for</strong>med <strong>for</strong>a broad spectrum <strong>of</strong> biomass fuels ranging from different types<strong>of</strong> wood to herbaceous and agricultural biomass, as well asindustrial biomass residues. The data <strong>for</strong> <strong>the</strong> investigation arebased on test runs from fixed-bed lab-, pilot-, and real-scalecombustion systems, and <strong>the</strong>re<strong>for</strong>e, <strong>the</strong> indexes derived in thiswork are applicable <strong>for</strong> grate combustion plants.<strong>Fuel</strong> indexes, which allow <strong>for</strong> accurate qualitative predictions,are <strong>the</strong> N content, <strong>the</strong> molar 2S/Cl ratio, and <strong>the</strong> molar ratio <strong>of</strong>(Si + P + K)/(Ca + Mg). <strong>Indexes</strong> that can be applied withsome restrictions regarding o<strong>the</strong>r constraints are <strong>the</strong> sum <strong>of</strong> K,Na, Zn, and Pb and <strong>the</strong> molar ratios <strong>of</strong> (K + Na)/[x(2S + Cl)])and Si/(Ca + Mg).The N content generally determines <strong>the</strong> potential <strong>for</strong> NO xemission <strong>for</strong>mation. A correlation between <strong>the</strong> conversion ratesIdx.doi.org/10.1021/ef201282y | Energy <strong>Fuel</strong>s XXXX, XXX, XXX−XXX