Reanalysis of the Kettleman Hills Landfill Slope Stability Failure
Reanalysis of the Kettleman Hills Landfill Slope Stability Failure
Reanalysis of the Kettleman Hills Landfill Slope Stability Failure
- No tags were found...

You also want an ePaper? Increase the reach of your titles
YUMPU automatically turns print PDFs into web optimized ePapers that Google loves.
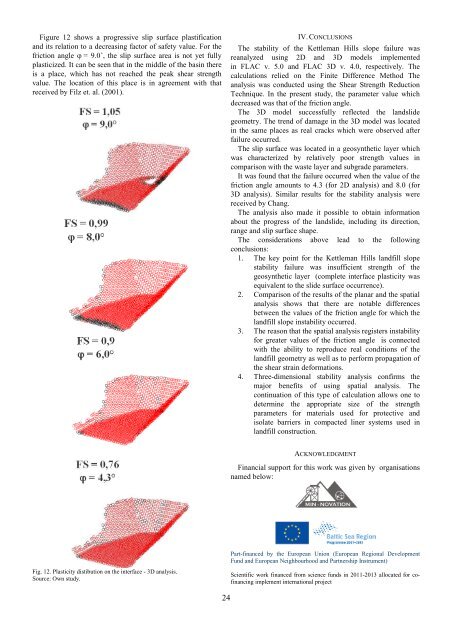
Figure 12 shows a progressive slip surface plastificationand its relation to a decreasing factor <strong>of</strong> safety value. For <strong>the</strong>friction angle ϕ = 9.0˚, <strong>the</strong> slip surface area is not yet fullyplasticized. It can be seen that in <strong>the</strong> middle <strong>of</strong> <strong>the</strong> basin <strong>the</strong>reis a place, which has not reached <strong>the</strong> peak shear strengthvalue. The location <strong>of</strong> this place is in agreement with thatreceived by Filz et. al. (2001).IV. CONCLUSIONSThe stability <strong>of</strong> <strong>the</strong> <strong>Kettleman</strong> <strong>Hills</strong> slope failure wasreanalyzed using 2D and 3D models implementedin FLAC v. 5.0 and FLAC 3D v. 4.0, respectively. Thecalculations relied on <strong>the</strong> Finite Difference Method Theanalysis was conducted using <strong>the</strong> Shear Strength ReductionTechnique. In <strong>the</strong> present study, <strong>the</strong> parameter value whichdecreased was that <strong>of</strong> <strong>the</strong> friction angle.The 3D model successfully reflected <strong>the</strong> landslidegeometry. The trend <strong>of</strong> damage in <strong>the</strong> 3D model was locatedin <strong>the</strong> same places as real cracks which were observed afterfailure occurred.The slip surface was located in a geosyn<strong>the</strong>tic layer whichwas characterized by relatively poor strength values incomparison with <strong>the</strong> waste layer and subgrade parameters.It was found that <strong>the</strong> failure occurred when <strong>the</strong> value <strong>of</strong> <strong>the</strong>friction angle amounts to 4.3 (for 2D analysis) and 8.0 (for3D analysis). Similar results for <strong>the</strong> stability analysis werereceived by Chang.The analysis also made it possible to obtain informationabout <strong>the</strong> progress <strong>of</strong> <strong>the</strong> landslide, including its direction,range and slip surface shape.The considerations above lead to <strong>the</strong> followingconclusions:1. The key point for <strong>the</strong> <strong>Kettleman</strong> <strong>Hills</strong> landfill slopestability failure was insufficient strength <strong>of</strong> <strong>the</strong>geosyn<strong>the</strong>tic layer (complete interface plasticity wasequivalent to <strong>the</strong> slide surface occurrence).2. Comparison <strong>of</strong> <strong>the</strong> results <strong>of</strong> <strong>the</strong> planar and <strong>the</strong> spatialanalysis shows that <strong>the</strong>re are notable differencesbetween <strong>the</strong> values <strong>of</strong> <strong>the</strong> friction angle for which <strong>the</strong>landfill slope instability occurred.3. The reason that <strong>the</strong> spatial analysis registers instabilityfor greater values <strong>of</strong> <strong>the</strong> friction angle is connectedwith <strong>the</strong> ability to reproduce real conditions <strong>of</strong> <strong>the</strong>landfill geometry as well as to perform propagation <strong>of</strong><strong>the</strong> shear strain deformations.4. Three-dimensional stability analysis confirms <strong>the</strong>major benefits <strong>of</strong> using spatial analysis. Thecontinuation <strong>of</strong> this type <strong>of</strong> calculation allows one todetermine <strong>the</strong> appropriate size <strong>of</strong> <strong>the</strong> strengthparameters for materials used for protective andisolate barriers in compacted liner systems used inlandfill construction.ACKNOWLEDGMENTFinancial support for this work was given by organisationsnamed below:Fig. 12. Plasticity distibution on <strong>the</strong> interface - 3D analysis.Source: Own study.Part-financed by <strong>the</strong> European Union (European Regional DevelopmentFund and European Neighbourhood and Partnership Instrument)Scientific work financed from science funds in 2011-2013 allocated for c<strong>of</strong>inancingimplement international project24