Technical Paper No 8 - Annual reports for the AAQ NEPM
Technical Paper No 8 - Annual reports for the AAQ NEPM
Technical Paper No 8 - Annual reports for the AAQ NEPM
- No tags were found...

You also want an ePaper? Increase the reach of your titles
YUMPU automatically turns print PDFs into web optimized ePapers that Google loves.
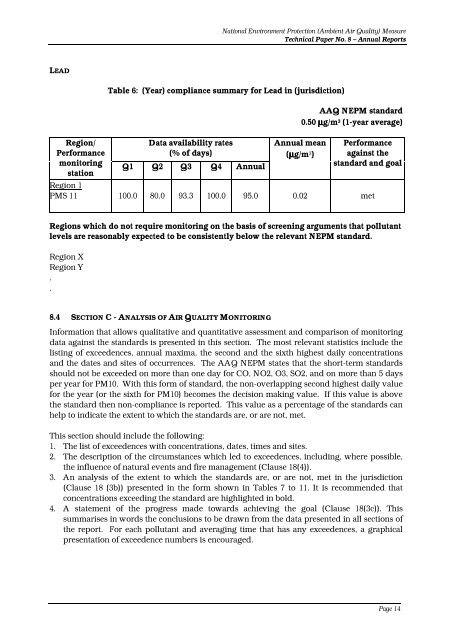
National Environment Protection (Ambient Air Quality) Measure<strong>Technical</strong> <strong>Paper</strong> <strong>No</strong>. 8 – <strong>Annual</strong> ReportsLEADRegion/Per<strong>for</strong>mancemonitoringstationTable 6: (Year) compliance summary <strong>for</strong> Lead in (jurisdiction)Data availability rates(% of days)Q1 Q2 Q3 Q4 <strong>Annual</strong><strong>AAQ</strong> <strong>NEPM</strong> standard0.50 µg/m 3 (1-year average)<strong>Annual</strong> mean(µg/m 3 )Per<strong>for</strong>manceagainst <strong>the</strong>standard and goalRegion 1PMS 11 100.0 80.0 93.3 100.0 95.0 0.02 metRegions which do not require monitoring on <strong>the</strong> basis of screening arguments that pollutantlevels are reasonably expected to be consistently below <strong>the</strong> relevant <strong>NEPM</strong> standard.Region XRegion Y..8.4 SECTION C - ANALYSIS OF AIR QUALITY MONITORINGIn<strong>for</strong>mation that allows qualitative and quantitative assessment and comparison of monitoringdata against <strong>the</strong> standards is presented in this section. The most relevant statistics include <strong>the</strong>listing of exceedences, annual maxima, <strong>the</strong> second and <strong>the</strong> sixth highest daily concentrationsand <strong>the</strong> dates and sites of occurrences. The <strong>AAQ</strong> <strong>NEPM</strong> states that <strong>the</strong> short-term standardsshould not be exceeded on more than one day <strong>for</strong> CO, NO2, O3, SO2, and on more than 5 daysper year <strong>for</strong> PM10. With this <strong>for</strong>m of standard, <strong>the</strong> non-overlapping second highest daily value<strong>for</strong> <strong>the</strong> year (or <strong>the</strong> sixth <strong>for</strong> PM10) becomes <strong>the</strong> decision making value. If this value is above<strong>the</strong> standard <strong>the</strong>n non-compliance is reported. This value as a percentage of <strong>the</strong> standards canhelp to indicate <strong>the</strong> extent to which <strong>the</strong> standards are, or are not, met.This section should include <strong>the</strong> following:1. The list of exceedences with concentrations, dates, times and sites.2. The description of <strong>the</strong> circumstances which led to exceedences, including, where possible,<strong>the</strong> influence of natural events and fire management (Clause 18(4)).3. An analysis of <strong>the</strong> extent to which <strong>the</strong> standards are, or are not, met in <strong>the</strong> jurisdiction(Clause 18 (3b)) presented in <strong>the</strong> <strong>for</strong>m shown in Tables 7 to 11. It is recommended thatconcentrations exceeding <strong>the</strong> standard are highlighted in bold.4. A statement of <strong>the</strong> progress made towards achieving <strong>the</strong> goal (Clause 18(3c)). Thissummarises in words <strong>the</strong> conclusions to be drawn from <strong>the</strong> data presented in all sections of<strong>the</strong> report. For each pollutant and averaging time that has any exceedences, a graphicalpresentation of exceedence numbers is encouraged.Page 14