Journal of Environmental Radioactivity - onPrincipleAlone
Journal of Environmental Radioactivity - onPrincipleAlone
Journal of Environmental Radioactivity - onPrincipleAlone
- No tags were found...

Create successful ePaper yourself
Turn your PDF publications into a flip-book with our unique Google optimized e-Paper software.
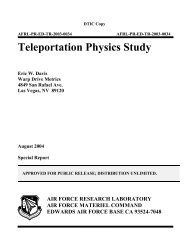
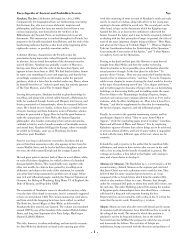
2G. Lujanien_e et al. / <strong>Journal</strong> <strong>of</strong> <strong>Environmental</strong> <strong>Radioactivity</strong> xxx (2012) 1e10Chernobyl accident on the environment and human health wereestimated as the worst in the nuclear accident history by its ratingto the highest level 7 on the INES scale. Until 12th March, 2011 thesecond largest accident was the Kyshtym accident which occurredon 29th September, 1957, when due to problems in a cooling systemand followed explosion about 7.4 10 5 TBq <strong>of</strong> radioactive materialswere released into the environment. As a result <strong>of</strong> this accident,more than 10,000 people received significant radiation doses (Huet al., 2010).The aim <strong>of</strong> the present study has been to estimate activityconcentrations <strong>of</strong> Fukushima airborne radioactive aerosols overLithuania with special emphasis on particle transport fromFukushima to Europe (preliminary results were published byLujanien_e et al., 2011), and to compare the obtained results withdata gathered during the investigations <strong>of</strong> the Chernobyl accident.2. Samples and methods2.1. SamplingThe ground level air samples were collected in a forested area onthe outskirts <strong>of</strong> Vilnius (54 42 0 N, 25 30 0 E). Perchlorvinyl filters FPP-15 (w1 m 2 surface) were exposed in a special building with blindwalls at the height <strong>of</strong> 1 m above the ground. High volume samplerswith flow rates from 2400 m 3 /h to about 6000 m 3 /h were used. Thesampling was carried out continuously. 131 I, 137 Cs and 134 Cs weremeasured by gamma-ray spectrometry using a HPGe detector(relative efficiency <strong>of</strong> 42%, resolution <strong>of</strong> 1.9 keV at 1.33Mev). Theprecision <strong>of</strong> 137 Cs measurements by gamma-spectrometry wasbetter than 7% at 2s level.The radiochemical analyses <strong>of</strong> Am and Pu were performed onmonthly samples (total volume w2.0 10 6 m 3 ) <strong>of</strong> aerosol ashes(about 30 g), which were dissolved in strong acids (HNO 3, HCl, HFand HClO 4 ). The TOPO/cyclohexane extraction and radiochemicalpurification using UTEVA, TRU and TEVA resins (100e150 mm) wereused for separation <strong>of</strong> Am and Pu isotopes. 242 Pu and 243 Am wereused as yield tracers in the separation procedure (Lujanien_e et al.,2006). The alpha-spectrometry measurements <strong>of</strong> Pu and Amisotopes deposited on stainless-steel discs were carried out withthe Alphaquattro (Silena) spectrometer. Accuracy and precision <strong>of</strong>analysis were tested using reference materials IAEA-135, NIST SRMNo 4350B and 4357, as well as in intercomparison exercises, organizedby the Risø National Laboratory (Denmark), and the NationalPhysical Laboratory (UK). The precision <strong>of</strong> Pu and Am measurementswas better than 8% and 10%, respectively (at 2s level).2.2. ModellingThe transport <strong>of</strong> radionuclides was simulated using a Lagrangianparticle model which calculates trajectories <strong>of</strong> particles that followthe instantaneous flow in the particle position (Závodský, 2011). Theoutput particle velocity is a sum <strong>of</strong> deterministic velocity and semirandomstochastic velocity, generated by the Monte Carlo technique.The probability density function for the random component,which simulates the atmospheric turbulence, is dependent on thestate <strong>of</strong> the atmospheric boundary layer. The model also takes intoaccount the radioactive decay <strong>of</strong> particles (e.g. in the case <strong>of</strong> 131 I), aswell as their scavenging by dry and wet deposition. For the meteorologicalinput, the Integrated Monitoring System e IMS ModelSuite Lagrangian dispersion model (MicroStep-MIS, 2011) has beenused. It calculates the spreading <strong>of</strong> radioactive materials withspecial regard to changes in atmospheric conditions, especiallychanges in wind direction. The meteorological input for thedispersion model was a time sequence analysis <strong>of</strong> atmospheric statein GRIB format (WMO, 2009). The GFS global weather model wasused in simulation time span from 12 March to 27 March, 2011. The3D wind (u, v, vertical velocity) at upper air model levels was neededto simulate dispersion due to large-scale winds.A characterization <strong>of</strong> radionuclide activities with respect tocategorized air mass backward trajectories was carried out forestimation <strong>of</strong> potential location <strong>of</strong> the radioactivity source. Air massbackward trajectories were generated using the Hybrid Single-Particle Lagrangian Integrated Trajectory (HYSPLIT4) model(Rolph, 2011) with the Final Analyses (FNL, year 2011) and theGlobal Data Assimilation System (GDAS) meteorological databasesat the NOAA Air Resources Laboratory server (Rolph, 2011).3. Results and discussion3.1. Modelling <strong>of</strong> the Fukushima plumeFor the assessment <strong>of</strong> contamination after the accident andprediction <strong>of</strong> radioactive particle transport the Lagrangian modellingwas applied. In order to describe the atmospheric processesrealistically, the vertical velocity, particle dissipation and turbulenceduring the particle trajectory were considered. A singlerelease <strong>of</strong> 10 15 Bq <strong>of</strong> 137 Cs, which occurred on March 12, 2011 fromdamaged Fukushima NPP was analyzed. The initial plume height, asa result <strong>of</strong> initial vertical velocity and buoyancy, was kept to be at2000e3000 m. The meteorological data and simulated trajectoriesrevealed that the arrival times <strong>of</strong> particles released on 11 March,2011 and 12 March, 2011 were different, and the particles weretransported at different altitudes. It was also obvious that the jetstream affected the transport <strong>of</strong> emitted particles at upper atmosphericlevels. Examples <strong>of</strong> the trajectories simulated using theLagrangian dispersion model show (Fig. 1) that the first signs <strong>of</strong>Fukushima released radionuclides could be detected in the Europeancountries (e.g. Island) on 20 March, 2011. The performedsimulation indicated that particles released on 11 March, 2011mainly appeared over Europe on 850 hPa on 13 April, 2011, at700 hPa on 30 March, 2011 and at 500 hPa on 20 March, 2011.Similar situation was observed for particles released on 12 March,2011 which arrived to Europe at 700 hPa on 1 April, 2011, at 500 hPaon 21 March, 2011, and the particles at 850 hPa did not reach theEuropean territory. The particle arriving times are in a reasonableagreement with experimental radionuclide data obtained for Vilnius(Lithuania), as discussed later.3.2. Radionuclide dataThe time course <strong>of</strong> 131 I (aerosol component) and 137 Cs concentrationsmeasured in MarcheApril <strong>of</strong> 2011 in Vilnius is shown inFig. 2, compared with the course <strong>of</strong> the cosmogenic 7 Be. The activityconcentrations <strong>of</strong> 131 I and 137 Cs ranged from 2 to 3800 mBq/m 3 andfrom 0.2 to 1070 mBq/m 3 , respectively. The first traces <strong>of</strong> 131 Iinaerosol filters in Vilnius were found on 23 March. A considerableincrease in the 131 I activity concentrations (up to about 2.4 mBq/m 3 ) was observed during the period <strong>of</strong> 28 Marche1 April. Thesecond maximum was detected on 3e4 April, when up to 3.7 mBq/m 3 <strong>of</strong> 131 I was measured in the atmosphere. Activities <strong>of</strong> 137 Cs inaerosol during this period increased up to 0.5 mBq/m 3 and 1.0 mBq/m 3 , respectively. In addition to 131 I and 137 Cs, traces <strong>of</strong> otherradionuclides were detected in the aerosol filters as well.Their concentrations in the most active sample collected on 3e4April 2011 14:00e06:50 UTC were: 132 I e 0.12 0.01 mBq/m 3 ,132 Te e 0.13 0.01 mBq/m 3 ,129 Te e 0.40 0.04 mBq/m 3 ,129m Tee0.75 0.25 mBq/m 3 and 136 Cs e 0.080 0.008 0 mBq/m 3 .The variations in the activity concentrations <strong>of</strong> studied radionuclidescan be due to the different arrival time <strong>of</strong> radioactiveparticles predicted by the Lagrangian modelling. The particlesPlease cite this article in press as: Lujanien_e, G., et al., Radionuclides from the Fukushima accident in the air over Lithuania: measurement andmodelling approaches, <strong>Journal</strong> <strong>of</strong> <strong>Environmental</strong> <strong>Radioactivity</strong> (2012), doi:10.1016/j.jenvrad.2011.12.004
G. Lujanien_e et al. / <strong>Journal</strong> <strong>of</strong> <strong>Environmental</strong> <strong>Radioactivity</strong> xxx (2012) 1e10 3Fig. 1. Particles spacing on 20 March, 2011 at 12:00 UTC (top) and on 27 March, 2011 at 18:00 UTC (bottom); shades <strong>of</strong> red indicate particles in the bottom layer, up to 3 km; black todark blue indicate the middle layer, up to 6 km height; and light blue indicates the upper layer; the trajectories were simulated using the Lagrangian dispersion model (time <strong>of</strong> theparticles release was on 12 March 2011). (For interpretation <strong>of</strong> the references to colour in this figure legend, the reader is referred to the web version <strong>of</strong> this article.)released on 11 March, 2011, and according to the prognosis theyshould appear over the Europe at 850 hPa on 13 April, 2011, werenot detected in Vilnius. The particles arriving at 700 hPa weredetected on 30 March, 2011, while the particles at 500 hPaappearing on 21 March, 2011, were detected in Vilnius on 22e23March. The particles released on 12 March, 2011 and which were137Cs,131I, µBqm350004500400035003000250020001500100050007 BeR=-0.07 (n-29)137CsR=-0.09 (n=29)131IR=-0.10 (n=29)Precipitation24 26 28 30 1 3 5 7 9 11 13March April 2011Fig. 2. Activity concentration <strong>of</strong> 131 I,137 Cs and 7 Be in aerosol samples as well asprecipitation amount in Vilnius in 2011.10864207 3Precipitation, mm; Be, mBq/mexpected over Europe at 700 hPa on 1 April, 2011 were not detectedat our sampling station, whereas a clear maximum in activityconcentrations <strong>of</strong> 131 I, 134 Cs and 137 Cs was observed on 4 April, 2011.The particles that were supposed to be over Europe at 500 hPa on24 March, 2011 were detected with one day delay on 25 March,2011. It seems therefore that the Fukushima plume which arrived toEurope at high altitudes did not necessarily reach the near-surfacelevel.On the other hand, meteorological conditions at the site(e.g. precipitation) could affect the activity concentrations. Theamount <strong>of</strong> precipitation given in Fig. 2 revealed that it could havea certain effect on changes in activity concentrations <strong>of</strong> studiedradionuclides. However, no correlation was found between the 131 I,137 Cs and 7 Be activity concentrations and the amount <strong>of</strong> precipitation(R ¼ 0.01, 0.09 and 0.07, respectively), indicating thatthe influence <strong>of</strong> precipitation was in general negligible. Nonetheless,from data shown in Fig. 2 it can be seen that the increase in 131 Iand 137 Cs activity concentrations was accompanied by the rise <strong>of</strong>7 Be activities. In addition, 131 I and 137 Cs activities well correlated(R ¼ 0.69 and R ¼ 0.75, respectively) with the activity concentration<strong>of</strong> 7 Be (Fig. 3).The cosmogenic 7 Be (half-life <strong>of</strong> 53.3 days) is mainly produced inthe lower stratosphere (w70%) and the rest in the upper troposphere.It has been widely used to study vertical air mass transportPlease cite this article in press as: Lujanien_e, G., et al., Radionuclides from the Fukushima accident in the air over Lithuania: measurement andmodelling approaches, <strong>Journal</strong> <strong>of</strong> <strong>Environmental</strong> <strong>Radioactivity</strong> (2012), doi:10.1016/j.jenvrad.2011.12.004
4G. Lujanien_e et al. / <strong>Journal</strong> <strong>of</strong> <strong>Environmental</strong> <strong>Radioactivity</strong> xxx (2012) 1e10137Cs, µBq/m3120010008006004002000131 IR = 0.69 (n= 29)0 2000 4000 6000 80007Be, µBq/m 3137 CsR = 0.75 (n=29)4000300020001000Fig. 3. 137 Cs and 131 I activity concentrations plotted against the 7 Be activity concentrationin aerosol samples collected during the Fukushima plume episode.(e.g. Lujanas and Lujanien_e, 2007). An increase in the 7 Be activityconcentrations in summer and autumn season was explained bya vertically downward transport within the troposphere (Kochet al., 1996) and by a stratosphere-troposphere exchange (Jordanet al., 2003; Land and Feichter, 2003). The high 7 Be activityconcentrations in the surface air were also interpreted by thedownward and upward atmospheric flows in the tropospherecaused by a pair <strong>of</strong> travelling anticyclone and extra tropical cyclonethat passes over Japan in spring and autumn with a period <strong>of</strong> a fewdays (Yoshimori, 2005). It was supposed that the air <strong>of</strong> lowtemperature flows downward from convergence in the Rossbywaves to divergence in the surface anticyclone, and the warm airmoves upward from convergence in the surface cyclone to divergencein the Rossby waves. In these studies an increase in theactivity concentrations in the near-surface atmosphere was associatedwith downward movements <strong>of</strong> air masses. Thus, the positivecorrelation between the anthropogenic radionuclides and 7 Be(Fig. 3) can be an indication <strong>of</strong> their arrival from the upper layers <strong>of</strong>the troposphere.On the other hand, short-lived radon decay products, such as theterrigenous 210 Pb, 212 Pb and 214 Pb can also be used as atmospherictracers to study air masses transport (Sheets and Lawrence, 1999).The main source <strong>of</strong> 212 Pb (half-life <strong>of</strong> 10.6 h) in the air is 220 Rn (halflife<strong>of</strong> 54 s) exhalation from the earth’s surface, therefore 212 Pbactivity concentrations reflect local conditions (at height <strong>of</strong> about1 km), contrary to 222 Rn (half-life <strong>of</strong> 3.82 d) progenies 214 Pb(half-life <strong>of</strong> 26.8 min) and 210 Pb (half-life <strong>of</strong> 22.3 y). The residencetimes <strong>of</strong> radon decay products in the ambient air were estimated tobe similar to that <strong>of</strong> 7 Be (about 8 days). About 76% <strong>of</strong> the 214 Pbactivity and 67% <strong>of</strong> the 212 Pb activity were usually associated withaerosol particles in the 0.08e1.4-mm size range, though a small shiftin the aerosol size distribution was observed for214 Pb(Papastefanou, 2009). Seasonal variations <strong>of</strong>212 Pb and 210 Pbisotopes were found to be distinctly different in the lower atmospherewhile the behaviour <strong>of</strong> 214 Pb was similar to that <strong>of</strong> 210 Pb. Itwas concluded therefore that airborne concentrations <strong>of</strong> 212 Pb,contrary to those <strong>of</strong> 210 Pb could be strongly influenced by localemissions (Sheets and Lawrence, 1999). This behavior and shift inthe size distribution can be attributed to the variation in half-lives<strong>of</strong> Pb isotopes and their parents. Both parents are gaseous speciesbut their different half-life under particular local conditions such asexhalation, mixing height and intensity can result in their variousvertical and horizontal transports.222 Rn <strong>of</strong> longer half-life hasa higher potential to be more widely distributed vertically andhorizontally. On the other hand, due to different half-lives <strong>of</strong> Pbisotopes, they can serve for indication <strong>of</strong> events occurring on0131I, µBq/m 3different time scales. Kownacka (2002) reported that activityconcentrations <strong>of</strong> 210 Pb were almost constantly distributed above1 km, and did not decrease with altitudes. An increase in 210 Pb andother natural radionuclide concentrations in the stratosphere wasalso observed after the large volcanic eruptions. Abe et al. (2010)showed that distributions <strong>of</strong> the 7 Be and 210 Pb nuclides wereuniform in the range <strong>of</strong> a few hundred kilometers in the horizontaldirection and up to w1 km height, whereas 212 Pb activity concentrationsvaried greatly depending on the geographical location andaltitude <strong>of</strong> the observation site. The recent studies indicateda similar behavior <strong>of</strong> 7 Be and 210 Pb, and that they cannot be used asindependent tracers to study atmospheric processes. Although thebehavior <strong>of</strong> 212 Pb and 214 Pb is not fully understood yet, they can beused as independent atmospheric traces. A weak correlation wasfound in 7 Be and 212 Pb records (0.39), while no correlation wasobserved for 7 Be and 214 Pb ( 0.16), indicating different sources <strong>of</strong>Pb isotopes. The 212 Pb and 214 Pb records may therefore indicatedifferent atmospheric processes. Most probably 212 Pb is an indicator<strong>of</strong> horizontal transport at lower heights (up to 1 km),however, a weak correlation showed that this transport waslimited. On the other hand, 214 Pb represents short time events atour site. An increase in the activity ratios <strong>of</strong> 7 Be/ 212 Pb and 7 Be/ 214 Pb,accompanied by an increase in 137 Cs and 131 I activity concentrationsobserved during the studied period may indicate that the dominantsource <strong>of</strong> Fukushima originated radionuclides at our site was athigher altitudes. Therefore, an increase in the 7 Be/ 212 Pb and7 Be/ 214 Pb activity ratios in this case can be used for an indication <strong>of</strong>the downward air mass transport.The activity concentration <strong>of</strong> 137 Cs as well as the 134 Cs/ 137 Cs,7 Be/ 212 Pb and 7 Be/ 214 Pb activity ratios in aerosol samples in thestudied episode after the Fukushima accident are presented inFig. 4. The 134 Cs/ 137 Cs activity ratio in Vilnius was close to 1 (N ¼ 30,Mean ¼ 0.782, S.D. ¼ 0.345, Median ¼ 0.938). In samples collectedon 24 March, and from 26 to 27 March, the activity concentration <strong>of</strong>134 Cs was below the detection limit. In the most active samplecollected on 3e4 April the 134 Cs/ 137 Cs activity ratio was equal to1.00 0.05.Fig. 5 shows the wind speed and wind vectors indicating the jetstream at 500 hPa for 24e25 March which affected the transport <strong>of</strong>the Fukushima plume to Europe. The strong meanders on the jetstream resulted in the downward air mass transport, as it is indicatedby an increase in the 7 Be activity concentrations (Fig. 2), aswell as by an increase in the activity ratios <strong>of</strong> 7 Be/ 212 Pb and7 Be/ 214 Pb (Fig. 4). A similar increase in the activity concentrations <strong>of</strong>131 I,137 Cs and 7 Be, together with enhanced activity ratios <strong>of</strong>7 Be/ 212 Pb and 7 Be/ 214 Pb observed on 23, 24, 27 and 31 March, as137Cs µBq/m310001001010.1137 Cs7 Be/ 212 Pb134Cs/ 137 Cs7 Be/ 214 Pb24 26 28 30 1 3 5 7 9 11 13March April 20111001010.10.01Fig. 4. Activity concentration <strong>of</strong> 137 Cs and 134 Cs/ 137 Cs, 7 Be/ 212 Pb and 7 Be/ 214 Pb activityratios in aerosol samples in Vilnius in 2011.Ratio <strong>of</strong> radionuclidesPlease cite this article in press as: Lujanien_e, G., et al., Radionuclides from the Fukushima accident in the air over Lithuania: measurement andmodelling approaches, <strong>Journal</strong> <strong>of</strong> <strong>Environmental</strong> <strong>Radioactivity</strong> (2012), doi:10.1016/j.jenvrad.2011.12.004
G. Lujanien_e et al. / <strong>Journal</strong> <strong>of</strong> <strong>Environmental</strong> <strong>Radioactivity</strong> xxx (2012) 1e10 5Fig. 5. The wind speed, wind vectors and relative humidity at 500 hPa for 24e25March and 3 April, 2011.well as on 4 April, can be interpreted as a downward transport <strong>of</strong> airmasses carrying the Fukushima plume radionuclides from higherlayers <strong>of</strong> the troposphere (Figs. 2 and 4). The low relative humidityover the sampling site (Fig. 5) observed at 500 hPa on 4 April canserve as an additional confirmation <strong>of</strong> air flow from the upper levels<strong>of</strong> the atmosphere.A slightly different pattern <strong>of</strong> the radionuclide record observedfrom 28 to 31 March can be explained by the effect <strong>of</strong> precipitation(Fig. 2) that could remove the Fukushima derived radionuclides and/or preferably wash out aerosol particles carrying cosmogenic 7 Bedue to their different chemical composition and size distribution(Lujanien_e et al., 1998; Lujanien_e, 2000, 2003). Another possibleexplanation can be variations <strong>of</strong> the transport altitudes and arrivaltime <strong>of</strong> the Fukushima radioactive particles. The NOAA HYSPLITmodel (Draxler and Rolph, 2011) was used to assess the transportpattern and to explain the deviation in radionuclide activityconcentrations found in Vilnius. A large number <strong>of</strong> air mass backwardtrajectories were calculated over the time <strong>of</strong> interest. The mosttypical trajectories, capable to provide a proper interpretation <strong>of</strong> theobserved radionuclide variations (Fig. 6), show backward air masstransport starting at 500 (red triangles), 3000 (blue squares), and7000 m (green circles) above the ground level (AGL). Trajectories arelabelled every 24 h by a filled symbol. The vertical projection <strong>of</strong> thetrajectories with time is shown in the panel below the map. The airmass backward trajectories calculated for 30 March can serve as anexample <strong>of</strong> complicated pathway <strong>of</strong> air masses (Fig. 6A). The backwardtrajectories were calculated for three 500, 3000 and 5000 mAGL for 315 h. The air masses at 500 m were caught up into a cyclonicsystem, while air masses at 3000 and 5000 m were lifted and rapidlytransported over the North America to Europe. It seems thatradioactive particles have had a greater chance <strong>of</strong> being transportedat higher atmosphere levels. They can be removed in the lower layer<strong>of</strong> the atmosphere due to various reasons, e.g. rainfall characteristics,fog formation or growth <strong>of</strong> aerosol particles and their deposition.Thus, there was a higher probability that activityconcentrations <strong>of</strong> radionuclides found on 28e31 March werediluted by clean air masses, and/or they were reduced by precipitationin the near-surface level and/or marine boundary layer(w1 km) during their long-range transport from Japan.The air masses which arrived on 1e2 April were affected both bycyclone and anticyclone systems, and they brought rather clean airto Europe (Fig. 6B). During these days the activity concentrations <strong>of</strong>131 I and 137 Cs dropped to 150e190 mBq/m 3 and 8e16 mBq/m 3 ,respectively (Fig. 2), however, on 4 April they again rose up to2280e3690 mBq/m 3 and 609e1026 mBq/m 3 , respectively. It shouldbe noted that an increase in radionuclide activities was detected inthe most European countries (Masson et al., 2011).In order to explain the origin <strong>of</strong> the second maximum in theradionuclide courses (Fig. 2), the air mass backward trajectorieswere calculated for 1000, 3000 and 5000 m heights. The resultsshowed (i) a direct transfer from Fukushima across the PacificOcean, (ii) a transport through the North Pole, and (iii) a pathwaythrough the Greenland and Iceland (Fig. 6. C). The air masses at1000 and 5000 m were rapidly transported, while the air masses at3000 m exhibited rather slow transport, and most probably theseair masses provided a transfer <strong>of</strong> contaminated air already presentover the Greenland. These results are in good agreement with theprognoses made by the CTBTO (Wotawa, 2011) explaining twomaxima <strong>of</strong> the Fukushima plume observed over Europe.We can conclude that the measured activity concentrations at thesite <strong>of</strong> investigation resulted from a complicated air mass transport,arrival time, arrival height, meteorology and downward air masstransport. The downward transport was found to be an importantfactor affecting activity concentrations in the surface air. Higheractivities can be transported over long distances at higher altitudesPlease cite this article in press as: Lujanien_e, G., et al., Radionuclides from the Fukushima accident in the air over Lithuania: measurement andmodelling approaches, <strong>Journal</strong> <strong>of</strong> <strong>Environmental</strong> <strong>Radioactivity</strong> (2012), doi:10.1016/j.jenvrad.2011.12.004
6G. Lujanien_e et al. / <strong>Journal</strong> <strong>of</strong> <strong>Environmental</strong> <strong>Radioactivity</strong> xxx (2012) 1e10Fig. 6. Backward trajectories <strong>of</strong> air masses transport ending on 30 March, 1 April and 4 April, 2011 in Vilnius.Please cite this article in press as: Lujanien_e, G., et al., Radionuclides from the Fukushima accident in the air over Lithuania: measurement andmodelling approaches, <strong>Journal</strong> <strong>of</strong> <strong>Environmental</strong> <strong>Radioactivity</strong> (2012), doi:10.1016/j.jenvrad.2011.12.004
G. Lujanien_e et al. / <strong>Journal</strong> <strong>of</strong> <strong>Environmental</strong> <strong>Radioactivity</strong> xxx (2012) 1e10 7Activity concentration, mBq/m 3100001000100101131 I137 Cs103Ru29 1 4 7 10 13 16 25 1 4AprilMay June 1986Fig. 7. Activity concentrations <strong>of</strong> 131 I, 137 Cs, 103 Ru in aerosol samples in Vilnius in 1986.with higher probability, due to the precipitation effect and rathershort residence time <strong>of</strong> water soluble aerosols in the boundary layer.3.3. Comparison with the Chernobyl accidentThe consequences <strong>of</strong> the Fukushima accident were estimated tobe close to the Chernobyl accident according to the given level 7 onthe INES scale (IAEA, 2011). The long-term radiological impact <strong>of</strong> theChernobyl accident on the environment and humans due to releasedradioactivity, migration, resuspension <strong>of</strong> deposited radionuclideshas been studied over 20 years. During the accident, and the postChernobyl period, many measurements <strong>of</strong> gamma, beta and alphaemittersin aerosol samples were carried out in Vilnius (Lujanaset al., 1994; Lujanien_e et al., 1997, 1999, 2009). A wide spectrum <strong>of</strong>radionuclides and “hot particles” were detected in Vilnius followingthe Chernobyl accident, when activity concentrations were therehigher by 4 orders <strong>of</strong> magnitude as compared to the Fukushimaaccident. The maximum activities in Vilnius during the first weekafter the Chernobyl accident were 45.2 Bq/m 3 for 131 I (aerosolfraction) and 27.9 Bq/m 3 for 137 Cs. The 132 Te and 103 Ru activityconcentrations in AprileMay,1986 ranged from 0.1 Bq/m 3 to 51.0 Bq/m 3 and from 0.1 Bq/m 3 to 20.3 Bq/m 3 , respectively (Fig. 7).In the Chernobyl plume Zr, Nb, Ru and Ce isotopes were detectedin the air as well. In addition, the presence <strong>of</strong> “hot particles” <strong>of</strong>0.37e22.2 mm in size carrying beta-emitters, and “hot particles” <strong>of</strong>0.7e2 mm containing alpha-emitters ( 233 U, 234 U, 235 U, 238 Pu, 239 Pu,240 Pu, 241 Am, 242 Cm, 244 Cm) in 1986 were also found in aerosolfilters collected in Vilnius. The activity ratio <strong>of</strong> 238 Pu/ 239,240 Puvaried from 0.44 to 0.5 and the atom ratio <strong>of</strong> 240 Pu/ 239 Pu rangedfrom 0.41 to 0.42. The high activities detected in Vilnius after theChernobyl accident were explained by quite close location(480 km) <strong>of</strong> the site.Furthermore, the Chernobyl accident resulted in contamination<strong>of</strong> large areas <strong>of</strong> the Earth’s surface in Europe including six millionha <strong>of</strong> forested land <strong>of</strong> the Ukraine, Belarus and Russia (De Cort et al.,1998). The 137 Cs surface deposition (Fig. 8) exceeded 1480 kBq/m 2(0.03% <strong>of</strong> the European territory). The prediction <strong>of</strong> 137 Cs surfacedeposition after the Fukushima accident was made usinga numerical atmospheric chemistry/transport model Polyphemus/Polair3D, and compared with contamination <strong>of</strong> Europe after theChernobyl accident (Winiarek et al., 2011). The results indicatedobvious differences in the consequences <strong>of</strong> the Chernobyl andFukushima accidents, especially at the level <strong>of</strong> highly contaminatedterritories. However, a contamination <strong>of</strong> the marine environmentand a deposition to the bottom sediments were not taken intoaccount in this model. It is expected that the main radiologicalproblems will arise from contaminated seafood, while the atmosphericdeposition will again trigger discussions on the impact <strong>of</strong>low-level radiation doses on the public.Areas with high Chernobyl 137 Cs ground depositions locatedclose to Lithuania have been a source <strong>of</strong> the secondary contaminationdue to the forest fires and soil resuspension for a long time(Lujanien_e et al., 2009). The transport <strong>of</strong> aerosol particles, whichderived from resuspension and/or forest fires in 1997e2001 and2005e2006 was modelled using the HYSPLIT. The backwardtrajectories were calculated for 4 selected sectors for 72 h at theheights <strong>of</strong> 20, 500 and 1000 m AGL (Fig. 8). However, not allcalculated trajectories were possible to assign to a particular sector.Very complicated trajectories that did not match any sector wereassociated with sector 0.In both studied periods a weak correlation between the 137 Csactivity concentration and height (R ¼ 0.28 (20 m), 0.32 (500 m),and 0.31 (1000 m) in 1997e2001; and for 2005e2006 R ¼ 0.41(20 m), 0.49 (500 m), and 0.49 (1000 m)) was found for the Chernobylsector, while for other sectors no correlation was observed. Adissimilar behaviour <strong>of</strong> Pu isotopes was explained by their differentvolatility as compared to Cs ones. This is again in good agreementwith results obtained in 2005e2006 (Fig. 9) where 239,240 Puactivities ranged from 2 to 49 nBq/m 3 , with maxima observed inMay (29 and 49 nBq/m 3 , respectively), and they obviously derivedfrom soil resuspension. The 241 Am activity concentrations variedfrom 1 to 25 nBq/m 3 and the highest values were also detected inMay. Variations in the 241 Am/ 239,240 Pu activity ratios from 0.27 to0.65 were found in the analyzed samples with the average value<strong>of</strong> 0.44.The 238 Pu/ 239,240 Pu activity ratios in aerosol samples collected inVilnius during the Chernobyl accident were in the range 0.44e0.50,while the 240 Pu/ 239 Pu atom ratios in the same samples ranged from0.41 to 0.42. The 240 Pu/ 239 Pu atom ratios in monthly samples inVilnius in 1995e2003 varied from 0.14 to 0.40, whereas in samplescollected during forest fires the ratio was between 0.19 and 0.23. Inaddition, an exponential decrease in the 240 Pu/ 239 Pu atom rati<strong>of</strong>rom 0.30 to 0.19 (mean values) was observed during 1995e2003.The characteristic 238 Pu/ 239,240 Pu activity ratio <strong>of</strong> global fallout is0.03, while that <strong>of</strong> the Chernobyl accident is 0.45 (Livingston andPovinec, 2002). The enhanced activity ratios <strong>of</strong> 238 Pu/ 239,240 Pu(from 1 to 3) have been measured in environmental samplesderived from industrial nuclear effluents. The highest ratio <strong>of</strong>238 Pu/ 239,240 Pu ¼ 25.3 was reported in October 1982 and wasattributed to discharges from the reprocessing plants at La Hagueand Sellafield (Martin and Thomas, 1988).In order to check the presence <strong>of</strong> Pu isotopes in samplescollected after the Fukushima accident between 23 March and 15April, 2011 (N ¼ 30, sampling air volume <strong>of</strong> w2 10 6 ) all sampleswere combined together to form one sample and Pu isotopes wereseparated and measured by means <strong>of</strong> alfa-spectrometry (Fig. 10).The activity concentration <strong>of</strong> 239,240 Pu in this integrated sample wasfound to be 44.5 2.5 nBq/m 3 , very close to the value measured inMay, 2005 (Fig. 9), and higher than the activity measured inAprileMay, 2006. The values measured in March, 2006(12.0 0.6 nBq/m 3 ) and May, 2006 (29.2 1.5 nBq/m 3 ) could servetherefore as reference data for comparison. From the spectrumshown in Fig. 10 it can be seen that the activity <strong>of</strong> 238 Pu is higherthan that <strong>of</strong> 239,240 Pu (by a factor <strong>of</strong> 1.2).The 238 Pu/ 239,240 Pu activity ratios in aerosol samples observed inMay 1986 at Tsukuba, Japan ranged from 0.04 to 0.33. The aerodynamicdiameter <strong>of</strong> particles carrying the Chernobyl derivedplutonium was estimated to be <strong>of</strong> 1.1e7 mm and the mean monthly239,240 Pu activity concentration increased only by 0.03 mBq m 3Please cite this article in press as: Lujanien_e, G., et al., Radionuclides from the Fukushima accident in the air over Lithuania: measurement andmodelling approaches, <strong>Journal</strong> <strong>of</strong> <strong>Environmental</strong> <strong>Radioactivity</strong> (2012), doi:10.1016/j.jenvrad.2011.12.004
8G. Lujanien_e et al. / <strong>Journal</strong> <strong>of</strong> <strong>Environmental</strong> <strong>Radioactivity</strong> xxx (2012) 1e10Fig. 8. An example <strong>of</strong> 72 h air mass backward trajectories ended at Vilnius sampling site at 19 UTC at 20, 500, 1000 m AGL on 29 January, 1997, on 06 June, 1999 and on 03 February,2001 for 4 analyzed sectors (modified after De Cort et al., 1998).239,240Pu,241Am, nBq/m350 239,240 Pu40302010241 Am137 Cs4321137Cs, µBq/m 3005 6 7 8 9 10 11 12 1 2 3 4 5 6 72005-2006Fig. 9. Activity concentrations <strong>of</strong> 239,240 Pu and 241 Am in monthly aerosol samples andmonthly average activity concentrations <strong>of</strong> 137 Cs in 2005e2006 in Vilnius.Fig. 10. Alfa-spectrum <strong>of</strong> Pu isotopes separated from aerosol samples collectedbetween 23 March and 15 April.Please cite this article in press as: Lujanien_e, G., et al., Radionuclides from the Fukushima accident in the air over Lithuania: measurement andmodelling approaches, <strong>Journal</strong> <strong>of</strong> <strong>Environmental</strong> <strong>Radioactivity</strong> (2012), doi:10.1016/j.jenvrad.2011.12.004
G. Lujanien_e et al. / <strong>Journal</strong> <strong>of</strong> <strong>Environmental</strong> <strong>Radioactivity</strong> xxx (2012) 1e10 9(Hirose and Sugimura, 1990). This is approximately the same levelas observed in the aerosol samples collected in Vilnius.The activity ratio <strong>of</strong> 238 Pu/ 239,240 Pu detected at the Fukushimasite was reported to be 2 (TEPCO, 2011). Assuming the backgroundratio equal to the global fallout determined on the basis <strong>of</strong> the longtermmeasurements at the Vilnius site (Lujanien_e et al., 2009) wecan estimate the contribution <strong>of</strong> the Fukushima plutonium bysimple calculations (Hirose and Sugimura, 1990) using thefollowing equation:Fð%Þ ¼100$ðR M R G Þ=ðR F R G Þwhere F is the Fukushima originated 239,240 Pu fraction, R M , R G and R Fare the measured, global fallout and Fukushima derived ratios <strong>of</strong>238 Pu/ 239,240 Pu, respectively. According to these estimations thecontribution <strong>of</strong> the Fukushima derived 239,240 Pu is 59% or 26.4nBq/m 3 .The mean activity concentration <strong>of</strong> 137 Cs found in Vilniusduring the studied period was 118 mBq/m 3 . The background 137 Csactivity concentration can be estimated from the sample collectedone week before the accident and it was 0.7 0.1 mBq/m 3 . Fromthese estimations the mean Fukushima originated 239,240 Pu/ 137 Csratio could be 2$10 4 . The activity ratio <strong>of</strong> 239,240 Pu/ 137 Cs in theChernobyl originated hot particles was 2$10 2 . A fractionationduring the long-distance transport may have resulted in thevariation <strong>of</strong> the ratio at different locations (Pöllänen et al., 1997;Hirose and Sugimura, 1990). Further analyses (ICPMS and AMS)are in progress, which will help to explain Pu origin in thissample.4. ConclusionsFrom the presented data on variations <strong>of</strong> activity concentrations<strong>of</strong> studied radionuclides, from the analyses <strong>of</strong> meteorologicalsituation, and on the basis <strong>of</strong> the modelling exercises we canconclude that the complicated air mass transport, different arrivaltime, arrival height and downward air mass transport resulted intwo maxima <strong>of</strong> 131 I and 137 Cs activity concentrations in the nearsurfaceatmosphere. An increase in the 131 I and 137 Cs activityconcentrations up to 3800 mBq/m 3 and up to 1070 mBq/m 3 wasobserved on 28 March e 1 April and up to 500 mBq/m 3 and up to1000 mBq/m 3 was found on 3e4 April, respectively. In addition to131 I and 137 Cs, traces <strong>of</strong> other radionuclides were detected, and 132 I,132 Te, 129 Te, 129m Te and 136 Cs among them. The comparison <strong>of</strong> theChernobyl and Fukushima accidents indicated the higher activityconcentration <strong>of</strong> radionuclides by 4 orders <strong>of</strong> magnitude anda broader spectrum <strong>of</strong> radionuclides in the Chernobyl plume ascompared to the Fukushima one. Large collected air volumesallowed us to determine for the first time in Europe the activityratio and concentration <strong>of</strong> Fukushima derived 238 Pu and 239,240 Puisotopes. Approximately twice higher Pu activity concentration asexpected, and 238 Pu/ 239,240 Pu ratio not typical either for globalfallout or the Chernobyl accident was found in the integratedaerosol sample.AcknowledgementsThis research was partially supported by the Structural Funds <strong>of</strong>EU - the Research and Development Operational Program fundedby the ERDF (project No. 26240220004). The authors thankstudents <strong>of</strong> the Chemical Department <strong>of</strong> the Vilnius University fortechnical assistance. The authors gratefully acknowledge theNOAA Air Resources Laboratory (ARL) for the provision <strong>of</strong> theREADY website (http://www.arl.noaa.gov/ready.php) used in thispublication.ReferencesAbe, T., Kosako, T., Komura, K., 2010. Relationship between variations <strong>of</strong> 7 Be, 210 Pband 212 Pb concentrations and sub-regional atmospheric transport: simultaneousobservation at distant locations. J. Environ. Radioact. 101, 113e121.Bolsunovsky, A., Dementyev, D., 2011. Evidence <strong>of</strong> the radioactive fallout in thecenter <strong>of</strong> Asia (Russia) following the Fukushima nuclear accident. J. Environ.Radioact. doi:10.1016/j.jenvrad.2011.06.007.Chino, M., Nakayama, H., Nagai, H., Terada, H., Katata, G., Yamazawa, H., 2011.Preliminary estimation <strong>of</strong> release amounts <strong>of</strong> 131 I and 137 Cs accidentally dischargedfrom the Fukushima Daiichi nuclear power plant into the atmosphere.J. Nucl. Sci. Technol. 48, 1129e1134.De Cort, M., Dubois, G., Fridman, Sh.D., Germenchuk, M.G., Izrael, Yu.A., Janssens, A.,Jones, A.R., Kelly, G.N., Kvasnikova, E.V., Matveenko, I.I., Nazarov, I.M.,Pokumeiko, Yu.M., Sitak, V.A., Stukin, E.D., Tabachny, L.Ya., Taturov, S.Yu.,Avdyushin, S.I., 1998. Atlas <strong>of</strong> Caesium Deposition on Europe after the ChernobylAccident European Commission report EUR16737, Luxembourg.Diaz Leon, J., Jaffe, D.A., Kaspar, J., Knecht, A., Miller, M.L., Robertson, R.G.H.,Schubert, A.G., 2011. Arrival time and magnitude <strong>of</strong> airborne fission productsfrom the Fukushima, Japan, reactor incident as measured in Seattle, WA, USA.J. Environ. Radioact. 102, 1032e1038.Draxler, R.R., Rolph, G.D., 2011. HYSPLIT (Hybrid Single-particle Lagrangian IntegratedTrajectoy). NOAA Air Resources Laboratory, Silver Spring, MD, USA.http://ready.arl.noaa.gov/HYSPLIT.php.Fushimi, K., Nakayama, S., Sakama, M., Sakaguchi, Y., 2011. Measurement <strong>of</strong> airborneradioactivity from the Fukushima reactor accident in Tokushima, Japan. J. Phys.Soc. Jpn. arXiv:1104.3611v2.Hirose, K., Sugimura, Y., 1990. Plutonium isotopes in the surface air in Japan: effect<strong>of</strong> chernobyl accident. J. Radioanal. Nucl. Chem. Articles 138, 127e138.Hu, Q.-H., Weng, J.-Q., Wang, J.-S., 2010. Sources <strong>of</strong> anthropogenic radionuclides inthe environment: a review. J. Envirom. Radioact. 101, 426e437.IAEA, 2006. <strong>Environmental</strong> Consequences <strong>of</strong> the Chernobyl Accident and TheirRemediation: Twenty Years <strong>of</strong> Experience. RARS, Vienna.IAEA, 2011. Briefing on Fukushima Nuclear Accident. www.iaea.org/newscenter/news/tsunamiupdate01.html/ 12 April 2011.Jordan, C.E., Dibb, J.E., Finkel, R.E., 2003. 10 Be/ 7 Be tracer <strong>of</strong> atmospheric transportand stratosphere-troposphere exchange. J. Geophys. Res. 108, 4234e4247.Koch, D.M., Jacob, D.J., Graustein, W.C., 1996. Vertical transport <strong>of</strong> troposphericaerosols as indicated by 7 Be and 210 Pb in a chemical tracer model. J. Geophys.Res. 101, 18,651e18,666.Kownacka, L., 2002. Vertical distributions <strong>of</strong> beryllium-7 and lead-210 in thetropospheric and lower stratospheric air. Nukleonika 47, 79e82.Land, C., Feichter, J., 2003. Stratosphereetroposphere exchange in a changingclimate simulated with the general circulation model MAECHAM4. J. Geophys.Res. 108, 8523e8532.Livingston, H.D., Povinec, P.P., 2002. Millennium perspective on the contribution <strong>of</strong>global fallout radionuclides to ocean science. Health Phys. 82, 656e668.Lozano, R.L., Hernández-Ceballos, M.A., Adame, J.A., Casas-Ruíz, M., Sorribas, M., SanMiguel, E.G., Bolívar, J.P., 2011. Radioactive impact <strong>of</strong> Fukushima accident on theIberian Peninsula: evolution and plume previous pathway. Environ. Int. 37,1259e1264.Lujanas, V., Lujanien_e, G., 2007. Application <strong>of</strong> cosmogenic radionuclides in ozonetracer studies. J. Radioanal. Nucl. Chem. 274, 287e291.Lujanas, V., Mastauskas, A., Lujaniene, G., Spirkauskaite, N., 1994. Development <strong>of</strong>radiation in Lithuania. J. Environ. Radioact. 23, 249e263.Lujanien_e, G., Aninkevicius, V., Lujanas, V., 2009. Artificial radionuclides in theatmosphere over Lithuania. J. Environ. Radioact. 100, 108e119.Lujanien_e, G., Sapolaite, J., Remeikis, V., Lujanas, V., Jermolajev, A., Aninkevicius, V.,2006. Cesium, americium and plutonium isotopes in ground level air <strong>of</strong> Vilnius.Czech. J. Physiol. 56 (Suppl. 4), D55eD61.Lujanien_e, G., Lujanas, V., Mastauskas, A., Ladygien_e, R., Ogorodnikov, B.L.,Stelingis, K., 1998. Influence <strong>of</strong> physico-chemical forms <strong>of</strong> radionuclides on theirmigration in the environment. Radiochim. Acta 82 (1), 305e310.Lujanien_e, G., 2000. Investigation <strong>of</strong> cosmogenic radionuclide carriers in theatmosphere. Czech. J. Phys. 50, 321e329.Lujanien_e, G., 2003. Study <strong>of</strong> removal processes <strong>of</strong> 7 Be and 137 Cs from the atmosphere.Czech. J. Phys. 53, A57eA65.Lujanien_e, G., Lujanas, V., Jankunait _e, D., Ogorodnikov, B.I., Mastauskas, A.,Ladygien_e, R., 1999. Speciation <strong>of</strong> radionuclides <strong>of</strong> the chernobyl origin inaerosol and soil samples. Czech. J. Phys. 49 (1), 107e112.Lujanien_e, G., Bycenkien_e, S., Sciglo, T., Povinec, P.P., Gera, M., Bartok, J., Gazák, M.,2011. Radionuclides from the Fukushima Accident in Europe e Modelling theAir Mass Transport. In: Proceedings FSKD 2011, vol. 4, 26-28 July, 2011,Shanghai, China, pp. 2775e2777.Lujanien_e, G., Ogorodnikov, B., Budyka, A., Skitovich, V., Lujanas, V., 1997.An investigation <strong>of</strong> changes in radionuclide carrier properties. Adv. Space. Res.35, 71e90.Manolopoulou, M., Vagena, E., Stoulos, S., Ioannidou, A., Papastefanou, C., 2011.Radioiodine and radiocesium in Thessaloniki, Northern Greece due to theFukushima nuclear accident. J. Environ. Radioact. 102, 796e797.Martin, J.M., Thomas, A.J., 1988. Anomalous concentrations <strong>of</strong> atmosphericplutonium-238 over Paris. J. Environ. Radioact. 7, 1e16.Masson, O., Baeza, A., Bieringer, J., Brudecki, K., Bucci, S., Cappai, M., Carvalho, F.P.,Connan, O., Cosma, C., Dalheimer, A., Didier, D., Depuydt, G., De Geer, L.E., DePlease cite this article in press as: Lujanien_e, G., et al., Radionuclides from the Fukushima accident in the air over Lithuania: measurement andmodelling approaches, <strong>Journal</strong> <strong>of</strong> <strong>Environmental</strong> <strong>Radioactivity</strong> (2012), doi:10.1016/j.jenvrad.2011.12.004
10G. Lujanien_e et al. / <strong>Journal</strong> <strong>of</strong> <strong>Environmental</strong> <strong>Radioactivity</strong> xxx (2012) 1e10Vismes, A., Gini, L., Groppi, F., Gudnason, K., Gurriaran, R., Hainz, D.,Halldorsson, O., Hammond, D., Hanley, O., Holey, K., Homoki, Zs., Ioannidou, A.,Isajenko, K., Jankovick, M., Katzlberger, C., Kettunen, M., Kierepko, R., Kontro, R.,Kwakman, P.J.M., Lecomte, M., Leon Vintro, L., Leppänen, A.-P., Lind, B.,Lujanien_e, G., Mc Ginnity, P., Mc Mahon, C., Mala, H., Manenti, S.,Manolopoulou, M., Mattila, A., Mauring, A., Mietelski, J.W., Møller, B.S.,Nielsen, P., Nikolick, J., Overwater, R.M.W., Palsson, S.E., Papastefanou, C.,Penev, I., Pham, M.K., Povinec, P.P., Ramebäck, H., Reis, M.C., Ringer, W.,Rodriguez, A., Rulík, P., Saey, P.R.J., Samsonov, V., Schlosser, C., Sgorbati, G.,Silobritiene, B.V., Söderström, C., Sogni, R., Solier, L., Sonck, M., Steinhauser, G.,Steinkopff, T., Steinmann, P., Stoulos, S., Sykora, I., Todorovic, D., Tooloutalaie, N.,Tositti, L., Tschiersch, J., Ugron, A., Vagena, E., Vargas, A., Wersh<strong>of</strong>en, A.H.,Zhukova, O., 2011. Tracking <strong>of</strong> airborne radionuclides from the damagedFukushima Dai-ichi nuclear reactors by European Networks. Environ. Sci.Technol. 45, 7670e7677.Microstep, 2011. http://www.microstep-mis.com/index.php?lang¼en&site¼src/products/radiation_monitoring/ims_model_suite, 23.5.2011 [online].NISA, 2011. http://www.nisa.meti.go.jp/.Papastefanou, C., 2009. Radon decay product aerosols in ambient air aerosol and air.Qual. Res. 9, 385e393.Pittauerová, D., Hettwig, B., Fischer, H.W., 2011. Fukushima fallout in NorthwestGerman environmental media. J. Environ. Radioact. 102, 877e880.Pöllänen, R., Valkama, I., Toivonen, H., 1997. Transport <strong>of</strong> radioactive particles fromthe chernobyl accident. Atmos. Environ. 31 (21), 3575e3590.Rolph, G.D., 2011. Real-time <strong>Environmental</strong> Applications and Display SYstem(READY). NOAA Air Resources Laboratory, Silver Spring, MD. Website. http://ready.arl.noaa.gov.Sheets, R.W., Lawrence, A.E., 1999. Comparative temporal behavior <strong>of</strong> radon- andthoron-progeny in surface air over the midwestern U.S. J. Radioanal. Nucl.Chem. 242, 761e767.TEPCO, 2011. Detection <strong>of</strong> Radioactive Material in the Soil in Fukushima DaiichiNuclear Power Station. http://www.tepco.co.jp/en/press/corp-com/release/11032812-e.html.Winiarek, V., Bocquet, M., Roustan, Y., Birman, C., Tran, P., 2011. AtmosphericDispersion <strong>of</strong> Radionuclides from the Fukushima-Daichii Nuclear Power Plant.http://cerea.enpc.fr/fr/fukushima.html.WMO, 2009. World meteorological organization: manual on Codes. InternationalCodes. In: Part B e Binary Codes. Part C e Common Features to Binary andAlphanumeric Codes. WMO-No. 306, vol. I.2. Secretariat <strong>of</strong> the World MeteorologicalOrganization, Geneva. pp.740.Wotawa, G., 2011. Accident in the Japanese NPP Fukushima: Synthesis <strong>of</strong> OurCurrent Calculations and CTBTO Data Shows Global Spread <strong>of</strong> Air MassesOriginating from Japan (Update: 25 March 2011 16:00). http://www.zamg.ac.at/docs/aktuell/Japan2011-03-25_1600_E_2.pdf.Yoshimori, M., 2005. Beryllium 7 radionucleide as a tracer <strong>of</strong> vertical air masstransport in the troposphere. Adv. Space Res. 36, 828e832.Závodský, D. (Ed.), 2011. Atmospheric Chemistry and Air Pollution Modelling.Leonardo da Vinci Programme. Matej Bel University, Banská Bystrica, pp. 127.Please cite this article in press as: Lujanien_e, G., et al., Radionuclides from the Fukushima accident in the air over Lithuania: measurement andmodelling approaches, <strong>Journal</strong> <strong>of</strong> <strong>Environmental</strong> <strong>Radioactivity</strong> (2012), doi:10.1016/j.jenvrad.2011.12.004