CHARITABLE BINGO OPERATIONS DIVISION - Txbingo.org
CHARITABLE BINGO OPERATIONS DIVISION - Txbingo.org
CHARITABLE BINGO OPERATIONS DIVISION - Txbingo.org
- No tags were found...

You also want an ePaper? Increase the reach of your titles
YUMPU automatically turns print PDFs into web optimized ePapers that Google loves.
<strong>CHARITABLE</strong> <strong>BINGO</strong> <strong>OPERATIONS</strong> <strong>DIVISION</strong>2011 ANNUAL REPORT<strong>CHARITABLE</strong> <strong>BINGO</strong>ANNUAL REPORT<strong>OPERATIONS</strong> <strong>DIVISION</strong>TEXAS LOTTERY COMMISSION1
<strong>CHARITABLE</strong> <strong>BINGO</strong> <strong>OPERATIONS</strong> <strong>DIVISION</strong>2011 ANNUAL REPORTTABLE OF CONTENTSAgency Core Values ............................................1Agency Vision. ................................................2Charitable Bingo Operations Division Mission Statement. ...............2Charitable Bingo Operations Division Regulatory Objective. .............2Terminology in the 2011 Annual Report .............................3Data in the 2011 Annual Report ...................................5Gross Receipts ................................................5Net Receipts and Proceeds ......................................7Prizes Paid To Players ..........................................7Charitable Distributions. .........................................8Attendance ...................................................9Commercial Lessor Lease Income and Rental Tax ...................10Charitable Bingo Allocations to Cities and Counties. ..................10Revenue to the State ..........................................11Licensed Organizations ........................................12Conductor Licenses ...........................................13Types of Licenses .............................................13Bingo Training Program ........................................14Audit Activity .................................................15Final Administrative Actions .....................................16Registry of Approved Bingo Workers ..............................16Appendix A: Gross Receipts, Prizes, and Charitable Distributionsby County ...................................................17Appendix B: Charitable Bingo Allocationsto Counties and Percentage of Change ............................21Appendix C: Charitable Bingo Allocationsto Cities and Percentage of Change ...............................23
<strong>CHARITABLE</strong> <strong>BINGO</strong> <strong>OPERATIONS</strong> <strong>DIVISION</strong>2011 ANNUAL REPORTTEXAS LOTTERY COMMISSIONAGENCY VISIONTo be the preeminent Lottery and Charitable Bingo agency through innovativeleadership.AGENCY MISSIONTexas Lottery: The Texas Lottery is committed to generating revenue for thestate of Texas through the responsible management and sale of entertaining lotteryproducts. The Texas Lottery will incorporate the highest standards of securityand integrity, set and achieve challenging goals, provide quality customer serviceand utilize a TEAM approach.Charitable Bingo: Provide authorized <strong>org</strong>anizations the opportunity to raise fundsfor their charitable purposes by conducting bingo. Determine that all charitablebingo funds are used for a lawful purpose. Promote and maintain the integrity ofthe charitable bingo industry throughout Texas.AGENCY CORE VALUESIntegrity and Responsibility - The Commission works hard to maintain thepublic trust by protecting and ensuring the security of our lottery games, systems,drawings and operational facilities. We value and require ethical behavior by ouremployees, licensees and vendors. We promote the integrity of charitable bingoin Texas for the benefit of charitable <strong>org</strong>anizations.Innovation - We strive to incorporate innovation into our products to provide thecitizens of Texas with the best entertainment experience available through ourproducts. We pursue the use of technology that enhances the services that weprovide to our customers and reduces our operating expenses.Fiscal Accountability - We emphasize fiscal accountability by ensuring that all expendituresdirectly or indirectly generate revenue, enhance security, fulfill regulatoryrequirements, improve customer service and/or boost productivity. We recognizeour responsibility in generating revenue for the state of Texas without undulyinfluencing players to participate in our games. We maximize benefits to charitiesthrough the continual examination and review of charitable bingo operations.1
<strong>CHARITABLE</strong> <strong>BINGO</strong> <strong>OPERATIONS</strong> <strong>DIVISION</strong>2011 ANNUAL REPORTCustomer Responsiveness - The Commission takes pride in providing exemplaryservice to the people of Texas through the courteous dissemination of clearand accurate information about our products, services and regulatory functions.We seek and respond to feedback expressed by our employees, retailers, licenseesand the playing and non-playing public. We apply this feedback in the developmentof our products and in the services that we provide.Teamwork - We are committed to creating an environment of mutual respectwhere open, honest communication is our cornerstone. We embrace the diversityof our team and individual perspectives in working together to achieve our commongoals.Excellence - We strive for excellence by taking a position of leadership on issuesthat impact the Commission and achieve challenging goals by focusing on ourcore values.<strong>CHARITABLE</strong> <strong>BINGO</strong> <strong>OPERATIONS</strong> <strong>DIVISION</strong> MISSIONSTATEMENTProvide authorized <strong>org</strong>anizations the opportunity to raise funds for their charitablepurposes by conducting bingo. Determine that all charitable bingo funds are usedfor a lawful purpose. Promote and maintain the integrity of the charitable bingoindustry throughout Texas.<strong>CHARITABLE</strong> <strong>BINGO</strong> <strong>OPERATIONS</strong> <strong>DIVISION</strong> REGULATORYOBJECTIVECharitable Bingo is an important fundraising activity for a variety of Texasnonprofit <strong>org</strong>anizations. The Charitable Bingo Operations Division of the TexasLottery Commission is charged with the strict control and close supervision ofbingo conducted in this state so that bingo is fairly conducted and the proceedsfrom bingo are used for an authorized purpose. Our goal is to achieve voluntarycompliance and assist licensees through training and education.We will strive for the highest levels of professionalism, conducting our regulatoryactivities fairly, competently and consistently. We will develop clear regulatoryrequirements in an open environment, encouraging two-way communication.2
<strong>CHARITABLE</strong> <strong>BINGO</strong> <strong>OPERATIONS</strong> <strong>DIVISION</strong>2011 ANNUAL REPORTTERMINOLOGY IN THE 2011 ANNUAL REPORT• Act – refers to the Bingo Enabling Act, TEX. OCC. CODE ANN § 2001• Commission – refers to the three member Texas Lottery Commission• Conductor – a licensed authorized <strong>org</strong>anization that holds a license toconduct bingo, also referred to as a licensed authorized <strong>org</strong>anization• Distributor – a person who obtains, by purchase or otherwise, bingoequipment or supplies for use in bingo in Texas and sells or furnishes theitems to another person for use, resale, display or operation• Lessor – a person licensed to lease premises for the purpose of conductingbingo, also referred to as a licensed commercial lessor• Licensed authorized <strong>org</strong>anization (Conductor) – an authorized<strong>org</strong>anization that holds a license to conduct bingo• Licensed commercial lessor (Lessor) – a person licensed to leasepremises and act as a commercial lessor.• Manufacturer – a person who assembles from raw materials or subparts acompleted piece of bingo equipment or supplies for use in bingo games inTexas or a person who converts, modifies, adds to, or removes parts from anybingo equipment, item, or assembly to further its promotion or sale for or usein a bingo game in Texas• Person – an individual, partnership, corporation, or other group• Rule or Rules – refers to Charitable Bingo Administrative Rules, 16 Tex.Admin. Code (TAC) ch. 4023
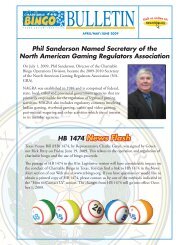
<strong>CHARITABLE</strong> <strong>BINGO</strong> <strong>OPERATIONS</strong> <strong>DIVISION</strong>2011 ANNUAL REPORT§2001.060 – REPORT TO THE GOVERNOR, ET ALHB 1474 included language that added a reporting requirement that theCommission, on or before June 1 of each even-numbered year, shall prepareand deliver to the governor, the lieutenant governor, the speaker of the House ofRepresentatives, and the chairs of the standing committees of the Senate andHouse of Representatives with primary jurisdiction over charitable bingo a reportstating for each of the preceding two calendar years:(1) the total amount of adjusted gross receipts reported by licensedauthorized <strong>org</strong>anizations from their bingo operations;(2) the total amount of net proceeds reported by licensed authorized<strong>org</strong>anizations from their bingo operations; and(3) a comparison of the amounts reported under Subdivisions (1) and (2),including the percentage that the net proceeds represents of the adjustedgross receipts.(4) For purposes of Subsection (a), “adjusted gross receipts” means the amountremaining after deducting prizes paid, excluding prize fees collected frombingo players.(5) For purposes of Subsection (a), the Commission shall determine the totalamount of net proceeds in a manner that does not reduce gross receiptsby the amount of rent paid for the rental of bingo premises by a licensedauthorized <strong>org</strong>anization to another licensed authorized <strong>org</strong>anization if theother <strong>org</strong>anization pays rent for the premises to a licensed commerciallessor.Table below provides the information requested in §2001.060 of the BingoEnabling Act:2010 2011Adjusted Gross Receipts (AGR) $172,716,063 $172,126,363Other Expenses $146,972,837 $146,259,189Net Proceeds (NP) $28,788,040 $28,559,645NP as a percentage of AGR 16.67% 16.59%Rent Income reported by Lessors $40,886,964 $42,102,802Rent Income reported by Conductor/Lessors $2,854,100 $2,667,989Rent Payments reported by conductors $40,048,151 $40,090,878Rent Income reported twice $1,114,736 $1,435,452Actual Rent Income $39,772,228 $40,667,3504
<strong>CHARITABLE</strong> <strong>BINGO</strong> <strong>OPERATIONS</strong> <strong>DIVISION</strong>2011 ANNUAL REPORTDATA IN THE 2011 ANNUAL REPORTData included in the 2011 Annual Report is for calendar years, unless indicatedotherwise, and is unaudited. In most instances, data for 10 years (2002 – 2011) isincluded to provide a benchmark measurement for comparison and analysis. In someinstances, data is included from 1982 through 2011 to provide an expanded basis forcomparison and to show trends from the inception of bingo in Texas through 2011.<strong>BINGO</strong> REVENUE AND BUSINESS ACTIVITIESSince the first licenses were issued in 1982, charitable bingo has had positivebenefits for charities, players, and state, county and municipal governments inTexas. Gross receipts from the conduct of charitable bingo total more than $16billion, bingo prizes awarded have been in excess of $11 billion, and allocationsto local jurisdictions have totaled approximately $262.9 million. By the end of calendaryear 2011, the total amount of charitable distributions from the conduct ofbingo exceeded $1 billion.Distributions by <strong>org</strong>anizations conducting charitable bingo benefit the people ofTexas in many ways that include providing assistance to local libraries, veterans<strong>org</strong>anizations, museums, women’s shelters, needy children, the disabled, homelessshelters, churches, schools, drug and alcohol treatment programs, medical treatmentand research programs, volunteer fire departments, EMS units, police officer<strong>org</strong>anizations, and senior citizen <strong>org</strong>anizations, to name a few.Local jurisdictions benefit from charitable bingo activity through allocations derivedfrom charitable bingo prize fees.The table below provides data related to gross receipts, prizes paid to players, charitabledistributions, and allocations to cities and counties from 2002 through 2011.5YEARTOTAL GROSSRECEIPTSSource: Texas Lottery CommissionFigures as of 3/16/2012. Unaudited.<strong>CHARITABLE</strong> <strong>BINGO</strong> FORCALENDAR YEARS 2002 – 2011PRIZES PAID TOPLAYERS<strong>CHARITABLE</strong>DISTRIBUTIONSALLOCATIONS2002 $557,086,857 $397,920,227 $31,745,178 $9,098,2232003 $575,701,959 $417,410,005 $29,885,100 $9,503,6562004 $604,744,497 $444,846,802 $30,044,665 $10,303,9382005 $634,031,612 $471,503,840 $30,384,530 $10,912,9592006 $658,325,172 $492,181,753 $31,999,876 $11,589,2402007 $658,200,485 $493,338,060 $32,090,164 $11,598,9562008 $685,418,665 $513,089,176 $32,852,800 $11,866,3402009 $692,927,554 $518,256,349 $35,834,421 $12,264,6412010 $699,431,119 $526,715,056 $33,919,844 $12,338,5672011 $705,926,913 $533,800,600 $29,038,478 $12,576,181
<strong>CHARITABLE</strong> <strong>BINGO</strong> <strong>OPERATIONS</strong> <strong>DIVISION</strong>2011 ANNUAL REPORTGROSS RECEIPTSThe table below compares all categories of gross receipts and the percentagechanges from year to year from 1982 through 2011 and is based on informationreported by licensed authorized <strong>org</strong>anizations:CHANGES IN <strong>BINGO</strong> GROSS RECEIPTS BY CATEGORYCALENDAR YEARS 1982 – 2011YEAR CARD SALES% CHANGECARD SALES1986 - 2002 Source is Texas Lottery Commission (CBS)2003-2011 Source is Texas Lottery Commission (ACBS)Figures as of 2/26/2012. Unaudited.PULL-TAB SALES% CHANGEPULL-TABSALESTOTAL GROSSRECEIPTS1982 $66,488,368 $- $66,488,368% CHANGETOTAL GROSSRECEIPTS1983 $163,172,680 145.42% $87 - $163,172,767 145.42%1984 $217,137,488 33.07% $4,676,582 5375281.61% $221,814,070 35.94%1985 $243,420,805 12.10% $11,872,941 153.88% $255,293,746 15.09%1986 $289,108,477 18.77% $13,548,709 14.11% $302,657,186 18.55%1987 $331,938,566 14.81% $36,086,789 166.35% $368,025,355 21.60%1988 $365,110,091 9.99% $101,901,561 182.38% $467,011,652 26.90%1989 $419,677,774 14.95% $130,997,997 28.55% $550,675,771 17.91%1990 $467,113,452 11.30% $154,335,596 17.82% $621,449,048 12.85%1991 $499,971,275 7.03% $173,501,233 12.42% $673,472,508 8.37%1992 $503,400,917 0.69% $164,719,328 -5.06% $668,120,245 -0.79%1993 $500,434,638 -0.59% $151,592,343 -7.97% $652,026,981 -2.41%1994 $492,662,092 -1.55% $140,391,468 -7.39% $638,571,682 -2.06%1995 $498,120,463 1.11% $139,769,085 -0.44% $638,184,564 -0.06%1996 $488,946,621 -1.84% $121,816,923 -12.84% $611,265,755 -4.22%1997 $491,756,262 0.57% $104,836,239 -13.94% $596,812,617 -2.36%1998 $506,642,255 3.03% $99,144,445 -5.43% $606,027,285 1.54%1999 $510,317,138 0.73% $96,753,377 -2.41% $607,070,515 0.17%2000 $493,414,252 -3.31% $89,353,141 -7.65% $582,767,393 -4.00%2001 $478,397,545 -3.04% $85,122,819 -4.73% $563,520,364 -3.30%2002 $468,107,354 -2.15% $88,979,503 4.53% $557,086,857 -1.14%2003 $445,876,396 -4.75% $129,825,563 45.91% $575,701,959 3.34%2004 $430,908,286 -3.36% $173,828,243 33.89% $604,744,497 5.04%2005 $410,842,204 -4.66% $223,189,408 28.40% $634,031,612 4.84%2006 $404,772,215 -1.48% $253,552,957 13.60% $658,325,172 3.83%2007 $385,245,447 -4.82% $272,958,293 7.65% $658,203,740 -0.02%2008 $379,825,563 -1.41% $305,748,049 12.01% $685,573,612 4.16%2009 $374,586,845 -1.38% $318,705,419 4.24% $693,291,930 1.13%2010 $372,246,282 -0.62% $327,184,837 2.66% $699,328,729 0.87%2011 $362,196,484 -2.70% $343,730,429 5.06% $705,926,913 1.01%6
<strong>CHARITABLE</strong> <strong>BINGO</strong> <strong>OPERATIONS</strong> <strong>DIVISION</strong>2011 ANNUAL REPORT7NET RECEIPTS AND PROCEEDSNet receipts is the sum of card sale entrance fees, electronic card sales, andpull-tab bingo sales less total bingo prizes awarded. Net proceeds is the sumof net receipts plus all other income (rent income, interest earned, the value ofmerchandise prizes donated) less total expenses.The table below compares net receipts to net proceeds and net proceeds as apercentage of net receipts from 2002 through 2011:YEARNET RECEIPTS AND NET PROCEEDS AND NET PROCEEDS AS APERCENTAGE OF NET RECEIPTS 2002 – 2011ADJUSTEDGROSS RECEIPTSPRIZES PAID TO PLAYERSNET PROCEEDSNET PROCEEDS AS APERCENTAGE OFADJUSTED GROSSRECEIPTS2002 $159,166,630 $31,641,671 19.88%2003 $158,291,569 $30,163,735 19.06%2004 $159,896,142 $32,472,031 20.31%2005 $162,527,772 $33,377,825 20.54%2006 $166,143,419 $34,287,514 20.64%2007 $164,864,216 $34,053,668 20.66%2008 $172,344,954 $36,436,987 21.14%2009 $174,897,212 $33,150,377 18.95%2010 $172,700,419 $28,726,073 16.63%2011 $172,126,363 $28,559,645 16.59%Figures as of 04/05/2012. Unaudited.A bingo prize may not have a value of more than $750 for a single game. Forregular bingo games, the total value of prizes awarded during a bingo occasioncannot exceed $2,500. Note: A bingo occasion may not exceed four hours.Total prizes paid to players in 2011 exceeded $533 million, the highest since theissuance of the first bingo licenses in 1982. The increase in prizes paid to playersis attributable to pull-tab prizes that were the highest since the inception of thesale of pull-tabs in Texas.The following table shows prizes paid to players from 2002 through 2011 basedon information reported by licensed authorized <strong>org</strong>anizations:
<strong>CHARITABLE</strong> <strong>BINGO</strong> <strong>OPERATIONS</strong> <strong>DIVISION</strong>2011 ANNUAL REPORTYEARREGULAR & ELECTRONICPRIZESPULL-TAB PRIZESTOTAL PRIZES2002 $335,116,214 $62,804,013 $397,920,2272003 $323,572,683 $93,837,323 $417,410,0052004 $317,787,262 $127,059,540 $444,846,8022005 $307,627,809 $163,876,031 $471,503,8402006 $307,784,184 $184,397,569 $492,181,7532007 $295,665,506 $197,674,018 $493,339,5242008 $291,822,316 $221,406,342 $513,228,6582009 $288,581,987 $229,811,686 $518,393,6732010 $291,733,761 $234,910,293 $526,644,0542011 $287,477,960 $246,322,640 $533,800,600Figures as of 04/05/2012. Unaudited.<strong>CHARITABLE</strong> DISTRIBUTIONS<strong>BINGO</strong> PRIZES PAID 2002 – 2011Licensed authorized <strong>org</strong>anization must disburse all net proceeds from thepreceding quarter. Under Section 2001.457 of the Act, a licensed authorized<strong>org</strong>anization must disburse all net proceeds from the preceding quarter less theretained operating capital.Charitable distributions saw a slight decrease with <strong>org</strong>anizations reporting thatthey distributed $29 million for their charitable purposes, which was more thanfour times their statutorily required charitable distribution, bringing charitabledistributions since 1981 to more than $1 billion.The data in the following table compares minimum required charitabledistributions by the Bingo Enabling Act to charitable distributions reported bylicensed authorized <strong>org</strong>anizations from 2002 through 2011:REQUIRED <strong>CHARITABLE</strong> DISTRIBUTIONS COMPARED TOREPORTED <strong>CHARITABLE</strong> DISTRIBUTIONS 2002 – 2011YEARREQUIRED <strong>CHARITABLE</strong>DISTRIBUTIONREPORTED <strong>CHARITABLE</strong>DISTRIBUTION2002 $12,980,323 $31,745,1782003 $11,706,069 $29,885,1002004 $11,426,936 $30,044,6652005 $10,302,319 $30,384,5302006 $10,270,936 $31,999,8762007 $10,177,920 $32,090,6552008 $10,144,499 $32,852,8002009 $10,702,451 $36,038,7972010 $8,326,599 $33,942,6812012 $????? $29,038,478Figures as of 04/05/2012. Unaudited.8
<strong>CHARITABLE</strong> <strong>BINGO</strong> <strong>OPERATIONS</strong> <strong>DIVISION</strong>2011 ANNUAL REPORTATTENDANCEThe figures for attendance do not reflect the number of people playing bingo inthe years referenced, but are the cumulative reported attendance of personsat bingo games. Attendance is reported quarterly by licensed authorized<strong>org</strong>anizations that conduct bingo.The following table shows attendance from 2002 through 2011 and is basedon information reported by licensed authorized <strong>org</strong>anizations. Attendance hasshown a steady decline from 2002 to 2011, with a slight increase of .53 percentfrom 2008 to 2009. It appears that the introduction of the new style of instantevent tickets may have altered player patterns in an environment of decliningattendance, with players choosing to spend their funds on instant tickets ratherthan paper.YEAR<strong>BINGO</strong> ATTENDANCE 2002 – 2011ATTENDANCECHANGEATTENDANCE% CHANGEATTENDANCE2002 23,718,342 (667,122) -2.74%2003 22,749,669 (968,673) -4.08%2004 21,398,109 (1,351,560) -5.94%2005 19,908,409 (1,489,700) -6.96%2006 19,348,594 (559,815) -2.81%2007 17,926,344 (1,422,250) -7.35%2008 17,741,456 (184,888) -1.03%2009 17,834,924 93,468 0.53%2010 17,624,287 (210,637) -1.18%2011 16,770,394 (853,893) -4.84%Figures as of 3/16/2012. Unaudited.Source: Texas Lottery CommissionCOMMERCIAL LESSOR LEASE INCOME AND RENTAL TAXThe rent charged by a licensed commercial lessor to a licensed authorized<strong>org</strong>anization to conduct bingo may not exceed $600 for each bingo occasionconducted on the lessors’ premises unless the licensed authorized <strong>org</strong>anizationsubleases the premises to one or more other licensed authorized <strong>org</strong>anizations toconduct bingo, in which case the rent charged by the licensed commercial lessormay not exceed $600 for each day.9
<strong>CHARITABLE</strong> <strong>BINGO</strong> <strong>OPERATIONS</strong> <strong>DIVISION</strong>2011 ANNUAL REPORTThere is a 3-percent tax on gross rentals received by a licensed commerciallessor for the rental of premises where bingo is conducted.The following table shows lease income and rental tax reported by licensedcommercial lessors from 2002 through 2011:COMMERCIAL LESSORS LEASE INCOME &RENTAL TAX 2002 – 2011YEARTOTAL REPORTEDLEASE INCOME(LESSORS)TOTAL RENTAL TAXPAID (LESSORS)2002 $37,876,695 $1,129,8912003 $36,794,615 $1,118,8332004 $39,165,723 $1,167,7042005 $39,089,803 $1,187,1042006 $39,156,522 $1,202,7572007 $38,851,449 $1,173,7362008 $39,859,394 $1,181,3202009 $42,628,938 $1,242,5012010 $41,094,864 $1,215,1922011 $42,102,802 $1,298,089Figures as of 3/16/2012. Unaudited.<strong>CHARITABLE</strong> <strong>BINGO</strong> ALLOCATIONSTO CITIES AND COUNTIESSection 2001.502 of the Act requires a licensed authorized <strong>org</strong>anization to collectfrom a person who wins a bingo prize of more than $5 a fee in the amount of 5percent of the amount or value of the prize; and remit to the commission a fee in theamount of 5 percent of the amount or value of all bingo prizes awarded.Local jurisdictions in Texas benefit from charitable bingo activities in the form of allocationsderived from bingo prize fees. A county that imposed a gross receipts tax onthe conduct of bingo as of January 1, 1993, is entitled to 50 percent of the prize feecollected under § 2001.502 of the Act, on a prize awarded at a game conducted in thecounty.10
<strong>CHARITABLE</strong> <strong>BINGO</strong> <strong>OPERATIONS</strong> <strong>DIVISION</strong>2011 ANNUAL REPORTA municipality that imposed a gross receipts tax on the conduct of bingo as ofJanuary 1, 1993, is entitled to 50 percent of the fee collected under § 2001.502 ona prize awarded at a game conducted in the municipality.If a county and municipality are both entitled to a share of the fee imposed by§ 2001.502 of the Act, the county is entitled to 25 percent of the fee on a prize awardedat a game conducted in the county and the municipality is entitled to 25 percent of thefee on a prize awarded at a game conducted in the municipality. All prize fees that arenot allocated to local jurisdictions are deposited into the state’s General Revenue Fund.Each quarter, 2 percent of the total prize fees collected is retained in the jurisdiction’ssuspense account. The Commission may make refunds from the suspense account ofa jurisdiction for overpayments made to those accounts and may redeem dishonoredchecks and drafts deposited to the credit of the jurisdiction’s suspense account.The table below shows allocations derived from bingo prize fees from 2002through 2011:ALLOCATIONS 2002 – 2011YEAR CITIES COUNTIES STATE TOTAL2002 $4,253,970 $4,840,658 $10,782,152 $19,876,7802003 $4,539,900 $4,957,538 $10,953,394 $20,450,8332004 $4,925,498 $5,378,439 $11,766,429 $22,070,3672005 $5,184,670 $5,728,289 $12,367,824 $23,280,7832006 $5,530,420 $6,058,820 $13,018,887 $24,608,1272007 $5,553,344 $6,045,612 $13,009,408 $24,608,3652008 $5,731,619 $6,134,721 $13,156,222 $25,022,5612009 $5,887,555 $6,377,086 $13,621,194 $25,885,8352010 $5,891,842 $6,446,725 $13,680,985 $26,019,5522011 $6,026,934 $6,549,246 $13,884,537 $26,460,718Figures as of 2/03/2012. Unaudited.REVENUE TO THE STATECharitable bingo activities in Texas generate revenue for the state. The followingis an analysis of money generated from charitable bingo activities and depositedto the general revenue fund in 2011:Total prize fees and rental tax collected $27,945,763Total license fees collected $3,045,987Administrative penalties/settlement fees collected -$338,141Total deposited to General Revenue Fund $31,329,891Allocations paid to cities and counties -$12,576,181Net deposited to General Revenue Fund $18,753,71011
<strong>CHARITABLE</strong> <strong>BINGO</strong> <strong>OPERATIONS</strong> <strong>DIVISION</strong>2011 ANNUAL REPORTLICENSED ORGANIZATIONSThe Charitable Bingo Operations Division licenses the following types of<strong>org</strong>anizations related to the regulation of charitable bingo in Texas:• Conductor – an authorized <strong>org</strong>anization that conducts bingo. Thisrepresents the largest category of licensees in the charitable bingo industryin Texas.• Conductor/Lessor – an authorized <strong>org</strong>anization that conducts bingo andleases space to other authorized conductor <strong>org</strong>anizations to conduct bingo.• Lessor – an individual or <strong>org</strong>anization that leases a location to an authorizedconductor <strong>org</strong>anization for the purpose of conducting a charitablebingo game.• Distributor – an individual or <strong>org</strong>anizations that sells, distributes, orsupplies equipment to <strong>org</strong>anizations authorized to conduct bingo.• Manufacturer – an individual or <strong>org</strong>anization that manufactures bingoequipment and sells to licensed distributors in Texas.The following table shows <strong>org</strong>anizations by <strong>org</strong>anization types that applied for andwere issued a license in Texas from 2002 through 2011:ORGANIZATIONS THAT APPLIED FOR AND WERE ISSUED A LICENSE2002 – 2011YEAR CONDUCTOR LESSOR DISTRIBUTORFigures as of 1/03/2012. Unaudited.MANU-FACTURERSYSTEMSERVICEPROVIDERTOTAL%CHANGE2002 1,447 461 15 15 2 1,940 -2.27%2003 1,430 464 19 21 1 1,935 -0.26%2004 1,419 459 18 18 1 1,915 -1.03%2005 1,363 436 18 18 0 1,835 -4.18%2006 1,318 425 15 19 0 1,777 -3.16%2007 1,312 432 15 16 0 1,775 -0.11%2008 1,310 431 16 17 0 1,774 -.06%2009 1,255 416 20 17 0 1,708 -3.72%2010 1,254 418 18 17 0 1,707 -.06%2011 1,227 417 16 18 0 1,678 -1.70%12
<strong>CHARITABLE</strong> <strong>BINGO</strong> <strong>OPERATIONS</strong> <strong>DIVISION</strong>2011 ANNUAL REPORTCONDUCTOR LICENSESSection 2001.101 of the Act defines the types of nonprofit <strong>org</strong>anizations eligible fora license to conduct bingo in Texas. Those <strong>org</strong>anizations are:• A religious society that has existed in Texas for at least three years.• A nonprofit <strong>org</strong>anization:°whose predominant activities are for the support of medical researchor treatment programs; and°that for at least three years:n must have had a governing body or officers elected by a vote ofmembers or by a vote of delegates elected by the members, orn must have been affiliated with a state or national <strong>org</strong>anization<strong>org</strong>anized to perform the same purposes as the nonprofit<strong>org</strong>anization.• A fraternal <strong>org</strong>anization.• A veterans <strong>org</strong>anization that has existed in this state for at least three years.• A volunteer fire department that has existed in this state for at least threeyears.• An emergency medical service that has existed in this state for at least threeyears.The following table shows conductor licenses issued by <strong>org</strong>anization type fromcalendar year 2002 through 2011:CALENDARYEARLICENSED AUTHORIZED CONDUCTOR ORGANIZATIONSBY ORGANIZATION TYPE 2002 – 2011RELIGIOUS MEDICAL FRATERNAL1986 - 2002 Source is Texas Lottery Commission (CBS)2003 - 2011 Source is Texas Lottery Commission (ACBS)VOLUNTEERFIRE DEPT.VETERANEMSNATIONALHISTORICALTOTAL2002 175 44 744 71 413 1,4472003 166 40 740 74 410 1,4302004 168 38 743 71 399 1,4192005 169 35 717 66 376 1,3632006 160 32 721 64 341 1,3182007 155 30 803 64 260 1,3122008 149 30 815 61 255 1,3102009 141 30 793 52 236 3 1,2552010 141 301 793 52 236 3 1 1,2542011 131 30 792 51 219 3 1 1,22713
<strong>CHARITABLE</strong> <strong>BINGO</strong> <strong>OPERATIONS</strong> <strong>DIVISION</strong>2011 ANNUAL REPORTTYPES OF LICENSESThe following table describes the types of licenses issued by the CharitableBingo Operations Division, the purpose of each license type, and the type oflicensee they are issued to:LICENSE TYPE PURPOSE ISSUED TOAmendmentTo change information on a conductor or lessorlicense. May include changes in playing days,times, location of games, or <strong>org</strong>anization’slocation, officers or bingo chairpersonConductorsLessorsOriginalRenewalTemporaryTo obtain an initial license for a specific licensetypeTo renew the license.A license may be renewed on an annualor biannual basis.Issued to authorized <strong>org</strong>anizations to conductbingo for one, four-hour occasion on a specificday at a specific time. Organizations that hold aregular license to conduct bingo may obtain 24temporaries per license period. Organizationsthat play bingo only on temporary non-regularlicenses may obtain six temporary licenses percalendar year.ConductorsLessorsManufacturersDistributorsConductorsLessorsManufacturersDistributorsConductorsThe following table shows licenses issued by license type from 2002 to 2011:YEARAMENDMENTSISSUEDLICENSES ISSUED BY LICENSE TYPE2002 – 2011ORIGINALSISSUEDRENEWALSISSUEDTEMPORARYISSUEDTOTALISSUED2002 1,114 115 1,895 2,748 5,8722003 1,012 114 1,807 3,417 6,3502004 1,001 92 1,763 5,077 7,9332005 797 103 1,669 5,283 7,8522006 749 109 1,644 4,704 7,2062007 764 70 1,496 4,917 7,2472008 745 86 1,496 4,766 7,0932009 818 65 1,416 5,199 7,4982010 742 87 1,289 7,084 9,2022011 721 80 1275 7,416 9,462Figures as of 1/03/2012. Unaudited.14
<strong>CHARITABLE</strong> <strong>BINGO</strong> <strong>OPERATIONS</strong> <strong>DIVISION</strong>2011 ANNUAL REPORT<strong>BINGO</strong> TRAINING PROGRAMSections 2001.107, 2001.437(h) and 2001.438(e) of the Bingo Enabling Act requirethe bingo chairperson of every licensed authorized <strong>org</strong>anization to attend theBingo Training Program. Under the provisions of §§2001.107, 2001.437(h) and2001.438(e) of the Act, unit managers and designated agents are also required toattend training. Other officers and members may also attend training programs.In June 2008, the online version of the Bingo Training Program was madeavailable on the website. The online version allows the individuals required tocomplete the training program to do so at their own pace without the need totravel to an on-site training program or taking time off from work. It also reducestravels expenses for the Division due to a reduction in on-site training programs.AUDIT ACTIVITYIn 2010, the Audit Services Department of the Charitable Bingo Operations Divisionconducted a variety of audit activities including game inspections, oversight ofdestructions, complaint investigations, compliance audits and reviews.The Act and Rules require licensees to maintain certain documentation. Licenseesare not required to maintain records in a specific format but they are requiredto maintain the information that is included on the forms suggested by theCommission. During game inspections, investigations and audits, licensee recordsare inspected and audited to determine if the required records and information arebeing maintained and in compliance with the Act and Rules.The Commission conducts compliance audits and reviews to determine if the recordsand accounts of the <strong>org</strong>anization accurately reflect financial and fiscal operations, ifeffective accounting and internal controls are maintained, and to determine if fundsare received and used for purposes authorized by the Act and Rules.The table below shows audit activities in calendar year 2011:AUDIT ACTIVITIES 2011ACTIVITY NUMBER HOURSCompliance Audit & Review 25 14,263Oversight of Destructions 7 84Game Inspections 145 1,868CAMP Complaints Investigations 200 3,503Figures as of 2/22/2012. Unaudited.Note: The hours for the Audit Complaint investigation were added to the CAMP complaint case.15
<strong>CHARITABLE</strong> <strong>BINGO</strong> <strong>OPERATIONS</strong> <strong>DIVISION</strong>2011 ANNUAL REPORTFINAL ADMINISTRATIVE ACTIONSThe following chart is a summary of administrative actions taken by theCommission related to violations of the Bingo Enabling Act and Charitable BingoAdministrative Rules in 2011:ACTIONNUMBEROriginal Conductor Application Denied 5Original Lessor Application Denied 1Original Manufacturer Application Denied 0Conductor Renewal Application Denied 3Lessor Renewal Application Denied 0Agreed Orders 8Settlement Agreements 48Warnings and Notification of Violations 404Total Amount of Penalties Assessed $239,250REGISTRY OF APPROVED <strong>BINGO</strong> WORKERSThe Texas Lottery Commission maintains a registry of approved bingo workers.The registry is a list of persons on whom the Commission has conducted acriminal history background check and is approved to be involved in the conductof bingo. Only individuals listed on the registry may be involved in the conduct ofbingo. The commission issues an identification card to an individual once theyare approved to be listed on the registry.As of December 31, 2011, there were 14,123 individuals listed on the Registryof Approved Bingo Workers. In addition, the following occurred relative to theworker registry in 2011:• 1,628 individuals renewed their worker registration• 2,809 individuals submitted an original application to be added to theworker registry• 3,047 individuals’ registrations expired• 103 individuals were denied registration• 193 individuals were removed from the worker registry.16
<strong>CHARITABLE</strong> <strong>BINGO</strong> <strong>OPERATIONS</strong> <strong>DIVISION</strong>2011 ANNUAL REPORTAPPENDIX AGROSS RECEIPTS, PRIZES AND <strong>CHARITABLE</strong>DISTRIBUTIONS BY COUNTY17COUNTYGROSSRECEIPTS<strong>BINGO</strong>PRIZESTOTALINCOMETOTALEXPENSESNETPROCEEDS<strong>CHARITABLE</strong>DISTRIBUTIONSANDERSON $1,191,586 $924,090 $267,496 $233,894 $33,602 $37,420ANDREWS $94,541 $77,520 $17,021 $3,387 $13,634 $13,960ANGELINA $4,452,651 $3,268,152 $1,228,089 $933,481 $294,608 $259,474ARANSAS $503,218 $345,550 $157,687 $131,763 $25,924 $24,913ARCHER $1,058 $435 $623 $5,491 -$4,868 $0ATASCOSA $255,475 $200,929 $54,546 $26,817 $27,729 $28,208AUSTIN $603,960 $455,392 $148,610 $100,110 $48,500 $43,245BANDERA $171,515 $120,244 $51,271 $20,955 $30,316 $30,088BASTROP $397,844 $312,076 $85,791 $66,298 $19,493 $35,734BEE $512,565 $379,375 $133,190 $66,030 $67,160 $36,108BELL $44,517,259 $33,029,099 $11,711,072 $8,433,413 $3,277,659 $2,925,457BEXAR $106,304,787 $84,652,023 $22,266,937 $18,059,839 $4,207,098 $3,533,296BLANCO $1,011 $800 $211 $25 $186 $186BOWIE $3,950,380 $2,600,555 $1,349,874 $1,082,391 $267,483 $272,429BRAZORIA $1,489,047 $1,097,926 $391,144 $247,016 $144,128 $121,134BRAZOS $11,484,629 $8,542,090 $2,944,977 $2,469,752 $475,225 $426,069BREWSTER $90,257 $75,566 $14,691 $9,986 $4,705 $2,001BROOKS $18,273 $12,240 $6,033 $627 $5,406 $4,706BROWN $2,793,904 $2,084,156 $712,369 $457,865 $254,504 $230,195BURLESON $816,986 $684,175 $132,871 $137,682 -$4,811 $21,207BURNET $583,011 $475,508 $107,503 $94,076 $13,427 $3,278CALDWELL $27,886 $26,916 $970 $2,224 -$1,254 $387CALHOUN $320,171 $261,813 $58,367 $47,511 $10,856 $10,750CAMERON $8,716,057 $6,724,477 $1,991,593 $1,791,453 $200,140 $188,971CASTRO $1,800 $900 $900 $25 $875 $875CHILDRESS $0 $0 $0 $0 $0 $0COLLIN $4,372,815 $3,191,120 $1,181,695 $1,074,874 $106,821 $81,649COLORADO $127,180 $97,095 $30,089 $7,040 $23,049 $22,497COMAL $612,452 $481,374 $131,114 $118,278 $12,836 $22,918CONCHO $0 $0 $0 $0 $0 $0COOKE $12,904 $7,629 $5,275 $1,826 $3,449 $5,207CORYELL $9,007,512 $7,409,629 $1,597,886 $1,423,482 $174,404 $122,943DALLAS $57,484,511 $42,113,523 $15,722,205 $14,612,492 $1,109,713 $1,206,475DEAF SMITH $334,505 $257,893 $76,612 $63,867 $12,745 $19,299DENTON $2,338,738 $1,745,505 $715,392 $550,754 $164,638 $139,541DEWITT $204,913 $149,705 $55,208 $34,895 $20,313 $17,071DIMMIT $961,507 $762,017 $199,490 $123,466 $76,024 $79,100
<strong>CHARITABLE</strong> <strong>BINGO</strong> <strong>OPERATIONS</strong> <strong>DIVISION</strong>2011 ANNUAL REPORTGROSS RECEIPTS, PRIZES AND <strong>CHARITABLE</strong>DISTRIBUTIONS COUNTY (CONT’D)COUNTYGROSSRECEIPTS<strong>BINGO</strong>PRIZESTOTALINCOMETOTALEXPENSESNETPROCEEDS<strong>CHARITABLE</strong>DISTRIBUTIONSDUVAL $135,094 $99,078 $36,019 $12,542 $23,477 $23,866EASTLAND $0 $0 $0 $30 -$30 $0ECTOR $17,258,093 $13,542,545 $3,862,570 $3,011,716 $850,854 $1,244,707EDWARDS $834 $640 $194 $25 $169 $169EL PASO $6,435,645 $4,557,570 $1,878,271 $1,288,390 $589,881 $566,041ELLIS $770,592 $576,772 $193,820 $158,799 $35,021 $36,871ERATH $952,884 $681,596 $271,388 $250,868 $20,520 $48,678FALLS $110,218 $98,411 $15,407 $13,433 $1,974 $2,380FAYETTE $215,831 $153,417 $62,419 $16,427 $45,992 $44,829FORT BEND $1,235,396 $920,426 $315,008 $227,637 $87,371 $95,402FRANKLIN $1,576,306 $1,212,288 $402,098 $340,812 $61,286 $60,352FREESTONE $718,773 $540,880 $177,898 $123,304 $54,594 $50,675FRIO $122,478 $92,461 $30,017 $10,568 $19,449 $10,792GALVESTON $6,704,369 $4,607,758 $2,096,886 $1,477,585 $619,301 $610,116GILLESPIE $39,451 $29,813 $9,638 $7,905 $1,733 $2,319GLASSCOCK $3,363 $900 $2,463 $25 $2,438 $2,438GONZALES $4,829 $1,869 $2,960 $119 $2,841 $3,227GRAY $59,625 $42,213 $17,412 $12,319 $5,093 $1,787GRAYSON $2,643,277 $2,052,427 $677,777 $572,506 $105,271 $48,253GREGG $11,115,618 $8,717,655 $2,398,622 $2,229,033 $169,589 $125,345GUADALUPE $4,464,642 $3,398,888 $1,066,139 $810,728 $255,411 $341,778HARRIS $47,999,370 $35,958,742 $12,045,843 $10,723,571 $1,322,272 $1,213,823HARRISON $0 $0 $0 $0 $0 $0HAYS $229,747 $157,390 $72,380 $20,364 $52,016 $54,954HENDERSON $4,019,319 $3,166,258 $895,361 $846,036 $49,325 $50,000HIDALGO $26,212,812 $18,718,361 $7,498,185 $6,577,673 $920,512 $1,241,223HILL $1,659,678 $1,311,408 $348,270 $342,201 $6,069 $7,002HOOD $1,789,882 $1,517,904 $271,980 $239,744 $32,236 $19,244HOPKINS $204,275 $156,822 $50,356 $58,784 -$8,428 $5,421HOUSTON $41,038 $34,978 $6,060 $2,052 $4,008 $4,019HOWARD $1,032,281 $683,995 $377,986 $316,008 $61,978 $60,441HUTCHINSON $149,513 $114,005 $35,508 $26,802 $8,706 $12,104JACKSON $4,080 $2,923 $1,157 $1,267 -$110 $870JASPER $50,834 $39,475 $11,359 $16,177 -$4,818 $142JEFFERSON $9,492,901 $6,643,024 $2,864,725 $2,605,143 $259,582 $396,525JIM HOGG $50,320 $32,848 $17,472 $15,797 $1,675 $1,575JIM WELLS $504,445 $361,677 $150,271 $51,130 $99,141 $102,76118
<strong>CHARITABLE</strong> <strong>BINGO</strong> <strong>OPERATIONS</strong> <strong>DIVISION</strong>2011 ANNUAL REPORTGROSS RECEIPTS, PRIZES AND <strong>CHARITABLE</strong>DISTRIBUTIONS COUNTY (CONT’D)19COUNTYGROSSRECEIPTS<strong>BINGO</strong>PRIZESTOTALINCOMETOTALEXPENSESNETPROCEEDS<strong>CHARITABLE</strong>DISTRIBUTIONSJOHNSON $2,921,006 $2,324,233 $596,773 $489,319 $107,454 $146,366KARNES $312,469 $240,775 $71,694 $52,936 $18,758 $17,402KAUFMAN $493,467 $394,591 $98,876 $73,968 $24,908 $90KENDALL $619 $300 $319 $25 $294 $294KENEDY $250 $350 -$100 -$325 $225 $225KERR $1,030,237 $768,120 $262,194 $193,599 $68,595 $96,215KIMBLE $138 $325 -$187 $105 -$292 -$292KINNEY $18,317 $12,502 $5,815 $5,885 -$70 $0KLEBERG $636,400 $433,463 $202,937 $182,366 $20,571 $43,339LA SALLE $0 $0 $0 $0 $0 $335LAMAR $2,190,326 $1,541,180 $649,146 $562,431 $86,715 $123,014LAVACA $1,193,726 $937,260 $256,569 $257,582 -$1,013 $46,954LEE $1,624 $914 $710 $100 $610 $610LEON $57,808 $47,655 $10,161 $8,379 $1,782 $8,160LIBERTY $257,452 $238,911 $18,541 $20,926 -$2,385 $234LIVE OAK $4,638 $2,112 $2,526 $92 $2,434 $2,854LLANO $2,475 $1,400 $1,075 $168 $907 $930LUBBOCK $32,268,909 $24,541,557 $7,751,514 $6,542,719 $1,208,795 $1,039,272LYNN $367,662 $287,462 $80,200 $17,384 $62,816 $62,852MARTIN $0 $0 $0 $0 $0 $0MATAGORDA $1,279,968 $928,444 $351,537 $316,207 $35,330 $37,541MAVERICK $124,857 $78,850 $46,007 $36,294 $9,713 $8,737MCCULLOCH $158,011 $113,977 $44,034 $29,041 $14,993 $13,944MCLENNAN $19,662,105 $15,043,895 $4,760,363 $3,657,746 $1,102,617 $1,175,870MEDINA $195,592 $140,396 $55,196 $10,911 $44,285 $43,705MENARD $28,018 $17,848 $10,170 $5,625 $4,545 $4,145MIDLAND $11,077,434 $8,133,418 $2,947,929 $1,880,944 $1,066,985 $1,398,503MILAM $660,419 $520,014 $140,425 $126,640 $13,785 $13,413MONTAGUE $95,228 $72,684 $22,544 $12,330 $10,214 $10,203MONTGOMERY $14,268,093 $11,442,753 $2,831,933 $2,672,430 $159,503 $370,211MOORE $103,246 $67,157 $36,112 $31,669 $4,443 $9,563NACOGDOCHES $4,604,721 $3,525,788 $1,079,334 $983,352 $95,982 $183,680NAVARRO $119,590 $99,391 $47,949 $10,883 $37,066 $925NOLAN $3,728 $1,200 $2,528 $50 $2,478 $2,478NUECES $31,079,367 $23,258,942 $8,339,132 $7,162,327 $1,176,805 $1,428,424ORANGE $35,552 $29,970 $5,582 $1,646 $3,936 $4,129PALO PINTO $1,084,329 $807,514 $276,816 $210,279 $66,537 $70,180
<strong>CHARITABLE</strong> <strong>BINGO</strong> <strong>OPERATIONS</strong> <strong>DIVISION</strong>2011 ANNUAL REPORTGROSS RECEIPTS, PRIZES AND <strong>CHARITABLE</strong>DISTRIBUTIONS COUNTY (CONT’D)COUNTYGROSSRECEIPTS<strong>BINGO</strong>PRIZESTOTALINCOMETOTALEXPENSESNETPROCEEDS<strong>CHARITABLE</strong>DISTRIBUTIONSPARKER $2,014 $750 $1,264 $2,702 -$1,438 $3,918PECOS $75,403 $60,530 $14,873 $13,109 $1,764 $1,053POLK $1,965,869 $1,563,769 $402,135 $374,590 $27,545 $29,332POTTER $11,050,907 $8,220,803 $2,830,665 $2,599,154 $231,511 $384,915RANDALL $580 $290 $290 $535 -$245 $0REAL $6,829 $4,267 $2,562 $443 $2,119 $2,275REFUGIO $103,276 $90,814 $12,462 $12,206 $256 $570ROBERTSON $9,167 $4,691 $4,476 $175 $4,301 $4,301RUNNELS $4,750 $985 $3,765 $50 $3,715 $3,715SABINE $109,098 $84,847 $24,251 $22,158 $2,093 $2,342SAN PATRICIO $570,527 $444,778 $125,947 $65,063 $60,884 $53,858SCURRY $830,228 $581,295 $248,933 $208,478 $40,455 $47,596SMITH $5,970,829 $4,538,633 $1,432,220 $1,419,428 $12,792 $54,326STARR $3,468,298 $2,591,877 $894,788 $744,716 $150,072 $163,155TARRANT $59,037,036 $44,427,548 $14,655,996 $13,464,770 $1,191,226 $1,133,603TAYLOR $12,605,438 $9,610,516 $3,118,542 $2,439,284 $679,258 $475,288TOM GREEN $4,492,971 $3,380,151 $1,112,820 $1,031,071 $81,749 $71,537TRAVIS $34,499,327 $24,974,380 $9,525,329 $7,424,934 $2,100,395 $2,082,041TRINITY $336,024 $250,000 $86,050 $58,474 $27,576 $31,762UPSHUR $1,499 $1,248 $251 $371 -$120 $0UVALDE $1,407 $972 $435 $550 -$115 $0VAL VERDE $2,568,031 $1,815,575 $763,502 $565,682 $197,820 $163,661VICTORIA $6,596,183 $5,165,798 $1,430,385 $1,396,823 $33,562 $42,298WALKER $0 $0 $0 $3,378 -$3,378 $0WASHINGTON $457,236 $344,572 $112,664 $95,803 $16,861 $19,337WEBB $8,672,889 $6,718,295 $1,954,667 $1,644,287 $310,380 $423,969WHARTON $812,892 $634,755 $178,165 $144,653 $33,512 $36,559WHEELER $12,185 $8,470 $3,853 $5,577 -$1,724 $0WICHITA $3,456,053 $2,748,214 $707,839 $678,026 $29,813 $48,488WILBARGER $166,961 $139,450 $27,511 $16,259 $11,252 $9,593WILLIAMSON $7,487,232 $5,472,850 $2,038,632 $1,277,198 $761,434 $688,080WILSON $84,844 $64,961 $19,883 $11,722 $8,161 $9,946WINKLER $58,569 $46,200 $12,369 $10,173 $2,196 $1,854WISE $3,432 $3,257 $175 $571 -$396 $0WOOD $338,682 $266,782 $71,900 $64,800 $7,100 $19,000YOUNG $38,104 $32,756 $5,348 $1,999 $3,349 $2,756ZAVALA $929,691 $655,256 $274,812 $63,339 $211,473 $205,925TOTAL 705,926,963 533,800,600 174,818,834 146,259,189 28,559,645 29,038,478Figures as of 3/16/2012. Unaudited.20
<strong>CHARITABLE</strong> <strong>BINGO</strong> <strong>OPERATIONS</strong> <strong>DIVISION</strong>2011 ANNUAL REPORTAPPENDIX B<strong>CHARITABLE</strong> <strong>BINGO</strong> ALLOCATIONS TO COUNTIES ANDPERCENTAGE OF CHANGECOUNTY 2010 2011 CHANGE % CHANGEBASTROP 8,142 7,149 (994) -12.21%BELL 480,390 463,368 (17,022) -3.54%BEXAR 968,975 1,054,911 85,937 8.87%BOWIE 65,775 64,625 (1,150) -1.75%BROWN 35,528 31,400 (4,128) -11.62%BURNET 7,296 10,266 2,971 40.72%CALDWELL 2,370 1,106 (1,265) -53.35%CAMERON 104,040 94,674 (9,366) -9.00%COMAL 16,923 15,681 (1,242) -7.34%DALLAS 585,250 569,923 (15,328) -2.62%DEAF SMITH 6,593 6,575 (18) -0.27%DENTON 22,687 22,125 (562) -2.48%ECTOR 237,878 241,943 4,065 1.71%EL PASO 56,657 56,766 109 0.19%ELLIS 16,128 15,059 (1,069) -6.63%FREESTONE 6,740 6,864 124 1.84%FRIO 2,202 2,590 388 17.60%GALVESTON 70,270 60,003 (10,267) -14.61%GILLESPIE 1,072 730 (342) -31.90%GRAY 819 923 104 12.69%GRAYSON 27,321 26,012 (1,309) -4.79%GREGG 86,280 104,032 17,751 20.57%GUADALUPE 55,376 49,152 (6,224) -11.24%HARRIS 598,922 600,163 1,242 0.21%HIDALGO 340,713 335,473 (5,239) -1.54%JACKSON 371 124 (248) -66.75%KARNES 5,575 5,724 149 2.67%KAUFMAN 2 2,035 2,033 93678.34%KENDALL 0 7 7 0.00%KINNEY 230 234 4 1.70%KLEBERG 6,071 5,181 (890) -14.66%LIBERTY 8,662 15,315 6,653 76.81%LUBBOCK 288,995 312,221 23,226 8.04%LYNN 5,957 7,363 1,407 23.62%MCLENNAN 184,548 190,558 6,009 3.26%21
<strong>CHARITABLE</strong> <strong>BINGO</strong> <strong>OPERATIONS</strong> <strong>DIVISION</strong>2011 ANNUAL REPORT<strong>CHARITABLE</strong> <strong>BINGO</strong> ALLOCATIONS TO COUNTIESAND PERCENTAGE OF CHANGE (CONT’D)COUNTY 2010 2011 CHANGE % CHANGEMIDLAND 85,129 94,410 9,281 10.90%MONTAGUE 933 936 3 0.31%MONTGOMERY 153,557 162,901 9,344 6.09%NOLAN 0 27 27 0.00%NUECES 286,043 290,511 4,468 1.56%ORANGE 1,268 392 (876) -69.11%PARKER 10,801 1,167 (9,634) -89.19%PECOS 912 1,543 631 69.16%POTTER 213,273 206,300 (6,972) -3.27%ROBERTSON 137 62 (75) -54.69%SAN PATRICIO 9,027 10,349 1,322 14.64%SMITH 36,902 50,467 13,564 36.76%TARRANT 575,263 558,403 (16,860) -2.93%TAYLOR 148,099 125,332 (22,767) -15.37%TOM GREEN 41,122 42,666 1,544 3.75%TRAVIS 288,695 323,022 34,327 11.89%VAL VERDE 45,169 45,533 363 0.80%VICTORIA 60,569 62,732 2,163 3.57%WALLER 11 0 (11) -100.00%WEBB 71,193 78,056 6,863 9.64%WILBARGER 5,189 4,204 (985) -18.98%WILLIAMSON 105,981 108,737 2,756 2.60%WINKLER 1,859 1,220 (639) -34.37%TOTAL 6,446,725 6,549,246 102,521 1.59%Figures as of 3/16/2012. Unaudited.22
<strong>CHARITABLE</strong> <strong>BINGO</strong> <strong>OPERATIONS</strong> <strong>DIVISION</strong>2011 ANNUAL REPORT<strong>CHARITABLE</strong> <strong>BINGO</strong> ALLOCATIONS TO CITIESAND PERCENTAGE OF CHANGE (CONT’D)CITY 2010 2011 CHANGE % CHANGEGUN BARREL CITY $44,983 $65,050 20,067 44.61%HALTOM CITY $15,252 $14,146 (1,106) -7.25%HARKER HEIGHTS $104,852 $101,324 (3,528) -3.37%HARLINGEN $26,655 $21,261 (5,394) -20.24%HELOTES $2,284 $2,159 (125) -5.46%HEMPSTEAD $11 $0 (11) -100.00%HILLSBORO $33,578 $31,530 (2,047) -6.10%HOUSTON $181,002 $172,763 (8,240) -4.55%HUMBLE $46,213 $50,371 4,158 9.00%HURST $80,119 $64,733 (15,386) -19.20%INGLESIDE $1,596 $1,584 (12) -0.74%IRVING $48,068 $48,971 903 1.88%KATY $1,933 $1,903 (31) -1.59%KAUFMAN $2 $0 (2) -100.00%KILLEEN $221,800 $209,172 (12,628) -5.69%KINGSVILLE $6,029 $5,143 (886) -14.69%KIRBY $433 $420 (14) -3.12%LA FERIA $59 $42 (17) -28.97%LA MARQUE $51,054 $55,426 4,372 8.56%LA PORTE $22 $14 (8) -37.70%LANCASTER $25,472 $24,740 (732) -2.87%LAREDO $71,192 $78,055 6,863 9.64%LEAGUE CITY $30 $34 4 11.97%LITTLE RIVER ACAD $3,172 $5,115 1,943 61.26%LONGVIEW $86,275 $104,027 17,752 20.58%LUBBOCK $288,995 $312,221 23,226 8.04%LULING $0 $25 25 0.00%MARBLE FALLS $305 $3,102 2,797 916.84%MERCEDES $5,399 $5,749 350 6.49%MESQUITE $32,426 $32,677 251 0.77%MIDLAND $85,129 $94,410 9,281 10.90%ODESSA $111,505 $106,723 (4,781) -4.29%ORANGE $1,268 $392 (876) -69.11%PALACIOS $2,579 $1,512 (1,067) -41.37%PARIS $62,107 $40,168 (21,939) -35.32%PASADENA $15,612 $7,886 (7,726) -49.49%PHARR $78,142 $78,575 433 0.55%24
<strong>CHARITABLE</strong> <strong>BINGO</strong> <strong>OPERATIONS</strong> <strong>DIVISION</strong>2011 ANNUAL REPORT<strong>CHARITABLE</strong> <strong>BINGO</strong> ALLOCATIONS TO CITIESAND PERCENTAGE OF CHANGE (CONT’D)CITY 2010 2011 CHANGE % CHANGEPLANO $80,512 $79,441 (1,071) -1.33%RICHARDSON $55,113 $53,057 (2,056) -3.73%RISING STAR $833 $0 (833) -100.00%ROBSTOWN $2,304 $86 (2,218) -96.26%ROMA $24,234 $24,766 531 2.19%ROUND ROCK $30,736 $30,660 (76) -0.25%SAN ANGELO $41,067 $42,628 1,562 3.80%SAN ANTONIO $943,690 $1,030,317 86,627 9.18%SAN BENITO $3,632 $2,488 (1,144) -31.49%SAN JUAN $35,949 $34,864 (1,085) -3.02%SCHERTZ $4,253 $1,040 (3,213) -75.54%SEGUIN $39,626 $35,728 (3,898) -9.84%SEVEN POINTS $28,237 $20,796 (7,441) -26.35%SHERMAN $23,792 $23,842 51 0.21%SOMERVILLE $6,495 $6,925 430 6.62%SOUTH HOUSTON $63,930 $63,320 (611) -0.95%TEMPLE $24,806 $46,759 21,953 88.50%TOMBALL $0 $16 16 0.00%TRINIDAD $2,937 $0 (2,937) -100.00%TYE $25,113 $21,059 (4,055) -16.15%TYLER $32,022 $47,551 15,529 48.49%UNIVERSAL CITY $251 $269 18 7.09%UVALDE $0 $10 10 0.00%VICTORIA $60,569 $62,732 2,163 3.57%WACO $143,546 $147,972 4,426 3.08%WATAUGA $22,809 $24,694 1,884 8.26%WESLACO $4,409 $4,283 (126) -2.87%WEST $201 $0 (201) -100.00%WEST TAWAKONI $1,767 $98 (1,669) -94.44%WHITE SETTLEMENT $37,277 $40,717 3,440 9.23%WICHITA FALLS $77,883 $70,747 (7,136) -9.16%TOTAL $5,891,842 $6,026,935 135,093 2.29%Figures as of 3/16/2012. Unaudited.25