Under the Radar: New York State Elder Abuse Prevalence Study
Under the Radar: New York State Elder Abuse Prevalence Study
Under the Radar: New York State Elder Abuse Prevalence Study
- No tags were found...

You also want an ePaper? Increase the reach of your titles
YUMPU automatically turns print PDFs into web optimized ePapers that Google loves.
<strong>Under</strong> <strong>the</strong> <strong>Radar</strong>:<strong>New</strong> <strong>York</strong> <strong>State</strong> <strong>Elder</strong> <strong>Abuse</strong> <strong>Prevalence</strong> <strong>Study</strong>SELF-REPORTED PREVALENCE AND DOCUMENTED CASE SURVEYSFINAL REPORTMay 2011Prepared by:Lifespan of Greater Rochester, Inc.Weill Cornell Medical Centerof Cornell University<strong>New</strong> <strong>York</strong> City Department for <strong>the</strong> Aging
TABLE OF CONTENTSResearch Project Participants . . . . . . . . . . . . . . . . . . . . . . . . . . . . . . . . . . . . . . . . . . . . . . . . . . . . . . . . . .iiiAdvisory Committee . . . . . . . . . . . . . . . . . . . . . . . . . . . . . . . . . . . . . . . . . . . . . . . . . . . . . . . . . . . . . . . . .ivAcknowledgements . . . . . . . . . . . . . . . . . . . . . . . . . . . . . . . . . . . . . . . . . . . . . . . . . . . . . . . . . . . . . . . . . . .vExecutive Summary . . . . . . . . . . . . . . . . . . . . . . . . . . . . . . . . . . . . . . . . . . . . . . . . . . . . . . . . . . . . . . . . . . .1Introduction . . . . . . . . . . . . . . . . . . . . . . . . . . . . . . . . . . . . . . . . . . . . . . . . . . . . . . . . . . . . . . . . . . . . . . . .7Background . . . . . . . . . . . . . . . . . . . . . . . . . . . . . . . . . . . . . . . . . . . . . . . . . . . . . . . . . . . . . . . . . . . . . . . . .7<strong>Elder</strong> <strong>Abuse</strong> Defined . . . . . . . . . . . . . . . . . . . . . . . . . . . . . . . . . . . . . . . . . . . . . . . . . . . . . . . . . . . . . . . . . .8Impetus for <strong>the</strong> <strong>Study</strong> . . . . . . . . . . . . . . . . . . . . . . . . . . . . . . . . . . . . . . . . . . . . . . . . . . . . . . . . . . . . . . . .10Significance of <strong>the</strong> <strong>Study</strong> . . . . . . . . . . . . . . . . . . . . . . . . . . . . . . . . . . . . . . . . . . . . . . . . . . . . . . . . . . . . . .10Previous Studies and Surveys of <strong>Prevalence</strong> and Documented Cases . . . . . . . . . . . . . . . . . . . . . . . . .11<strong>New</strong> <strong>York</strong> <strong>State</strong> Demographics . . . . . . . . . . . . . . . . . . . . . . . . . . . . . . . . . . . . . . . . . . . . . . . . . . . . . . . . .13Research Partners . . . . . . . . . . . . . . . . . . . . . . . . . . . . . . . . . . . . . . . . . . . . . . . . . . . . . . . . . . . . . . . . . . . .14Research Challenges . . . . . . . . . . . . . . . . . . . . . . . . . . . . . . . . . . . . . . . . . . . . . . . . . . . . . . . . . . . . . . . . .15<strong>Elder</strong> <strong>Abuse</strong> Services in <strong>New</strong> <strong>York</strong> <strong>State</strong> . . . . . . . . . . . . . . . . . . . . . . . . . . . . . . . . . . . . . . . . . . . . . . . . .16Methodology<strong>Prevalence</strong> (Self-Reported) <strong>Study</strong> . . . . . . . . . . . . . . . . . . . . . . . . . . . . . . . . . . . . . . . . . . . . . . . . .17Documented Case <strong>Study</strong> . . . . . . . . . . . . . . . . . . . . . . . . . . . . . . . . . . . . . . . . . . . . . . . . . . . . . . . .22ResultsSelf-Reported Cases . . . . . . . . . . . . . . . . . . . . . . . . . . . . . . . . . . . . . . . . . . . . . . . . . . . . . . . . . . . .24Documented Cases . . . . . . . . . . . . . . . . . . . . . . . . . . . . . . . . . . . . . . . . . . . . . . . . . . . . . . . . . . . . .36Comparison of Self-Reported and Documented Case Data . . . . . . . . . . . . . . . . . . . . . . . . . . . . . . . . .50Conclusions . . . . . . . . . . . . . . . . . . . . . . . . . . . . . . . . . . . . . . . . . . . . . . . . . . . . . . . . . . . . . . . . . . . . . . . .54Limitations of <strong>the</strong> <strong>Study</strong> . . . . . . . . . . . . . . . . . . . . . . . . . . . . . . . . . . . . . . . . . . . . . . . . . . . . . . . . . . . . . .58Implications for Fur<strong>the</strong>r Research . . . . . . . . . . . . . . . . . . . . . . . . . . . . . . . . . . . . . . . . . . . . . . . . . . . . . .58References . . . . . . . . . . . . . . . . . . . . . . . . . . . . . . . . . . . . . . . . . . . . . . . . . . . . . . . . . . . . . . . . . . . . . . . . . .59AppendicesA – Self-Reported <strong>Study</strong> Questionnaire . . . . . . . . . . . . . . . . . . . . . . . . . . . . . . . . . . . . . . . . . . . .61B – Documented Case <strong>Study</strong> Survey . . . . . . . . . . . . . . . . . . . . . . . . . . . . . . . . . . . . . . . . . . . . . . .77C – Documented Case <strong>Study</strong> Aggregate Case Data by Region . . . . . . . . . . . . . . . . . . . . . . . . . .94D – Documented Case <strong>Study</strong> Data by Region – Discussion . . . . . . . . . . . . . . . . . . . . . . . . . . .100E – Documented Case <strong>Study</strong> Aggregate Data by Service System . . . . . . . . . . . . . . . . . . . . . . .115F – Documented Case <strong>Study</strong> Service System Data – Discussion . . . . . . . . . . . . . . . . . . . . . . .118FiguresFigure 1 – <strong>New</strong> <strong>York</strong> <strong>State</strong> Resident Population- 60 + years of age . . . . . . . . . . . . . . . . . . . . . .13Figure 2 – Map of <strong>New</strong> <strong>York</strong> <strong>State</strong> Regions . . . . . . . . . . . . . . . . . . . . . . . . . . . . . . . . . . . . . . . . .26TablesTable 1 – Self-Reported <strong>Study</strong>-Marital Status of Respondents . . . . . . . . . . . . . . . . . . . . . . . . .25Table 2 – Self-Reported <strong>Study</strong>-Ethnicity of Respondents . . . . . . . . . . . . . . . . . . . . . . . . . . . . .25Table 3 – Self-Reported <strong>Study</strong>-Household Income . . . . . . . . . . . . . . . . . . . . . . . . . . . . . . . . . .25S e l f R e p o r t e d P r e v a l e n c e a n d D o c u m e n t e d C a s e S u r v e y s F i n a l R e p o r t 2 0 1 1 | i
Table 4 – Respondent and <strong>Elder</strong> Population Distribution by Region . . . . . . . . . . . . . . . . . . .27Table 5 – <strong>Prevalence</strong> Rates of Self-Reported <strong>Elder</strong> <strong>Abuse</strong> in <strong>New</strong> <strong>York</strong> <strong>State</strong>by Mistreatment Domain . . . . . . . . . . . . . . . . . . . . . . . . . . . . . . . . . . . . . . . . . . . . . .28Table 6 – <strong>Prevalence</strong> Rates of Self-Reported <strong>Elder</strong> <strong>Abuse</strong> in <strong>New</strong> <strong>York</strong> <strong>State</strong>by Geographic Area . . . . . . . . . . . . . . . . . . . . . . . . . . . . . . . . . . . . . . . . . . . . . . . . . . .29Table 7 – Incidence Rates of Self-Reported <strong>Elder</strong> <strong>Abuse</strong> in <strong>New</strong> <strong>York</strong> <strong>State</strong>by Mistreatment Domain . . . . . . . . . . . . . . . . . . . . . . . . . . . . . . . . . . . . . . . . . . . . . .31Table 8 – Incidence Rates of Self-Reported <strong>Elder</strong> <strong>Abuse</strong> in <strong>New</strong> <strong>York</strong> <strong>State</strong>by Geographic Area . . . . . . . . . . . . . . . . . . . . . . . . . . . . . . . . . . . . . . . . . . . . . . . . . . .33Table 9 – Self-Reported <strong>Study</strong>-Number of <strong>Abuse</strong>rs in Individual Cases . . . . . . . . . . . . . . . . .34Table 10 – Self-Reported <strong>Study</strong>-Distribution of <strong>Abuse</strong>rs by Relationshipand Type of Mistreatment . . . . . . . . . . . . . . . . . . . . . . . . . . . . . . . . . . . . . . . . . . . . . .35Table 11 – Documented Case <strong>Study</strong>: Response Rate by Service Systemand Organization . . . . . . . . . . . . . . . . . . . . . . . . . . . . . . . . . . . . . . . . . . . . . . . . . . . . .37Table 12 – Documented Case <strong>Study</strong>: Response Rate by Region . . . . . . . . . . . . . . . . . . . . . . . . .38Table 13 – Rates of Documented <strong>Elder</strong> <strong>Abuse</strong> in <strong>New</strong> <strong>York</strong> <strong>State</strong>by Geographic Area . . . . . . . . . . . . . . . . . . . . . . . . . . . . . . . . . . . . . . . . . . . . . . . . . . .39Table 14 – Documented Case Data –All Service Systems <strong>State</strong>wide-Victim Information . . . . . . . . . . . . . . . . . . . . . . . . . .42Table 15 – Documented Case Data –All Service Systems <strong>State</strong>wide-<strong>Abuse</strong>r Information . . . . . . . . . . . . . . . . . . . . . . . . .44Table 16 – Documented Case Data –All Service Systems <strong>State</strong>wide-Referral Information . . . . . . . . . . . . . . . . . . . . . . . . .46Table 17 – Documented Case <strong>Study</strong> Data-Percent of OrganizationsProviding Victim Information by Service System . . . . . . . . . . . . . . . . . . . . . . . . . . .49Table 18 – Rates of <strong>Elder</strong> <strong>Abuse</strong> in <strong>New</strong> <strong>York</strong> <strong>State</strong>: Comparison of Self-ReportedOne-Year Incidence and Documented Case Data . . . . . . . . . . . . . . . . . . . . . . . . . . .50Table 19 – Comparison of Self-Reported One-Year Incidence andDocumented Case Rates of <strong>Elder</strong> <strong>Abuse</strong> by Geographic Area . . . . . . . . . . . . . . . . .52Table 20 – Victim Demographic Information: Comparison of Documented Case Dataand Self-Reported Data . . . . . . . . . . . . . . . . . . . . . . . . . . . . . . . . . . . . . . . . . . . . . . . .53Prepared for:William B. Hoyt Memorial <strong>New</strong> <strong>York</strong> <strong>State</strong> Children and Family Trust Fund<strong>New</strong> <strong>York</strong> <strong>State</strong> Office of Children and Family Servicesii | U n d e r t h e R a d a r : N e w Y o r k S t a t e E l d e r A b u s e P r e v a l e n c e S t u d y
RESEARCH PROJECT PARTICIPANTSPrincipal InvestigatorsResearch ConsultantsMark Lachs, MD, MPHIrene F. and I. Roy PsatyDistinguished Professor of MedicineWeill Cornell Medical CollegeDirector of Geriatrics<strong>New</strong> <strong>York</strong> Presbyterian Healthcare SystemJacquelin Berman, PhDDirector of Research<strong>New</strong> <strong>York</strong> City Department for <strong>the</strong> AgingProject TeamPaul L. Caccamise, LMSW, ACSWProject DirectorVice President for ProgramLifespan of Greater RochesterAnn Marie Cook, MPAPresident/CEOLifespan of Greater RochesterArt Mason, LMSWAssistant Project DirectorProgram Manager<strong>Elder</strong> <strong>Abuse</strong> Prevention ProgramLifespan of Greater RochesterPatricia Brownell, PhD, LMSWResearch ConsultantAssociate Professor Emerita of Social ServiceFordham UniversityCharles Henderson, PhDSenior Research AssociateCollege of Human EcologyCornell UniversityYasamin Miller, MSDirectorCornell Survey Research InstituteCornell UniversityResearch AssistantsMikelle Damassia, MPAResearch AssistantFordham UniversityMebane Powell, MSWResearch Associate<strong>New</strong> <strong>York</strong> City Department for <strong>the</strong> AgingAurora Salamone, MPSDirector, <strong>Elder</strong>ly Crime Victims Resource Center<strong>New</strong> <strong>York</strong> City Department for <strong>the</strong> AgingDenise Shukoff, JDProject CoordinatorSpecial Projects CoordinatorLifespan of Greater RochesterS e l f R e p o r t e d P r e v a l e n c e a n d D o c u m e n t e d C a s e S u r v e y s F i n a l R e p o r t 2 0 1 1 | iii
PROJECT ADVISORY COMMITTEEAmy Barasch, <strong>New</strong> <strong>York</strong> <strong>State</strong> Office for <strong>the</strong> Prevention of Domestic ViolencePatricia Bomba, Excellus BlueCross BlueShield; MedAmerica Insurance Co. of NYRisa Breckman, Weill Cornell Medical CollegeAndrea Hoffman, <strong>New</strong> <strong>York</strong> <strong>State</strong> Office for <strong>the</strong> AgingPatricia Jennings, <strong>New</strong> <strong>York</strong> City Adult Protective ServicesGavin Kasper, Erie County Department of Social ServicesGary Kelly, <strong>New</strong> <strong>York</strong> <strong>State</strong> PoliceKaren Kissinger, <strong>New</strong> <strong>York</strong> <strong>State</strong> Office of Children & Family Services, Children & Family Trust FundAlan Lawitz, <strong>New</strong> <strong>York</strong> <strong>State</strong> Office of Children & Family Services, Bureau of Adult ServicesElizabeth Loewy, <strong>New</strong> <strong>York</strong> County District Attorney’s OfficeKen Onaitis, Carter Burden Center for <strong>the</strong> AgingKarl Pillemer, Cornell UniversityJudy Richards, <strong>New</strong> <strong>York</strong> <strong>State</strong> Office of Children & Family Services, Children & Family Trust FundElizabeth Santos, University of Rochester Medical CenterMarcie Serber, <strong>New</strong> <strong>York</strong> <strong>State</strong> Unified Court SystemJoy Solomon, Weinberg Center for <strong>Elder</strong> <strong>Abuse</strong> Prevention at <strong>the</strong> Hebrew HomeKim Spoonhower, <strong>New</strong> <strong>York</strong> <strong>State</strong> Office of Victim ServicesGwen Wright, <strong>New</strong> <strong>York</strong> <strong>State</strong> Office for <strong>the</strong> Prevention of Domestic Violenceiv | U n d e r t h e R a d a r : N e w Y o r k S t a t e E l d e r A b u s e P r e v a l e n c e S t u d y
ACKNOWLEDGEMENTSThis study was <strong>the</strong> result of a team effort involving not only <strong>the</strong> research partners but also manyexperts, academic institutions, social service organizations and government agencies in <strong>New</strong> <strong>York</strong><strong>State</strong>. The study partners would like to acknowledge <strong>the</strong> indispensable contributions made by manycolleagues. In particular, we would like to thank <strong>the</strong> Project Advisory Committee for <strong>the</strong>ir input into <strong>the</strong> designof <strong>the</strong> study. Special recognition is in order for Yasamin Miller, Director, and Darren Hearn, Manager, and <strong>the</strong>exceptional staff of <strong>the</strong> Cornell Survey Research Institute for conducting over 4,300 telephone interviews witholder <strong>New</strong> <strong>York</strong>ers.We thank Karl Pillemer and Charles Henderson of Cornell University for <strong>the</strong>ir expert input throughout<strong>the</strong> project. We are grateful to <strong>the</strong> many organizations that responded to <strong>the</strong> Documented Case Survey and to<strong>the</strong> officials who facilitated access to critical data. We would also like to thank Mebane Powell, ResearchAssociate, <strong>New</strong> <strong>York</strong> City Department for <strong>the</strong> Aging, and Mickelle Damassia, Research Assistant, FordhamUniversity Graduate School of Social Service, for <strong>the</strong>ir diligent work in collecting and analyzing data from over400 surveys collected from agencies across <strong>New</strong> <strong>York</strong> <strong>State</strong>.Special thanks are also due to Alan Lawitz, Director, Bureau of Adult Services, <strong>New</strong> <strong>York</strong> <strong>State</strong> Office ofChildren and Family Services, and his staff for assistance in accessing and interpreting Adult Protective Servicesdata for <strong>New</strong> <strong>York</strong> <strong>State</strong>. In particular, we would like to recognize OCFS Division of IT staff, Sandra Carrk andJennifer Gordon, as well as former IT consultant, Asha Ramrakhiani. We would also like to thank Assistant ChiefKathy Ryan of <strong>the</strong> <strong>New</strong> <strong>York</strong> City Police Department, Adrianna Fernandez-Lanier of <strong>the</strong> NYS Division of CriminalJustice Services, Kim Spoonhower from <strong>the</strong> NYS Office of Victim Services and Andrea Hoffman of <strong>the</strong> NYS Officefor <strong>the</strong> Aging for <strong>the</strong>ir invaluable assistance in obtaining data about elder abuse from <strong>the</strong>ir respective agencies.We would like to express our appreciation to <strong>the</strong> <strong>New</strong> <strong>York</strong> <strong>State</strong> Office of Children and Family Services/William B. Hoyt Memorial <strong>New</strong> <strong>York</strong> <strong>State</strong> Children and Family Trust Fund for sponsoring <strong>the</strong> project. Specialthanks are due to Judy Richards, Trust Fund Director, and Karen Kissinger, Trust Fund Program Manager, forshepherding <strong>the</strong> project through <strong>the</strong> state funding process and for <strong>the</strong>ir contributions to planning in all phasesof <strong>the</strong> study. We are grateful to <strong>the</strong> support staff at <strong>the</strong> participating institutions at Lifespan, Weill CornellMedical College, <strong>New</strong> <strong>York</strong> City Department for <strong>the</strong> Aging and Fordham University, all of whom had a hand inrealizing <strong>the</strong> goals of <strong>the</strong> study.We would also like to give special thanks to all <strong>the</strong> organizations that worked with us to ga<strong>the</strong>r data andrespond to our questionnaire.Finally, <strong>the</strong> research partners would like to thank <strong>the</strong> many older adults in <strong>New</strong> <strong>York</strong> who shared <strong>the</strong>irtime with us and revealed private life experiences with us in telephone interviews for <strong>the</strong> purpose of sheddinglight on <strong>the</strong> often hidden problem of elder abuse.S e l f R e p o r t e d P r e v a l e n c e a n d D o c u m e n t e d C a s e S u r v e y s F i n a l R e p o r t 2 0 1 1 | v
NEW YORK STATE ELDER ABUSE PREVALENCE STUDYEXECUTIVE SUMMARYThe <strong>New</strong> <strong>York</strong> <strong>State</strong> <strong>Elder</strong> <strong>Abuse</strong> <strong>Prevalence</strong> <strong>Study</strong> is one of <strong>the</strong> most ambitious and comprehensivestudies to quantify <strong>the</strong> extent of elder abuse in a discrete jurisdiction ever attempted, and certainly<strong>the</strong> largest in any single American state. With funding from <strong>the</strong> <strong>New</strong> <strong>York</strong> <strong>State</strong> William B. HoytMemorial Children and Family Trust Fund, a program administered under NYS Office of Children and FamilyServices, three community, governmental, and academic partners (Lifespan of Greater Rochester, <strong>the</strong> <strong>New</strong> <strong>York</strong>City Department for <strong>the</strong> Aging and <strong>the</strong> Weill Cornell Medical College) formed a collaborative partnership toconduct <strong>the</strong> study.AIMS OF THE STUDYThe study had three central aims achieved through two separate study components:■ To estimate <strong>the</strong> prevalence and incidence of various forms of elder abuse in a large, representative,statewide sample of older <strong>New</strong> <strong>York</strong>ers over 60 years of age through direct interviews (hereafterreferred to as <strong>the</strong> Self-Reported <strong>Prevalence</strong> <strong>Study</strong>)■ To estimate <strong>the</strong> number of elder abuse cases coming to <strong>the</strong> attention of all agencies and programsresponsible for serving elder abuse victims in <strong>New</strong> <strong>York</strong> <strong>State</strong> in a one-year period (<strong>the</strong> DocumentedCase <strong>Study</strong>), and■ To compare rates of elder abuse in <strong>the</strong> two component studies, permitting a comparison of “known”to “hidden” cases, and <strong>the</strong>reby determining an estimate of <strong>the</strong> rate of elder abuse underreporting in<strong>New</strong> <strong>York</strong> <strong>State</strong>.<strong>Prevalence</strong> refers to <strong>the</strong> number of older adults who have ever experienced elder mistreatment since turning60. Incidence refers to <strong>the</strong> number of new cases of elder abuse in <strong>the</strong> year prior to <strong>the</strong> survey interview.METHODOLOGYAt <strong>the</strong> completion of <strong>the</strong> study, 4,156 older <strong>New</strong> <strong>York</strong>ers or <strong>the</strong>ir proxies had been interviewed directly and 292agencies reported on documented cases from all corners of <strong>the</strong> state. Through <strong>the</strong> collaborative efforts of <strong>the</strong>three research partners, <strong>the</strong> study employed “cutting edge” methodologies to accomplish <strong>the</strong> goals of <strong>the</strong> study.These included (1) improvement of existing survey instruments to make <strong>the</strong>m “state of <strong>the</strong> art” using <strong>the</strong>combined field knowledge of academics and direct service providers; separate surveys were created for <strong>the</strong> Self-Reported <strong>Prevalence</strong> Survey and <strong>the</strong> Documented Case <strong>Study</strong>, (2) utilization of <strong>the</strong> Cornell Research SurveyInstitute in Ithaca to assemble a representative state sample of older adults and to conduct <strong>the</strong> interviews bytelephone, (3) administration of a survey to all major service systems, agencies and programs in <strong>the</strong> state thatreceive reports of elder abuse and provide investigation and intervention to older adult victims.S e l f R e p o r t e d P r e v a l e n c e a n d D o c u m e n t e d C a s e S u r v e y s F i n a l R e p o r t 2 0 1 1 | 1
Methodology - Self-Reported <strong>Prevalence</strong> <strong>Study</strong>In <strong>the</strong> Self-Reported <strong>Prevalence</strong> <strong>Study</strong>, <strong>the</strong> research team assembled a representative sample of all residents of<strong>New</strong> <strong>York</strong> <strong>State</strong> age 60 and older representing a broad cross section of <strong>the</strong> older population in <strong>the</strong> state. Thesample was created using a random digit dialing strategy derived from census tracts targeting adults over 60.The study was limited to older adults living in <strong>the</strong> community, that is, not living in licensed facilities such asnursing homes and adult care facilities. The actual surveys were conducted by telephone by trained interviewersat <strong>the</strong> Cornell Survey Research Institute. The survey instrument used for this component of <strong>the</strong> study capturedelder mistreatment in four general domains: (1) Neglect by a responsible caregiver (2) Financial Exploitation(3) Emotional <strong>Abuse</strong> and (4) Physical <strong>Elder</strong> <strong>Abuse</strong> (including Sexual <strong>Abuse</strong>).Methodology - Documented Case <strong>Study</strong>The Documented Case <strong>Study</strong> contacted programs and agencies responsible for specifically serving victims ofelder abuse and older victims of domestic violence in <strong>New</strong> <strong>York</strong> <strong>State</strong> and requested that <strong>the</strong>y complete a surveyabout cases served in calendar year 2008. The survey included questions on elder abuse cases that mirrored <strong>the</strong>questions used for <strong>the</strong> statewide Self-Reported <strong>Prevalence</strong> <strong>Study</strong>. Programs surveyed included Adult ProtectiveServices, law enforcement, area agencies on aging, domestic violence programs, elder abuse programs,programs funded by <strong>the</strong> Office of Victim Services (previously known as <strong>the</strong> Crime Victims Board), elder abusecoalitions, and District Attorney (DA) offices. While <strong>the</strong> amount of data supplied varied by county andorganization, at least some data was collected for each of <strong>the</strong> 62 counties in <strong>New</strong> <strong>York</strong> <strong>State</strong>.MAJOR FINDINGS■ The findings of <strong>the</strong> study point to a dramatic gap between <strong>the</strong> rate of elder abuse events reported by older<strong>New</strong> <strong>York</strong>ers and <strong>the</strong> number of cases referred to and served in <strong>the</strong> formal elder abuse service system.■ Overall <strong>the</strong> study found an elder abuse incidence rate in <strong>New</strong> <strong>York</strong> <strong>State</strong> that was nearly 24 timesgreater than <strong>the</strong> number of cases referred to social service, law enforcement or legal authorities whohave <strong>the</strong> capacity as well as <strong>the</strong> responsibility to assist older adult victims.■ Psychological abuse was <strong>the</strong> most common form of mistreatment reported by agencies providing dataon elder abuse victims in <strong>the</strong> Documented Case <strong>Study</strong>. This finding stands in contrast to <strong>the</strong> results of<strong>the</strong> Self-Reported <strong>Study</strong> in which financial exploitation was <strong>the</strong> most prevalent form of mistreatmentreported by respondents as having taken place in <strong>the</strong> year preceding <strong>the</strong> survey.■ Applying <strong>the</strong> incidence rate estimated by <strong>the</strong> study to <strong>the</strong> general population of older <strong>New</strong> <strong>York</strong>ers,an estimated 260,000 older adults in <strong>the</strong> state had been victims of at least one form of elder abuse in<strong>the</strong> preceding year (a span of 12 months between 2008-2009).Caution must be exercised in interpreting <strong>the</strong> large gap between prevalence reported directly by olderadults and <strong>the</strong> number of cases served. The adequacy of some documentation systems to provide elder abusecase data may have played a role in <strong>the</strong> results. The inability of some service systems and individual programsto report on <strong>the</strong>ir involvement in elder abuse cases may have affected <strong>the</strong> final tally of documented cases. As a2 | U n d e r t h e R a d a r : N e w Y o r k S t a t e E l d e r A b u s e P r e v a l e n c e S t u d y
esult, an undetermined number of cases may not be accounted for from agencies and programs that could notaccess some data about elder abuse victims served. However, <strong>the</strong> study received comprehensive data from <strong>the</strong>largest programs serving elder abuse victims: Adult Protective Services, law enforcement and community-basedelder abuse programs.Table ARates of <strong>Elder</strong> <strong>Abuse</strong> in <strong>New</strong> <strong>York</strong> <strong>State</strong>:Comparison of Self-Reported One-Year Incidence and Documented Case DataDocumented Self-reported Ratio of Self-ReportedRate per 1,000 Rate per 1,000 to Documented<strong>New</strong> <strong>York</strong> <strong>State</strong> - All forms of abuse 3.24 76.0 23.5Financial .96 42.1 43.9Physical and Sexual 1.13* 22.4* 19.8Neglect .32 18.3 57.2Emotional 1.37 16.4 12.0*The Documented Case rate includes physical abuse cases only. Physical and sexual abuse data werecombined in <strong>the</strong> Self-Reported <strong>Study</strong>. The sexual abuse rate for <strong>the</strong> Documented Case <strong>Study</strong> was 0.03per 1,000.It should be noted that <strong>the</strong> sum of <strong>the</strong> rates exceeds <strong>the</strong> total rates in both <strong>the</strong> Documented Case and Self-Reported Studies because some victims experienced more than one type of abuse.SELF-REPORTED PREVALENCE STUDYMajor findings of <strong>the</strong> Self-Reported <strong>Study</strong> include:■ A total one-year incidence rate of 76 per 1,000 older residents of <strong>New</strong> <strong>York</strong> <strong>State</strong> for any form of elderabuse was found.■ The cumulative prevalence of any form of non-financial elder mistreatment was 46.2 per thousandsubjects studied in <strong>the</strong> year preceding <strong>the</strong> survey.■ The highest rate of mistreatment occurred for major financial exploitation (<strong>the</strong>ft of money orproperty, using items without permission, impersonation to get access, forcing or misleading to getitems such as money, bank cards, accounts, power of attorney) with a rate of 41 per 1,000 surveyed.This rate reflects respondent reports of financial abuse that occured in <strong>the</strong> year preceding <strong>the</strong> survey.(The rate for moderate financial exploitation, i.e. discontinuing contributions to household financesin spite of agreement to do so, constituted ano<strong>the</strong>r 1 per 1,000 surveyed.)■ The study also found that 141 out of 1,000 older <strong>New</strong> <strong>York</strong>ers have experienced an elder abuse eventsince turning age 60.S e l f R e p o r t e d P r e v a l e n c e a n d D o c u m e n t e d C a s e S u r v e y s F i n a l R e p o r t 2 0 1 1 | 3
DOCUMENTED CASE STUDYMajor findings of <strong>the</strong> Documented Case <strong>Study</strong> include:■ Adjusting for possible duplication of victims served by more than one program, <strong>the</strong> study determinedthat in a one-year period 11,432 victims were served throughout <strong>New</strong> <strong>York</strong> <strong>State</strong>, yielding a rate of3.24 elder abuse victims served per 1,000 older adults.■ Rates of documented elder abuse varied by region. The highest rate was in <strong>New</strong> <strong>York</strong> City (3.79 reportedcases per 1,000 older adult residents) compared to <strong>the</strong> region with <strong>the</strong> lowest rate of documentedcases, Central <strong>New</strong> <strong>York</strong> /Sou<strong>the</strong>rn Tier (2.30 cases per 1,000).■ Variability in data collection across service systems contributed to <strong>the</strong> large gap uncovered between <strong>the</strong>number of cases reported through <strong>the</strong> Documented Case <strong>Study</strong> and <strong>the</strong> prevalence rates found in <strong>the</strong>Self-Reported <strong>Study</strong>. The extent to which <strong>the</strong> gap can be attributed to data collection issues amongservice systems has not been established.■ While <strong>the</strong>re was little difference among urban, suburban and rural counties in types of abuse reportedin <strong>the</strong> Documented Case Survey (for all regions, emotional abuse is <strong>the</strong> most common abuse categoryreported), urban areas tend to have higher documented case rates than rural counties.4 | U n d e r t h e R a d a r : N e w Y o r k S t a t e E l d e r A b u s e P r e v a l e n c e S t u d y
Table BVictim Demographic InformationComparison of Documented Case Data and Self Reported DataDocumented Case <strong>Study</strong>Self-Reported <strong>Study</strong>Information about victims Percent of Victims Percent of VictimsAge groups60-64 17.0 20.365-74 41.9 38.075-84 28.1 29.185+ 13.0 12.7(Missing) 14.9 0.0GenderMale 32.8 35.8Female 67.2 64.2(Missing) 13.8 0.0Race/EthnicityAfrican American 27.9 26.3Asian/Pacific Islander 3.0 1.6Caucasian 69.3 65.5Hispanic/Latino 16.4 7.6Native American/Aleut Eskimo 0.8 1.9Race, o<strong>the</strong>r 10.5 2.9(Missing) 50.8 1.9<strong>Under</strong> Race/Ethnicity, it should be noted that in <strong>the</strong> Documented Case <strong>Study</strong>, some agencies permittedelder abuse victims to declare more than one ethnic category; as a result <strong>the</strong> sum of percentages exceeds 100. In<strong>the</strong> Self-Reported <strong>Study</strong> column, respondents who self identified as Hispanic/Latino in addition to ano<strong>the</strong>rcategory are reported in a separate statistic (7.6%). As a result, <strong>the</strong> sum of all categories again exceeds 100 percent.Note that in Table B, “Missing” in <strong>the</strong> Documented Case <strong>Study</strong> column indicates <strong>the</strong> percentage of casesin which responding organizations were unable to supply <strong>the</strong> data requested. In <strong>the</strong> Self-Reported <strong>Study</strong>column, “Missing” indicates <strong>the</strong> percentage of telephone survey respondents who declined to supply <strong>the</strong>requested information.The comparison of demographic data in Table B reveals similar trends in both <strong>the</strong> Self-Reported andDocumented Case data except in <strong>the</strong> area of Race/Ethnicity. The percentage of Hispanic/Latino and Asian/PacificIslander victims served by Documented Case <strong>Study</strong> respondent organizations was approximately twice <strong>the</strong>percentage of Self-Reported <strong>Study</strong> respondents who self-identified as Hispanic/Latino or Asian/Pacific Islander.On <strong>the</strong> o<strong>the</strong>r hand, Native Americans/Aleut Eskimos were represented in <strong>the</strong> Documented Case findings at lessthan half <strong>the</strong> rate <strong>the</strong>y were found in <strong>the</strong> Self-Reported <strong>Study</strong>. It should also be noted, however, that respondingorganizations in <strong>the</strong> Documented Case <strong>Study</strong> were as a whole unable to provide racial/ethnic data in half of<strong>the</strong> cases.S e l f R e p o r t e d P r e v a l e n c e a n d D o c u m e n t e d C a s e S u r v e y s F i n a l R e p o r t 2 0 1 1 | 5
CONCLUSIONSWhile <strong>the</strong> <strong>Prevalence</strong> <strong>Study</strong> did not attempt to analyze <strong>the</strong> reasons for <strong>the</strong> disparity in self-reported versusdocumented elder abuse, some possible explanations can be offered. Considerable variability in documentationsystems may play a role in <strong>the</strong> results. The Documented Case <strong>Study</strong> found a great deal of variability in <strong>the</strong> wayservice systems and individual organizations collect data in elder abuse cases. Some service systems and someregions may lack <strong>the</strong> resources to integrate elder abuse elements in data collection systems or may simply nothave an adequate elder abuse focus in <strong>the</strong>ir data collection. Population density, <strong>the</strong> visibility of older adults in<strong>the</strong> community and, conversely, social isolation in rural areas may contribute to differences in referral rate trendsbased on geography. Greater awareness by individuals, both lay and professional, who have contact with olderadults and might observe <strong>the</strong> signs and symptoms of elder abuse, may also explain higher referral rates in some areas.The <strong>New</strong> <strong>York</strong> <strong>State</strong> <strong>Elder</strong> <strong>Abuse</strong> <strong>Prevalence</strong> <strong>Study</strong> uncovered a large number of older adults for whomelder abuse is a reality but who remain “under <strong>the</strong> radar” of <strong>the</strong> community response system set up toassist <strong>the</strong>m.The findings of <strong>the</strong> <strong>New</strong> <strong>York</strong> <strong>State</strong> <strong>Elder</strong> <strong>Abuse</strong> <strong>Prevalence</strong> <strong>Study</strong> suggest that attention should be paid to<strong>the</strong> following issues in elder abuse services:■ Consistency and adequacy in <strong>the</strong> collection of data regarding elder abuse cases across service systems.Sound and complete data sets regarding elder abuse cases are essential for case planning and programplanning, reliable program evaluation and resource allocation.■ Emphasis on cross-system collaboration to ensure that limited resources are used wisely to identify andserve elder abuse victims.■ Greater focus on prevention and intervention in those forms of elder abuse reported by elders to bemost prevalent, in particular, financial exploitation.■ Promotion of public and professional awareness through education campaigns and training concerning<strong>the</strong> signs of elder abuse and <strong>the</strong> resources available to assist older adults who are being mistreated bytrusted individuals.IMPLICATIONS FOR FOLLOW UP AND FURTHER STUDYFor <strong>the</strong> first time, a scientifically rigorous estimate of <strong>the</strong> prevalence of elder abuse in <strong>New</strong> <strong>York</strong> <strong>State</strong> has beenestablished. The study also provides an estimate of <strong>the</strong> number of cases that receive intervention in a one-yearperiod throughout <strong>the</strong> state. The study raises many questions about differences in rates of abuse in variousregions, about referral rates by region and about how elder abuse data is recorded. Fur<strong>the</strong>r exploration of <strong>the</strong>seissues in future research studies is warranted.The findings also serve as a platform for more informed decision making about policy, use of limitedresources and models of service provision for <strong>the</strong> thousands of older <strong>New</strong> <strong>York</strong>ers whose safety, quality of lifeand dignity are compromised each year by elder mistreatment.6 | U n d e r t h e R a d a r : N e w Y o r k S t a t e E l d e r A b u s e P r e v a l e n c e S t u d y
NEW YORK STATE ELDER ABUSE PREVALENCE STUDYINTRODUCTIONThis report describes one of <strong>the</strong> most ambitious and comprehensive studies to quantify <strong>the</strong>extent of elder abuse in a discrete jurisdiction ever attempted, and certainly <strong>the</strong> largest in anysingle American state. With funding from <strong>the</strong> <strong>New</strong> <strong>York</strong> <strong>State</strong> Children and Family TrustFund, three community, governmental, and academic partners — Lifespan of Greater Rochester, <strong>the</strong><strong>New</strong> <strong>York</strong> City Department for <strong>the</strong> Aging, and <strong>the</strong> Weill Cornell Medical College — entered into aunique collaborative partnership to understand <strong>the</strong> magnitude and impact of elder abuse in <strong>New</strong> <strong>York</strong><strong>State</strong>, aided by countless o<strong>the</strong>r dedicated state agencies, non-governmental organizations, universities,and individuals.The study had three central aims achieved through two separate study components:1. To estimate <strong>the</strong> prevalence of various forms of elder abuse in a large, representative, statewide sample ofcommunity-dwelling, older <strong>New</strong> <strong>York</strong>ers through direct subject interviews (hereafter referred to as <strong>the</strong>Self-Reported <strong>Prevalence</strong> <strong>Study</strong>)2. To estimate <strong>the</strong> number of elder abuse cases coming to <strong>the</strong> attention of all agencies and programs responsiblefor serving elder abuse victims in <strong>New</strong> <strong>York</strong> <strong>State</strong> in a one-year period (hereafter referred to as <strong>the</strong>Documented Case <strong>Study</strong>), and3. To compare rates of elder abuse in <strong>the</strong> two component studies, permitting a comparison of “known” to“hidden” cases, and <strong>the</strong>reby determining an estimate of <strong>the</strong> rate of elder abuse underreporting in <strong>New</strong> <strong>York</strong> <strong>State</strong>.This report describes <strong>the</strong> state of elder abuse services in <strong>New</strong> <strong>York</strong> <strong>State</strong>, <strong>the</strong> methodology applied in bothcomponents of <strong>the</strong> study, <strong>the</strong> findings of <strong>the</strong> study and <strong>the</strong> extent to which <strong>the</strong> findings address <strong>the</strong> originalresearch goals of <strong>the</strong> study. The report also draws conclusions based on <strong>the</strong> data and offers some implicationsfor future elder abuse research and for services for maltreated elders in <strong>New</strong> <strong>York</strong> <strong>State</strong>.BACKGROUND<strong>Elder</strong> abuse and neglect (also known as elder mistreatment) is an insidious and tragic social problem that affectsa significant number of older adults. Often a hidden and unreported phenomenon, over <strong>the</strong> past twenty yearselder abuse has been increasingly recognized, both nationally and internationally, as a serious social problem.Mistreatment of older adults has joined economic insecurity, chronic disease and cognitive impairment asrecognized major threats to <strong>the</strong> health and general welfare of individuals in <strong>the</strong> second half of life.Several factors have prompted <strong>the</strong> increased attention to elder mistreatment by gerontologists, publichealth specialists and social service planners. Rapidly changing demographics in <strong>the</strong> US and in many o<strong>the</strong>rS e l f R e p o r t e d P r e v a l e n c e a n d D o c u m e n t e d C a s e S u r v e y s F i n a l R e p o r t 2 0 1 1 | 7
countries have led to <strong>the</strong> realization that aging issues, including elder mistreatment, must figure prominently insocial planning. In many societies, including <strong>the</strong> US, <strong>the</strong> number of older adults is steadily increasing and in <strong>the</strong>next few decades will surpass <strong>the</strong> number of minor youth in <strong>the</strong> population. The absolute number of mistreatedindividuals is thus expected to increase, challenging health and social service systems that are often unpreparedto respond to <strong>the</strong>ir needs adequately. Professionals who work with abused older adults and researchers whospecialize in gerontological issues have also highlighted <strong>the</strong> dramatic ways in which elder mistreatment canaffect <strong>the</strong> health, safety and quality of life of older people.<strong>Elder</strong> abuse can have potentially devastating effects on <strong>the</strong> lives of older adults. Injuries sustained by a frailolder adult can have much more tragic consequences than similar injuries inflicted on a younger person.Physical abuse can result in nursing home placement, permanent disability or even death.Financial exploitation can deprive older adults of resources needed for <strong>the</strong> necessities of life. Unlikeyounger people who lose assets or resources, older adults have less time and opportunity to recover fromfinancial losses. An unexpected finding of a longitudinal study published in 1998 was that older adults who havebeen subjected to any form of mistreatment are three times more likely to die within three years than elders ofsimilar age and medical and social circumstances who have not been mistreated (Lachs & Pillemer, 1998).Advocacy by those committed to preserving <strong>the</strong> health, safety and independence of older adults has also servedto focus attention on <strong>the</strong> issue of elder abuse.ELDER ABUSE DEFINEDWhile historically definitions of elder mistreatment have varied widely, <strong>the</strong>re has recently been more consensus,promulgated by a National Academy of Sciences Panel, on a definition that includes <strong>the</strong> notion of a trustingrelationship in which <strong>the</strong> trust of <strong>the</strong> older victim is violated (Bonnie, R.J., Wallace, R.B., 2002). The goal of <strong>the</strong><strong>New</strong> <strong>York</strong> <strong>State</strong> <strong>Elder</strong> <strong>Abuse</strong> <strong>Prevalence</strong> <strong>Study</strong> was to capture data on elder mistreatment subsuming this idea infour general domains: (1) Neglect of a responsible caretaker in meeting ADL (Activities of Daily Living) and/orIADL (Instrumental Activities of Daily Living) assistance, (2) Financial Exploitation, (3) Psychological and (4)Physical <strong>Elder</strong> <strong>Abuse</strong> (including Sexual <strong>Abuse</strong>). (It should be noted that psychological abuse is also sometimesreferred to as “emotional” or “verbal” abuse.)<strong>New</strong> <strong>York</strong> <strong>State</strong> Social Services Law also contains a definition of adult abuse which guides Adult ProtectiveServices (APS) practice throughout <strong>the</strong> state. For purposes of APS, <strong>the</strong> definition applies to persons over 18 anddoes not require a “trusted” person to be <strong>the</strong> perpetrator in every case. Since <strong>the</strong> study population was confinedto older residents of <strong>New</strong> <strong>York</strong> <strong>State</strong>, <strong>the</strong> research team applied <strong>the</strong> definitions contained in <strong>the</strong> law in itsoperational definition of elder mistreatment in <strong>the</strong> survey instruments for both <strong>the</strong> Self-Reported andDocumented Case studies; however, inclusion in <strong>the</strong> study was limited to those situations in which a “trustedindividual” was <strong>the</strong> perpetrator of elder abuse. Respondents were asked to apply <strong>the</strong> definitions to situations inwhich victims were over age 60 and in which <strong>the</strong> elder abuse victim was in a “trusting relationship” with <strong>the</strong>perpetrator. It should be noted, however, that <strong>the</strong> data submitted for <strong>the</strong> Documented Case <strong>Study</strong> from <strong>the</strong>database used to collect case data by Adult Protective Services in <strong>New</strong> <strong>York</strong> <strong>State</strong> included cases of mistreatmentperpetrated by third parties not considered “trusted” persons. There was no way to disaggregate data about8 | U n d e r t h e R a d a r : N e w Y o r k S t a t e E l d e r A b u s e P r e v a l e n c e S t u d y
“trusted” perpetrators and those that did not meet this definition. Following are <strong>the</strong> definitions for eachcategory of abuse contained in <strong>New</strong> <strong>York</strong> <strong>State</strong> Social Services Law, Article 9B, Adult Protective Services, Section473(6) Definitions.Physical <strong>Abuse</strong>The non-accidental use of force that results in bodily injury, pain or impairment, including but not limited to,being slapped, burned, cut, bruised or improperly restrained.Sexual <strong>Abuse</strong>Non-consensual contact of any kind, including but not limited to, forcing sexual contact or forcing sex with athird party.Emotional <strong>Abuse</strong>Willful infliction of mental or emotional anguish by threat, humiliation, intimidation or o<strong>the</strong>r abusive conduct,including but not limited to, frightening or intimidating an adult.Active NeglectActive neglect means willful failure by <strong>the</strong> caregiver to fulfill <strong>the</strong> care-taking function and responsibilitiesassumed by <strong>the</strong> caregiver, including but not limited to, abandonment, willful deprivation of food, water, heat,clean clothing and bedding, eyeglasses or dentures, or health-related services.Passive NeglectPassive neglect means <strong>the</strong> non-willful failure of a caregiver to fulfill care-taking functions and responsibilitiesassumed by <strong>the</strong> caregiver, including but not limited to, abandonment or denial of food or health-related servicesbecause of inadequate caregiver knowledge, infirmity or disputing <strong>the</strong> value of prescribed services.Financial ExploitationImproper use of an older adult’s funds, property or resources by ano<strong>the</strong>r individual, including but not limitedto, fraud, false pretense, embezzlement, conspiracy, forgery, falsifying records, coerced property transfers ordenial of access to assets.Self neglect, also defined in <strong>the</strong> statute, was not included in <strong>the</strong> scope of this study. It should also be notedthat <strong>the</strong> study was limited to older adults residing in <strong>the</strong> community and did not include residents of licensedcare facilities such as Adult Care Homes and Skilled Nursing Facilities.S e l f R e p o r t e d P r e v a l e n c e a n d D o c u m e n t e d C a s e S u r v e y s F i n a l R e p o r t 2 0 1 1 | 9
IMPETUS FOR THE STUDYIn 2004 Lifespan of Greater Rochester, a not-for-profit social agency serving older adults in upstate <strong>New</strong> <strong>York</strong>,convened <strong>the</strong> first comprehensive statewide summit on elder abuse in <strong>the</strong> nation. In collaboration with stateagencies and a private health insurer, Lifespan organized <strong>the</strong> summit event which brought over 100 experts inelder abuse and aging services to <strong>the</strong> state capital, Albany, to discuss <strong>the</strong> state of elder abuse services in <strong>New</strong> <strong>York</strong><strong>State</strong> and to forge a prioritized set of recommendations regarding elder abuse policy and services for <strong>the</strong> state.The 2004 <strong>New</strong> <strong>York</strong> <strong>Elder</strong> <strong>Abuse</strong> Summit resulted in <strong>the</strong> formulation of a statewide Action Agenda. The firstpriority recommendation focused on changing laws around elder abuse. The second priority read “Conduct astatewide research study to define <strong>the</strong> nature and scope of elder abuse, establish <strong>the</strong> baseline of prevalence andincidence, and develop a methodology for ongoing data collection and analysis for purposes of policy, planning,program development and evaluation.” There was general consensus among Summit participants that <strong>the</strong> trueextent of <strong>the</strong> problem in <strong>New</strong> <strong>York</strong> was unknown owing to several factors, including:■ inconsistent requirements for some agencies to keep and report statistics on elder abuse■ inconsistency among organizations that serve elder abuse victims in <strong>the</strong> collection and tracking of dataconcerning elder abuse cases throughout <strong>the</strong> state■ <strong>the</strong> conviction, based on professional work experience, that elder abuse is underreported and underprosecuted■ reluctance of victims to seek help out of shame, fear and lack of awareness of avenues for assistanceand support.There was also consensus that true change in systems and in policy can only be effected if hard dataabout <strong>the</strong> number of older adults who have fallen victim to elder mistreatment was determined in a scientificallyvalid way.In 2007 <strong>the</strong> <strong>New</strong> <strong>York</strong> <strong>State</strong> Children and Family Trust Fund, a program of <strong>the</strong> <strong>New</strong> <strong>York</strong> <strong>State</strong> Office ofChildren and Family Services, offered funding to conduct a study on <strong>the</strong> prevalence of elder abuse in <strong>New</strong> <strong>York</strong><strong>State</strong>. For over two decades this fund has provided start up resources for programs to prevent child abuse; <strong>the</strong>Trust Fund is unique among such funds in <strong>the</strong> nation in also supporting elder abuse initiatives. Lifespan ofGreater Rochester was selected by <strong>the</strong> Trust Fund to act as <strong>the</strong> lead agency in a collaborative partnership toconduct a comprehensive study of <strong>the</strong> prevalence of elder abuse in <strong>New</strong> <strong>York</strong>. The partnership involved a uniqueresearch collaboration between a community agency, academia and a government department (Lifespan, WeillCornell Medical Center and <strong>New</strong> <strong>York</strong> City Department for <strong>the</strong> Aging).THE SIGNIFICANCE OF THE STUDYThe <strong>New</strong> <strong>York</strong> <strong>State</strong> <strong>Elder</strong> <strong>Abuse</strong> <strong>Prevalence</strong> <strong>Study</strong> is groundbreaking in several ways. It is <strong>the</strong> first scientificallyrigorous survey of prevalence rates of elder mistreatment of community-dwelling older adults in an entire statethat includes older adults age 60 years and above and focuses specifically on abuse, neglect and financialexploitation by family members and trusted o<strong>the</strong>rs. It also concurrently utilizes statewide elder abuse data at <strong>the</strong>10 | U n d e r t h e R a d a r : N e w Y o r k S t a t e E l d e r A b u s e P r e v a l e n c e S t u d y
county level, ascertained through multiple service systems across <strong>the</strong> state that may come into contact with andprovide services to elder abuse victims and <strong>the</strong>ir families. Unlike some national studies, it does not include selfneglect.It provides information on elder abuse on a statewide basis as well as by region, and by rural, suburbanand urban areas.Finally, it is <strong>the</strong> first statewide study that compares self-reported data to documented case data over <strong>the</strong>same secular period; data was collected from multiple service systems statewide for cases of mistreatmentoccurring during a recent one-year period (2008), ensuring that findings are both timely and concurrent with<strong>the</strong> self-reported prevalence component of <strong>the</strong> study. This, <strong>the</strong>refore, allows a comparison of mistreatment ratesreported by subjects <strong>the</strong>mselves and those represented by cases that became known to official entities. Thefindings also permit quantification of <strong>the</strong> gap between cases “reported to agencies” and self-identified cases.Both components of <strong>the</strong> study are also among <strong>the</strong> largest to date in terms of sample size.Both <strong>the</strong> self-reported and officially documented components of <strong>the</strong> study serve as baselines for futurepolicy and funding decisions, service development and for future research into this significant social andpublic health problem.PREVIOUS STUDIES AND SURVEYS OF PREVALENCEAND DOCUMENTED CASESNational StudiesSeveral significant studies have attempted to estimate prevalence rates of elder abuse in <strong>the</strong> US or in selectedregions. Prior estimates of <strong>the</strong> prevalence of elder abuse range from 2% to 10% of all adults over 60 years of agebased on various sampling, survey methods and case definitions (Lachs & Pillemer, 2004).In 1988 Karl Pillemer and David Finkelhor conducted a seminal study of <strong>the</strong> prevalence of mistreatmentof older adults living in <strong>the</strong> Boston area. Using a random digit dialing sampling strategy, <strong>the</strong> investigatorsdetermined an overall prevalence rate of 32 older adults per thousand individuals interviewed since turning 65years of age. The study covered physical violence, verbal aggression and neglect but did not address financialexploitation (Pillemer & Finkelhor, 1988).A national study conducted in 2008 estimated prevalence and assessed correlates of emotional, physical,sexual and financial mistreatment and potential neglect (defined as an identified need for assistance that no onewas actively addressing) of adults aged 60 years or older in a randomly selected national sample (Acierno,Hernandez, et al., 2010). The researchers compiled a representative sample by random digit dialing acrossgeographic strata. Using computer-assisted telephone interviewing to standardize collection of demographic,risk factor and mistreatment information, data from 5,777 respondents was analyzed. A one-year incidence rateof 4.6% was established for emotional abuse, 1.6% for physical abuse, 0.6% for sexual abuse, 5.1% for potentialneglect and 5.2% for current financial abuse by a family member.S e l f R e p o r t e d P r e v a l e n c e a n d D o c u m e n t e d C a s e S u r v e y s F i n a l R e p o r t 2 0 1 1 | 11
In 2009 <strong>the</strong> MetLife Mature Market Institute published <strong>the</strong> results of a study focusing on financialexploitation of older adults in <strong>the</strong> US. The study concluded that a conservative estimate of <strong>the</strong> personal cost tovictims was $2.6 billion annually. The study also estimated that only one in five cases of financial exploitation isactually reported. MetLife found that elder financial abuse accounts for 30 to 50 percent of all forms of elder abuseand that financial exploitation also occurs with o<strong>the</strong>r forms of abuse (MetLife Mature Market Institute, 2009).In 1998 <strong>the</strong> National Center on <strong>Elder</strong> <strong>Abuse</strong> at <strong>the</strong> American Public Human Services Association published<strong>the</strong> results of an innovative national study of elder abuse. The National <strong>Elder</strong> <strong>Abuse</strong> Incidence <strong>Study</strong> confirmedwhat elder abuse experts had long believed: reported elder abuse cases make up only <strong>the</strong> “tip of <strong>the</strong> iceberg.” Thestudy estimated that 450,000 older adults in domestic settings in <strong>the</strong> US were newly abused, neglected, and/orexploited in 1996. The study also found that for every reported incident of elder abuse, neglect, exploitation orself-neglect, approximately five go unreported. (National Center on <strong>Elder</strong> <strong>Abuse</strong>, 1998).The 2004 Survey of <strong>State</strong> Adult Protective Services was conducted by <strong>the</strong> National Center on <strong>Elder</strong> <strong>Abuse</strong>,with oversight by <strong>the</strong> National Committee for <strong>the</strong> Prevention of <strong>Elder</strong> <strong>Abuse</strong> and <strong>the</strong> National Adult ProtectiveServices Association. The 2004 survey collected 2003 fiscal year data from all 50 states, Guam and <strong>the</strong> District ofColumbia. Of <strong>the</strong> states sampled, at least 2/3 were able to separate out reports of elder abuse from vulnerableadult abuse. From <strong>the</strong> 32 states that responded, <strong>the</strong>re were 253,426 incidents involving elder abuse. This represented8.3 reports of abuse for every 1,000 older adults in America. The study included self-neglect as a type of elderabuse, which was <strong>the</strong> most prevalent type of abuse reported by <strong>the</strong> study (Teaster & Otto, 2006).Studies in <strong>New</strong> <strong>York</strong> <strong>State</strong>Prior to <strong>the</strong> <strong>New</strong> <strong>York</strong> <strong>State</strong> <strong>Elder</strong> <strong>Abuse</strong> <strong>Prevalence</strong> <strong>Study</strong> <strong>the</strong>re had been no rigorous statewide research studiesof <strong>the</strong> extent of elder abuse in <strong>the</strong> state; however, some regional studies and needs assessments had beenconducted. A study of elder abuse using case record data from <strong>the</strong> <strong>New</strong> <strong>York</strong> <strong>State</strong> Adult Protective Servicessystem was undertaken by Abelman in 1997. A random sample of 250 cases was drawn from case listings of casesserved during 1995. The sample represented approximately 10% of <strong>the</strong> cases initially authorized for APS during<strong>the</strong> study period. For this age group, 65 and over, financial exploitation was identified as <strong>the</strong> most prevalentform of abuse (62% of cases), followed by caregiver neglect (56%), emotional abuse (34%), and physical abuse(22%) (Abelman,1997).Within <strong>New</strong> <strong>York</strong> City, a study of all incidents of elder abuse perpetrated by adult children against olderadult parents reported to <strong>the</strong> <strong>New</strong> <strong>York</strong> City Police Department (NYPD) in Manhattan in 1992 was completedby Brownell in 1998. As part of this study, utilizing secondary data provided by <strong>the</strong> NYPD, crimes defined by <strong>the</strong><strong>New</strong> <strong>York</strong> Penal Law were recoded into elder abuse categories. A total of 314 complaint reports were analyzed,with 295 reports reflecting elder abuse as defined by <strong>the</strong> criteria that a person aged 60 years or older was <strong>the</strong>victim of physical, psychological or financial abuse by an offspring. Alleged crimes reflecting psychologicalabuse were <strong>the</strong> most prevalent (35.7%), compared to alleged crimes reflecting financial abuse (33.6%) andphysical abuse (30.7%) (Brownell,1998).12 | U n d e r t h e R a d a r : N e w Y o r k S t a t e E l d e r A b u s e P r e v a l e n c e S t u d y
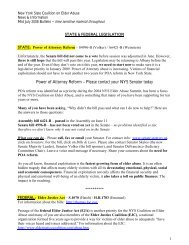
A survey conducted by <strong>the</strong> Monroe County Department of Health for <strong>the</strong> Older Adult and Adult HealthReport Card in <strong>the</strong> Rochester, <strong>New</strong> <strong>York</strong> area in September 2008 found that 8% of older adults in MonroeCounty reported having been a victim of abuse since turning 60 (Monroe County, 2008).NEW YORK STATE DEMOGRAPHICSTo fully appreciate <strong>the</strong> findings of <strong>the</strong> study and <strong>the</strong>ir implications for elder abuse services in <strong>New</strong> <strong>York</strong>, it isimportant to understand <strong>the</strong> nature of <strong>the</strong> population of older adults who currently make <strong>the</strong>ir home in <strong>the</strong>state. <strong>New</strong> <strong>York</strong> <strong>State</strong> is <strong>the</strong> third most populous state in <strong>the</strong> nation with a 2009-estimated population of19,541,453 (US Census, American Fact Finder). In 2008, 18.2% of <strong>the</strong> total population of <strong>the</strong> state was over 60(over 3.5 million individuals); 13.2% were over 65. <strong>New</strong> <strong>York</strong>’s older population is growing both in percentageof <strong>the</strong> population and in absolute number. It is anticipated that by 2020, over 22% of <strong>the</strong> population of <strong>the</strong> statewill be over 60 (cf. Figure 1). Within <strong>the</strong> next 25 years <strong>the</strong> number of elders in <strong>the</strong> state (over 62) will surpass<strong>the</strong> number of minor youth (under 18) following <strong>the</strong> trend of o<strong>the</strong>r areas in <strong>the</strong> US and o<strong>the</strong>r developed nations(US Census Bureau, US Population Projections). <strong>New</strong> <strong>York</strong>’s older adult population is currently <strong>the</strong> third largestin <strong>the</strong> US, surpassed only by California and Florida.Figure 1<strong>New</strong> <strong>York</strong> <strong>State</strong>Resident Population – 60+ years of agePopulation 1990-2030Numbers in thousands (US Census Bureau-American Fact Finder)5,0004,0003,0002,0001,0000Population 60+ years of age as % of total population:1990 2000 2010 2020 203017.7% 16.9% 19.0% 22.7% 25.7%S e l f R e p o r t e d P r e v a l e n c e a n d D o c u m e n t e d C a s e S u r v e y s F i n a l R e p o r t 2 0 1 1 | 13
The state is large geographically and ethnically diverse. The major population center is <strong>the</strong> <strong>New</strong> <strong>York</strong> Cityregion, <strong>the</strong> largest metropolitan and economic center in <strong>the</strong> state as well as in <strong>the</strong> nation. <strong>New</strong> <strong>York</strong> alone ishome to over eight million people. Over 1.3 million <strong>New</strong> <strong>York</strong> City residents are age 60 or older. By 2030, thisage group will increase by nearly a half million people to 1.8 million (<strong>New</strong> <strong>York</strong> City Department of Planning,2006). Nearly half of today’s older <strong>New</strong> <strong>York</strong>er City residents are members of racial and ethnic minority groups(<strong>New</strong> <strong>York</strong> Academy of Medicine, 2008).Some counties are affected more than o<strong>the</strong>rs by rapid growth among <strong>the</strong> state’s minority elderly population.Minority elderly reside disproportionately in <strong>New</strong> <strong>York</strong> City and o<strong>the</strong>r metropolitan counties of <strong>the</strong> <strong>State</strong>.According to <strong>the</strong> 2000 Census, of <strong>the</strong> state’s minority age 60 and older population:■ 77.2% live in <strong>the</strong> five counties of <strong>New</strong> <strong>York</strong> City, comprising 46.6 percent of <strong>the</strong> city’s age 60 and olderpopulation; and,■ 17.9% live in <strong>the</strong> seven counties of Erie, Monroe, Nassau, Orange, Rockland, Suffolk and Westchester,comprising 10 percent or more of each county’s age 60 and older population.In total, 95.1 percent of <strong>the</strong> <strong>State</strong>’s minority elderly live in <strong>the</strong> aforementioned twelve counties while only4.9 percent live in <strong>the</strong> o<strong>the</strong>r fifty counties of <strong>the</strong> <strong>State</strong> (<strong>New</strong> <strong>York</strong> <strong>State</strong> Office for <strong>the</strong> Aging, 2000). There are alsoseven federally-recognized Native American nations scattered across <strong>New</strong> <strong>York</strong> <strong>State</strong> with a total population inexcess of 50,000 (US Census Bureau, 2006-2008 American Community Survey, Selected Population Profile in<strong>the</strong> US: <strong>New</strong> <strong>York</strong>).The unique demographic patterns in <strong>the</strong> state as well <strong>the</strong> tremendous cultural diversity represented in<strong>the</strong> elder population pose special research challenges in any attempt to determine <strong>the</strong> true prevalence ofmistreatment in <strong>the</strong> state’s older adult population.RESEARCH PARTNERSThe <strong>Prevalence</strong> <strong>Study</strong> was accomplished through <strong>the</strong> collaboration of three organizations representing academia,government and <strong>the</strong> not-for profit aging services sector.Lifespan of Greater Rochester Inc.Lifespan of Greater Rochester is a not-for-profit social agency that provides a full continuum of non-medicalaging services to support older adults in taking on <strong>the</strong> challenges and opportunities of longer life. Lifespan wasfounded in 1971; for 40 years, <strong>the</strong> agency has been a leader in planning and delivering aging services in MonroeCounty, <strong>New</strong> <strong>York</strong> and <strong>the</strong> surrounding Finger Lakes counties. The agency currently operates 30+ programsincluding <strong>the</strong> <strong>Elder</strong> <strong>Abuse</strong> Prevention Program (EAPP). In 2010 Lifespan served over 25,000 clients. The agencyhas had extensive experience serving elder abuse victims in <strong>New</strong> <strong>York</strong> and is recognized as a leader in <strong>the</strong> field ofelder abuse. The EAPP program, initiated in 1987, was one of <strong>the</strong> first non-governmental agencies to specializein elder abuse. Lifespan also coordinates <strong>the</strong> <strong>New</strong> <strong>York</strong> <strong>State</strong> Coalition on <strong>Elder</strong> <strong>Abuse</strong>.14 | U n d e r t h e R a d a r : N e w Y o r k S t a t e E l d e r A b u s e P r e v a l e n c e S t u d y
Weill Cornell Medical CollegeFounded in 1898, Weill Cornell Medical College is affiliated with what is now <strong>New</strong> <strong>York</strong>-Presbyterian Hospital.Weill Cornell Medical College is among <strong>the</strong> top-ranked medical schools in <strong>the</strong> country and <strong>New</strong> <strong>York</strong>Presbyterian Hospital is consistently ranked as among <strong>the</strong> top ten in <strong>the</strong> nation by US <strong>New</strong>s and World Report.In 2009 <strong>New</strong> <strong>York</strong>-Presbyterian Hospital/Weill Cornell Medical Center launched <strong>the</strong> <strong>New</strong> <strong>York</strong> City <strong>Elder</strong> <strong>Abuse</strong>Center in order to improve identification and treatment of elder abuse victims in <strong>the</strong> <strong>New</strong> <strong>York</strong> City area. Thisis <strong>the</strong> first such center in <strong>the</strong> <strong>New</strong> <strong>York</strong> area to focus on coordinating elder abuse intervention.<strong>New</strong> <strong>York</strong> City Department for <strong>the</strong> AgingThe <strong>New</strong> <strong>York</strong> City Department for <strong>the</strong> Aging (DFTA) is <strong>the</strong> only <strong>New</strong> <strong>York</strong> City municipal agency dedicatedsolely to representing and serving <strong>New</strong> <strong>York</strong> City’s elderly. It is also <strong>the</strong> largest Area Agency on Aging in <strong>the</strong>nation. The Department provides an array of services to older <strong>New</strong> <strong>York</strong>ers directly and through a network ofcommunity partners. DFTA’s <strong>Elder</strong>ly Crime Victims Resource Center, funded by <strong>the</strong> <strong>New</strong> <strong>York</strong> <strong>State</strong> Officeof Victim Services, has been providing direct services to elder abuse victims to break <strong>the</strong> pattern of domesticviolence and financial and emotional abuse since 1986. The Center also offers case consultation, technicalassistance and workshops to community agencies and law enforcement. DFTA was instrumental in <strong>the</strong> creation anddevelopment of <strong>the</strong> <strong>New</strong> <strong>York</strong> City <strong>Elder</strong> <strong>Abuse</strong> Network (NYCEAN); <strong>the</strong> agency remains an active member ofNYCEAN through participation by <strong>the</strong> Center.The research partners also convened an Advisory Committee comprised of experts in elder abuse andaging services in <strong>New</strong> <strong>York</strong> <strong>State</strong> as well as key representatives from each of <strong>the</strong> service systems surveyed in <strong>the</strong> study.The Advisory Committee provided consultation on <strong>the</strong> design and conduct of <strong>the</strong> study as well as guidance inobtaining access to entities serving elder abuse victims.RESEARCH CHALLENGESEach of <strong>the</strong> two components of <strong>the</strong> study had unique challenges.Self-Reported <strong>Prevalence</strong> <strong>Study</strong>: For <strong>the</strong> Self-Reported <strong>Prevalence</strong> <strong>Study</strong> to be a valid measure of <strong>the</strong> experienceof older adults with elder mistreatment, <strong>the</strong> researchers needed to:■ Devise a survey instrument that would adequately cover all forms of elder mistreatment (with <strong>the</strong>exception of self neglect), that would encourage respondents to respond truthfully and that would notbe an excessive burden on <strong>the</strong> respondent.■ Reach a sufficient sample of older adults willing to consent to respond to a lengthy questionnaire.■ Obtain a cross section of people in all geographic areas of <strong>the</strong> state to be able to determine elder abusedata for each region and make comparisons between regions.■ Take into account <strong>the</strong> ethnic and linguistic diversity in <strong>the</strong> state.S e l f R e p o r t e d P r e v a l e n c e a n d D o c u m e n t e d C a s e S u r v e y s F i n a l R e p o r t 2 0 1 1 | 15
■ Take into consideration <strong>the</strong> reality that some older adult respondents might have cognitive impairmentsthat would prevent <strong>the</strong>m from accurately responding to inquiries about personal history.■ Include a protocol to protect <strong>the</strong> safety of respondents and offer referrals for assistance if researchersuncovered cases of active mistreatment.Documented Case <strong>Study</strong>: The Documented Case <strong>Study</strong> component of <strong>the</strong> <strong>New</strong> <strong>York</strong> <strong>State</strong> <strong>Elder</strong> <strong>Abuse</strong> <strong>Study</strong>successfully addressed a number of similar challenges as well. These included <strong>the</strong> need to:■ Create a survey instrument that, as in <strong>the</strong> Self-Reported <strong>Prevalence</strong> <strong>Study</strong>, would adequately cover allforms of elder mistreatment (o<strong>the</strong>r than self-neglect) and that would capture <strong>the</strong> data elementsrequired to describe elder mistreatment service activity in <strong>New</strong> <strong>York</strong> <strong>State</strong>.■ Design an instrument that would elicit information that could be meaningfully compared to <strong>the</strong>Self-Reported <strong>Prevalence</strong> <strong>Study</strong> findings without being onerous to <strong>the</strong> survey respondents.■ Find ways to elicit <strong>the</strong> cooperation of busy executives to complete a lengthy questionnaire requiring<strong>the</strong>m to first obtain data from <strong>the</strong>ir own data systems. (The length of <strong>the</strong> final survey instrument was17 pages covering 33 questions.)■ Develop a sampling frame that would comprise <strong>the</strong> total universe of programs serving elder abusevictims in <strong>New</strong> <strong>York</strong> <strong>State</strong>.■ Finally, take into account <strong>the</strong> differences that each service system has in terms of definitions ofmistreatment, as well as differences in computer systems and administrative capacity to respond towhat was being asked of <strong>the</strong>m.In spite of <strong>the</strong> obstacles, <strong>the</strong> researchers were able to conduct a comprehensive survey of elder abuse casesreferred to agencies and programs known to serve elder abuse victims in all quarters of <strong>the</strong> state.The research partners were able to address all of <strong>the</strong>se concerns in <strong>the</strong> final survey instruments and in <strong>the</strong>protocol for administration of <strong>the</strong> telephone survey questionnaire. Copies of survey instruments used in bothcomponents of <strong>the</strong> study are contained in Appendices A and B.ELDER ABUSE SERVICES IN NEW YORK STATEOne of <strong>the</strong> primary challenges in conducting <strong>the</strong> study was identifying <strong>the</strong> numerous agencies responsible forserving older adults who have been victims of elder abuse. <strong>New</strong> <strong>York</strong> <strong>State</strong> is not a mandatory reporting statefor elder abuse; <strong>the</strong>re is no central, statewide repository of data on cases of elder mistreatment. <strong>Elder</strong> abuse casescan come to <strong>the</strong> attention of several agencies capable of providing investigation and intervention services. Inaddition to Adult Protective Services, which operates in every county in <strong>the</strong> state, <strong>New</strong> <strong>York</strong> <strong>State</strong> also hasseveral not-for-profit programs that specialize in investigating cases of elder abuse and responding to <strong>the</strong> needsof elder abuse victims. Nine such programs that specialize in serving elder abuse victims operate in <strong>New</strong> <strong>York</strong> City.In upstate <strong>New</strong> <strong>York</strong>, Lifespan’s <strong>Elder</strong> <strong>Abuse</strong> Prevention Program in Rochester provides elder abuse servicesin a ten county region. In addition, cases may enter <strong>the</strong> community’s response system through calls to law16 | U n d e r t h e R a d a r : N e w Y o r k S t a t e E l d e r A b u s e P r e v a l e n c e S t u d y
enforcement, District Attorney Offices, domestic violence programs, county-based programs funded by <strong>the</strong>NYS Office of Victim Services and/or programs administered directly or under contract by local area agencieson aging.Each service system has its own data collection system. Without a central statewide database for elderabuse cases, <strong>the</strong> task of <strong>the</strong> researchers was to track down data on elder abuse cases in all relevant serviceorganizations throughout <strong>the</strong> state. Excluded were agencies such as home health agencies, senior centers, ando<strong>the</strong>r community-based programs that may identify cases of elder abuse and refer to o<strong>the</strong>r service entities butdo not directly provide elder abuse intervention services.The system offers multiple portals through which cases of elder abuse may be reported and for victimsto access help; however, <strong>the</strong> number and variety of service providers presented a formidable task for <strong>the</strong> studypartners to obtain an accurate estimate of <strong>the</strong> number of cases served in a one-year period.METHODOLOGY: PREVALENCE (SELF-REPORTED) STUDY<strong>Study</strong> PopulationThe research team assembled a population-weighted sample of all residents of <strong>New</strong> <strong>York</strong> <strong>State</strong> aged 60 andolder. Age 60 was selected as <strong>the</strong> cutoff for <strong>the</strong> study because many official service systems that serve elder abusevictims (e.g., Adult Protective Services) use <strong>the</strong> same age criterion, and in subsequent analyses <strong>the</strong> aim of <strong>the</strong>study was to compare self-reported and officially reported cases meaningfully.The sample was created using a random digit dialing strategy derived from census tracts targeting <strong>the</strong>older than 60 demographic. To assure adequate representation of minority populations, Hispanics and African-American subjects were intentionally oversampled; similarly, <strong>the</strong> sample was augmented with older subjects(age greater than 80) to assure adequate representation of <strong>the</strong> oldest elders. Subsequent weighted analysesadjusted for this sampling strategy.Eligible subjects were those that were (1) at least 60 years of age, (2) living in a community residence (nota long term care facility) in <strong>New</strong> <strong>York</strong> <strong>State</strong>, (3) English or Spanish-speaking (all instruments were translatedinto and conducted in Spanish when this was <strong>the</strong> primary language of <strong>the</strong> respondent) and (4) who had enoughcognitive ability to participate in <strong>the</strong> full interview. With regard to <strong>the</strong> latter, <strong>the</strong> investigators consideredseveral protocols to assess cognition ranging from brief screening to formal mental status testing. Formalmental status testing was deemed as ei<strong>the</strong>r too onerous given <strong>the</strong> overall length of <strong>the</strong> interview or potentiallyoff-putting to subjects given <strong>the</strong> already sensitive nature of <strong>the</strong> study topic. Ultimately, a simple cognitivescreening procedure was employed consisting of three questions: marital status, date or year of birth and age.If <strong>the</strong> subject was unable to provide answers to any of <strong>the</strong>se questions, or if <strong>the</strong>ir reported age differed by morethan one year from <strong>the</strong>ir age as computed from <strong>the</strong> birth date, <strong>the</strong>y were deemed cognitively impaired and<strong>the</strong>refore not eligible to participate in <strong>the</strong> interview.S e l f R e p o r t e d P r e v a l e n c e a n d D o c u m e n t e d C a s e S u r v e y s F i n a l R e p o r t 2 0 1 1 | 17
The actual surveys were conducted by telephone by <strong>the</strong> Cornell Survey Research Institute (CSRI). Locatedat <strong>the</strong> Cornell University campus in Ithaca, NY, CSRI has been providing survey research, data collectionand analysis services since 1996 to a wide range of academic, non-profit, governmental and corporate clientele.CSRI interviewers were highly diverse in age, gender and ethnic background; two of <strong>the</strong> investigators (MarkLachs, Art Mason) conducted on-site training and education on <strong>the</strong> general topic of elder abuse with <strong>the</strong>survey staff prior to <strong>the</strong> initiation of <strong>the</strong> study. The training specifically included techniques and referralinformation on how to address potential situations in which a subject was deemed to be in immediate danger;Dr. Lachs made himself available by phone and pager through <strong>the</strong> self-reported study to assist interviewers andor subjects with any urgent clinical issue that might arise. Fortunately, no such situation occurred during <strong>the</strong>telephone interviews.InstrumentsThe survey instrument used for this component of <strong>the</strong> study was designed to capture elder mistreatment in fourgeneral domains: (1) Neglect by a responsible caretaker in meeting ADL (Activities of Daily Living) and/orIADL (Instrumental Activities of Daily Living) needs, (2) Financial Exploitation, (3) Emotional (Psychologicalor Verbal) <strong>Abuse</strong> and (4) Physical <strong>Elder</strong> <strong>Abuse</strong> (including Sexual <strong>Abuse</strong>).Wherever possible, existing instruments were employed to measure mistreatment so as to permitcomparisons to previous studies; this was a formal recommendation of <strong>the</strong> National Academy of Sciences Panel on<strong>Elder</strong> <strong>Abuse</strong>, which suggested use of instruments like <strong>the</strong> Conflict Tactics Scale to measure physical abuse(Bonnie, R.J., Wallace, R.B., 2002). However, that panel also suggested modification and adaptation of instrumentsfor elder abuse, and <strong>the</strong> study investigative group (who collectively has many decades of experience in directelder abuse service, administration, research and policy) found serious shortcomings in some aspects of virtuallyall instruments. For example, many older financial exploitation instruments fail to take into account manynewer forms of “technologically-mediated” financial abuse, such as <strong>the</strong>ft or misuse of an ATM card.The Conflict Tactics Scale (and its actual preamble) assert that family violence occurs when familiesresolve stressful situations dysfunctionally but many cases of serious elder abuse have no such predicate (forexample, a demented man who strikes a spouse with no provocation whatsoever). Additionally, although <strong>the</strong> intentof <strong>the</strong> study was to exclude stranger-mediated violence and crime, <strong>the</strong> study partners wished to capture abuse,neglect or exploitation conducted by non-family actors (such as a paid home health attendant) as situationssuch as this constitute a violation of an important trusting relationship and are highly relevant to victims,responders and policy makers. Accordingly, modest modifications were made to existing instruments asdescribed below for each domain.Additionally, following <strong>the</strong> precedent of Pillemer and Finkelhor in <strong>the</strong>ir adaptation of <strong>the</strong> Conflict TacticsScale (Pillemer and Finkelhor, 1988), both a frequency and severity rating were assigned to all items. Forfrequency, subjects were asked if since turning age 60 <strong>the</strong>y had ever experienced mistreatment; if <strong>the</strong>y endorsed<strong>the</strong> mistreatment item, <strong>the</strong>y were <strong>the</strong>n asked how many times <strong>the</strong>y had experienced <strong>the</strong> event in <strong>the</strong> past year.The possible response categories were “never, once, two to ten times, or greater than ten times.” This strategypermitted a calculation of both incident events (those occurring in <strong>the</strong> past year) versus prevalence (thoseoccurring at any time since age 60). When a subject endorsed a form of mistreatment as having occurred at least18 | U n d e r t h e R a d a r : N e w Y o r k S t a t e E l d e r A b u s e P r e v a l e n c e S t u d y
once in <strong>the</strong> past year, he or she was also asked how serious a problem <strong>the</strong> event(s) was for <strong>the</strong>m; <strong>the</strong> ordinalchoices for this were: “not serious, somewhat serious, very serious.”Frequency and severity ratings of an item were <strong>the</strong>n combined to determine whe<strong>the</strong>r abuse was deemedto be “present” or “absent.” However, <strong>the</strong> criteria for individual items necessarily varied by item. For example,neglect of an ADL by a responsible caregiver on a single occasion in <strong>the</strong> course of a year (e.g., failure to provideassistance with dressing) would not be considered abuse by many, whereas kicking or hitting would be, irrespectiveof how many times <strong>the</strong> event occurred or how severe <strong>the</strong> victims perceived <strong>the</strong> assault.To resolve this and establish frequency and severity criteria for each variable, <strong>the</strong> research partnersconducted a consensus meeting and discussed each variable individually; <strong>the</strong>re was high agreement on all itemsafter robust discussion. The final frequency and severity criteria were <strong>the</strong>n vetted with several external expertswith similar experience in elder abuse. The following is a summary of <strong>the</strong> domains, variable items and criteriafor positivity.A detailed version of <strong>the</strong> final questionnaire can be found in Appendix A.Neglect of IADLs and ADLs Domain. Subjects were asked if <strong>the</strong>y needed assistance with any of four higherfunctional IADL-type activities: shopping, meal preparation, basic housework, or taking medicine, and sixmore basic ADL-type activities: eating, bathing, dressing, toileting, transferring or walking. When individualssaid assistance was required, <strong>the</strong>y were asked (1) who was responsible for providing assistance with <strong>the</strong> activityand what <strong>the</strong>ir relationship was with <strong>the</strong> respondent, (2) whe<strong>the</strong>r <strong>the</strong>y had failed to provide assistance with<strong>the</strong> activity in <strong>the</strong> past year and how many times and (3) how serious a problem it was when and if <strong>the</strong> carefailure occurred. An ADL or IADL was deemed to be neglected when <strong>the</strong> neglect occurred more than ten timesin <strong>the</strong> previous year, and/or <strong>the</strong> subject described <strong>the</strong> neglected care need as being “somewhat” or “very serious”for <strong>the</strong>m.Financial Exploitation Domain. Several financial exploitation instruments were reviewed; <strong>the</strong> research teamfound instruments used for a Canadian study and a study in <strong>the</strong> UK to be <strong>the</strong> most salient for <strong>the</strong> purposes ofour study (Podnieks, 1992; Manthorpe et al., 2007). Some items from <strong>the</strong> existing instruments were adopted;<strong>the</strong> team also drew on <strong>the</strong> collective practice experience and expertise of <strong>the</strong> research study partners in financialexploitation to update <strong>the</strong> instrument and to add items. The scale was reviewed by member agencies of <strong>the</strong> <strong>New</strong><strong>York</strong> City <strong>Elder</strong> <strong>Abuse</strong> Network for review and to ensure that all domains were being captured.Ultimately, <strong>the</strong> research partners arrived at five financial exploitation items, three of which were designated“high severity items” and two of which were designated “modest severity.” The high severity items were:(1) whe<strong>the</strong>r or not someone stole or misappropriated money or property without permission, (2) whe<strong>the</strong>rsomeone forced you or misled <strong>the</strong> subject into surrendering rights or property or coerced <strong>the</strong>m into signing orchanging a legal document (such as a will, deed or power of attorney) and (3) whe<strong>the</strong>r someone impersonated<strong>the</strong> subject to obtain property or services. The modest severity items were (1) whe<strong>the</strong>r someone who had agreedto contribute to household finances had stopped doing so, and (2) whe<strong>the</strong>r someone who had been contributingto household finances had stopped doing so, even though <strong>the</strong>y had <strong>the</strong> ability to continue, such that <strong>the</strong>re wasno money left at <strong>the</strong> end of <strong>the</strong> month for necessities such as food or rent.S e l f R e p o r t e d P r e v a l e n c e a n d D o c u m e n t e d C a s e S u r v e y s F i n a l R e p o r t 2 0 1 1 | 19
The high severity items were deemed as “positive” when endorsed with any frequency, irrespective of <strong>the</strong>severity ranking. The modest severity items were deemed positive when endorsed as occurring greater than tentimes annually and rated as very serious by <strong>the</strong> subject.<strong>Elder</strong> Mistreatment Domain (Emotional, Physical and Sexual <strong>Abuse</strong>). The version of <strong>the</strong> Conflict TacticsScale (CTS) as modified by Pillemer (Pillemer and Finkelhor, 1988) was adopted for use in <strong>the</strong> study, using afrequency and importance ranking for each item. Two of <strong>the</strong> CTS items were assigned to what is termed in <strong>the</strong>instrument as a “verbal” (emotional/psycholological) abuse domain (when ano<strong>the</strong>r party ei<strong>the</strong>r (a) insulted orswore at <strong>the</strong> respondent, or (b) threatened to hit or throw something at <strong>the</strong> respondent) while <strong>the</strong> rest wereattributed to a “physical abuse domain;” <strong>the</strong> prevalence of mistreatment within those two domains is reportedseparately. The physical abuse items were deemed as “positive” when endorsed with any frequency, irrespectiveof <strong>the</strong> severity ranking. The first emotional abuse item (insulted or sworn at <strong>the</strong> respondent) was deemed“positive” when endorsed as occurring greater than ten times annually and rated as very serious by <strong>the</strong> subject,and <strong>the</strong> second emotional abuse item (threatening to throw something at <strong>the</strong> respondent) was deemed“positive” when occurring with any frequency or seriousness.The CTS and its preamble assert that conflict occurs in all families, and that it is <strong>the</strong> way families chooseto resolve those conflicts that potentially results in family violence. Because <strong>the</strong> objective of <strong>the</strong> study was tocapture elder mistreatment perpetrated by any individual in a trusting relationship with <strong>the</strong> subject (e.g., paidhome attendants, neighbors) in addition to family members, <strong>the</strong> preamble of <strong>the</strong> instrument was modified toinclude such individuals. In addition to specific categories of mistreatment, information was collected on <strong>the</strong>individuals alleged to have been <strong>the</strong> perpetrators in elder mistreatment episodes as described by <strong>the</strong> subjects.Our coding strategy permitted <strong>the</strong> classification of up to two perpetrators in mistreatment episodes.Finally, an open-ended query was included at <strong>the</strong> completion of <strong>the</strong> CTS in which subjects were asked if<strong>the</strong>y had been victims of elder mistreatment in any manner that was not ascertained in <strong>the</strong> existing instrument,so as not to miss cases of elder abuse not included in <strong>the</strong> predetermined categories chosen for <strong>the</strong> study.Subjects were also encouraged to provide qualitative detail about any and all episodes of mistreatment; <strong>the</strong>sewere recorded in open text fields.The survey instrument was pilot tested with ten elder abuse victims served by <strong>the</strong> <strong>New</strong> <strong>York</strong> City Departmentfor <strong>the</strong> Aging. The ten known victims were administered <strong>the</strong> survey in a telephone interview by <strong>the</strong> Cornell SurveyResearch Institute interview staff employed for <strong>the</strong> subsequent study. All but one individual endorsed eldermistreatment by at least one item in <strong>the</strong> instrument. That individual has modestly advanced cognitive impairment.The study also captured data elements regarding individual subjects that were potential covariates of eldermistreatment. (Variables that may be predictive of risk for elder abuse.) The survey protocol collected basicdemographic information about age, gender, marital status, household composition (number of individuals inhousehold and relationship to subject) and income. Clinical variables included ADL and IADL status as well asself-reported health status. Cognition was assessed through <strong>the</strong> brief screening procedure described above.The research instrument and <strong>the</strong> protocol for <strong>the</strong> Self-Reported <strong>Prevalence</strong> component of <strong>the</strong> study wereapproved by Cornell University’s Institutional Review Board.20 | U n d e r t h e R a d a r : N e w Y o r k S t a t e E l d e r A b u s e P r e v a l e n c e S t u d y
Self-Reported <strong>Prevalence</strong> vs. IncidenceOne of <strong>the</strong> primary goals of <strong>the</strong> Self-Reported <strong>Study</strong> was to estimate <strong>the</strong> prevalence and incidence rates ofelder abuse in <strong>New</strong> <strong>York</strong> <strong>State</strong>. <strong>Prevalence</strong> refers to <strong>the</strong> number of older adults who have ever experienced eldermistreatment since turning 60. Incidence refers to <strong>the</strong> number of new cases of elder abuse within a specified periodof time; for <strong>the</strong> purposes of this study, this was <strong>the</strong> year immediately preceding <strong>the</strong> administration of <strong>the</strong> surveyinterview in 2009. Thus <strong>the</strong> survey instrument was designed to capture respondent experiences with elder mistretmentwithin two time frames: since turning 60 and also, in greater detail, in <strong>the</strong> year preceding <strong>the</strong> interview.As described previously, some items required a positive indication of frequency and/or severity to beincluded in <strong>the</strong> findings as an elder abuse event. For items in which <strong>the</strong> criteria for a positive indication ofincidence in <strong>the</strong> past year required a threshold to be met for severity or frequency, and in which <strong>the</strong> respondentaffirmed a serious event but could not definitively designate it as occurring within <strong>the</strong> past year, <strong>the</strong> event wasstill qualified as incident. There were several rationales for this decision. First, <strong>the</strong> research team believes thatfor events that may have occurred more than one year ago, <strong>the</strong> ability of a respondent to report accuratelyboth a frequency and severity for remote events is more limited than for recent events. Second, many eldermistreatment events are chronic and <strong>the</strong>ir impact is enduring (e.g., ongoing poverty from a single episode offinancial exploitation, disability from injuries that occur from repeated or a single episode of mistreatment).<strong>Elder</strong> mistreatment may affect victims in a lifelong fashion producing new and ongoing disability with eachpassing year. Third, <strong>the</strong> decision to include in <strong>the</strong> incidence count those events for which <strong>the</strong>re is a report ofseverity above <strong>the</strong> threshold for inclusion accompanied by a lack of report of any frequency creates a bias in <strong>the</strong>direction of higher incidence in <strong>the</strong> past year. However, to exclude those events in <strong>the</strong> incidence count butinclude <strong>the</strong>m in <strong>the</strong> prevalence count because of <strong>the</strong> inability of <strong>the</strong> respondent to report on <strong>the</strong> time ofoccurrence would create a bias in <strong>the</strong> o<strong>the</strong>r direction (as some events most likely did occur in <strong>the</strong> past yearbecause of error in time recall).It should be understood that o<strong>the</strong>r biases in this study operate in <strong>the</strong> conservative direction (i.e., produceconservatively low estimates of both incidence and prevalence). For example, some categories of older <strong>New</strong><strong>York</strong>ers could not be included in <strong>the</strong> study, e.g., older persons with cognitive or communication impairment orthose who lacked access to a telephone. As a result, <strong>the</strong> study design and <strong>the</strong> criteria chosen for inclusion ofrespondent reports in incidence and prevalence data have produced <strong>the</strong> most conservative (lowest) ratio forunderreporting.The one-year incidence rate was <strong>the</strong> one used to calculate <strong>the</strong> ratio of self-reported cases to documentedcases in order to present a meaningful comparison of data. The Documented Case findings were also based oncase data from a one-year period, approximately contemporaneous with <strong>the</strong> one-year period Self-Reported<strong>Study</strong> respondents were asked to report on.The decision to assign events reported as serious by respondents but for which <strong>the</strong>y lacked a report offrequency does not affect prevalence rates at all. Incident cases, those occuring in <strong>the</strong> past year, are included in<strong>the</strong> prevalence count no matter when <strong>the</strong>y occured because, by definition, <strong>the</strong>y ocurred since <strong>the</strong> respondentreached age 60.S e l f R e p o r t e d P r e v a l e n c e a n d D o c u m e n t e d C a s e S u r v e y s F i n a l R e p o r t 2 0 1 1 | 21
METHODOLOGY: DOCUMENTED CASE STUDYThe <strong>Elder</strong> <strong>Abuse</strong> Documented Case <strong>Study</strong> utilized an on-line survey method: designated representatives ofevery program and agency responsible for specifically serving elder abuse and older victims of domesticviolence in <strong>New</strong> <strong>York</strong> <strong>State</strong> operating at <strong>the</strong> county level were asked to complete a web-based survey on cases ofelder abuse served by that program or agency in calendar year 2008. The survey included questions on elderabuse cases served that to <strong>the</strong> extent possible mirrored questions used for <strong>the</strong> statewide Self-Reported<strong>Prevalence</strong> <strong>Study</strong>.The online survey included an invitation to participate in <strong>the</strong> research project as well as assurance thatagencies could choose not to participate without penalty and that <strong>the</strong> rights of respondents were protected by<strong>the</strong> Fordham University Institutional Review Board approval process. Response to <strong>the</strong> survey constituted aninformed consent to participate.Definitions of elder abuse for <strong>the</strong> purpose of data collection were included in <strong>the</strong> survey instrument.Respondents were asked to report on case variables in <strong>the</strong> aggregate, based on availability of computerized datafields and statistical reports. Almost all agencies invited to participate were part of statewide service deliverysystems and, for many, reporting on documented case data is part of <strong>the</strong>ir contractual requirements for <strong>the</strong>ir statefunding or oversight agency. Although all county agencies surveyed were part of a statewide service deliverysystem, only a few of <strong>the</strong> state systems asked to participate were able to generate county-level demographic datafor <strong>the</strong>ir programs.The service delivery system approach to data collection for <strong>the</strong> Documented Case <strong>Study</strong> was recommendedby <strong>the</strong> study Advisory Committee members; <strong>the</strong> service delivery systems chosen were <strong>the</strong> major service entitiesin <strong>the</strong> state to come into regular contact with adult abuse victims, older adult community residents, domesticviolence victims and older adult crime victims.Development of Survey InstrumentThe instrument for <strong>the</strong> Documented Case <strong>Study</strong> was developed in conjunction with <strong>the</strong> development of <strong>the</strong>Self-Reported <strong>Prevalence</strong> <strong>Study</strong> telephone survey instrument and with input from study Advisory Committeemembers and experts in <strong>the</strong> field of elder abuse in <strong>New</strong> <strong>York</strong> <strong>State</strong>. In addition, it incorporated findings fromreviews of instruments developed or utilized in o<strong>the</strong>r elder abuse studies.A consensus building process among research team members and stakeholders was <strong>the</strong>n undertaken toinclude common definitional standards to <strong>the</strong> extent possible in <strong>the</strong> Self-Reported <strong>Prevalence</strong> <strong>Study</strong> and <strong>the</strong>Documented Case <strong>Study</strong>.The minimum data set captured by <strong>the</strong> survey included:Agency/ Organization: data concerning <strong>the</strong> respondent organization.22 | U n d e r t h e R a d a r : N e w Y o r k S t a t e E l d e r A b u s e P r e v a l e n c e S t u d y
Total and Type of Cases: number of unduplicated elder abuse cases, excluding self neglect, served in <strong>the</strong>calendar year reported.Profile of <strong>Elder</strong> <strong>Abuse</strong> Victims Served: number of victims in defined age categories; gender; race; livingarrangement between victims and abusers; and poverty status of victims.Profile of Perpetrators of <strong>Elder</strong> <strong>Abuse</strong>: unduplicated number of perpetrators by age category and relationshipof perpetrators to victims.Referrals In: Agencies/Organizations: types of case referral sources and numbers of victims referred byeach type of referral source.Referrals Out: Agencies/Organizations: types of agencies or organizations to which elder abuse clientswere referred. Respondents were also asked to provide an aggregate, unduplicated number of elder abusecases for which a Domestic Incident Report (DIR) was completed. (DIRs are completed by law enforcementin <strong>New</strong> <strong>York</strong> <strong>State</strong> when <strong>the</strong>y are called out on a domestic violence case. DIRs are records of <strong>the</strong> policecontact. Police jurisdictions file <strong>the</strong>m with NYS Division of Criminal Justice Services. <strong>New</strong> <strong>York</strong> <strong>State</strong>Police and <strong>New</strong> <strong>York</strong> City Police Department maintain <strong>the</strong>ir own DIR files.)Development of SurveyThe <strong>Elder</strong> <strong>Abuse</strong> Documented Case Survey was developed by <strong>the</strong> research team with <strong>the</strong> assistance of studyAdvisory Committee members, through in-person and telephone interviews with service providers in <strong>New</strong> <strong>York</strong><strong>State</strong> at both <strong>the</strong> state and local levels, elder abuse and domestic violence experts, and through reviews ofrelevant studies and instruments used to collect data on elder abuse in <strong>the</strong> United <strong>State</strong>s and internationally.Once <strong>the</strong> survey design was completed, it was pilot tested with seven agencies serving elder abuse victimsin <strong>New</strong> <strong>York</strong> <strong>State</strong>. These agencies volunteered to complete <strong>the</strong> survey and offer feedback on ease of use,availability of data requested and comprehension of questions and terms used.Development of Sampling FrameA sampling frame of non-institutionalized settings was developed with <strong>the</strong> assistance of <strong>the</strong> study AdvisoryCommittee members and o<strong>the</strong>r state and local officials. Key gatekeepers for each service system identified asrelevant for survey participation as part of <strong>the</strong> study were identified and asked to serve as access points for <strong>the</strong>survey sample and distribution. Service systems identified included:■ Adult Protective Services (<strong>State</strong> and <strong>New</strong> <strong>York</strong> City databases)■ Law enforcement (<strong>State</strong> and <strong>New</strong> <strong>York</strong> City)■ Area Agencies on Aging and <strong>the</strong>ir contract agencies where applicable■ Domestic violence programs (both residential and non-residential)S e l f R e p o r t e d P r e v a l e n c e a n d D o c u m e n t e d C a s e S u r v e y s F i n a l R e p o r t 2 0 1 1 | 23
■ <strong>Elder</strong> abuse programs (county-level agencies and programs)■ Office of Victim Services (OVS) programs (including both elder abuse programs and domestic violenceprograms, regardless of whe<strong>the</strong>r free-standing or located in host agencies)■ <strong>Elder</strong> abuse coalitions in <strong>New</strong> <strong>York</strong> <strong>State</strong> (county and regional coalitions)■ District Attorney (DA) offices (county offices).Survey Distribution StrategySurveys were sent by e-mail to key contact persons at <strong>the</strong> county level. These included program directors, agencyexecutive directors and project managers. A total of seven service systems (both local and state-wide) wereincluded in <strong>the</strong> sampling frame. Within those systems, a total of 419 agencies, institutions and programs wereincluded in <strong>the</strong> sampling frame and sent an invitation to participate, with a link to <strong>the</strong> on-line survey and a PDFof <strong>the</strong> survey. Participants were given <strong>the</strong> option of completing <strong>the</strong> survey on line or printing out <strong>the</strong> PDF of<strong>the</strong> survey, completing it on <strong>the</strong> printed survey and faxing it back to <strong>the</strong> study team for data input.In most cases respondent agencies were sent a letter of introduction from <strong>the</strong> state departments providingoversight of <strong>the</strong>ir operations outlining <strong>the</strong> importance of <strong>the</strong> study and encouraging completion of <strong>the</strong> survey.Project staff followed up with telephone and e-mail correspondence to urge completion and address anyconfusion or questions regarding <strong>the</strong> survey.The Documented Case survey instrument and administration protocol were approved by FordhamUniversity’s Institutional Review Board. The survey instrument used in <strong>the</strong> Documented Case <strong>Study</strong> may befound in Appendix B.RESULTS: SELF-REPORTED CASES<strong>Study</strong> PopulationA total of 4,156 subjects were interviewed; 4,000 subjects were interviewed directly, and in 156 cases proxyrespondents completed <strong>the</strong> interview. Data collection for <strong>the</strong> Self-Reported <strong>Study</strong> began on May 1, 2009 and wascompleted on July 22, 2009. A total of 22,359 contacts were made or attempted in order to yield 4,156 individualswho were qualified and willing to complete <strong>the</strong> survey. There were 1,368 persons contacted for whom eligibilityfor <strong>the</strong> study was confirmed but who refused to participate; 111 individuals for whom eligibility was not determinedrefused. The average interview took ten minutes; <strong>the</strong> median length was 12 minutes. The range was a minimumof six minutes to a maximum of 66 minutes.Because segregating results by respondent type did not substantially affect <strong>the</strong> results for <strong>the</strong> purposes ofthis report, both proxy respondents and direct interviewees have been pooled.24 | U n d e r t h e R a d a r : N e w Y o r k S t a t e E l d e r A b u s e P r e v a l e n c e S t u d y
Characteristics of Self-Reported <strong>Study</strong> SampleOf <strong>the</strong> 4,156 individuals who responded to <strong>the</strong> survey, 64.5% were female, 35.5% male. The age range was 60to 101 years of age with a median age of 74. The mean age of <strong>the</strong> sample was 74.3 years. Tables 1, 2 and 3describe <strong>the</strong> marital status, ethnic background and income of all respondents.Table 1 Table 3Marital Status of RespondentsHousehold IncomeMarital Status % Income %Married 47.2 <strong>Under</strong> $10K 5.8Widowed 32.7 $10-20K 13.3Separated 1.8 $20-30K 13.9Single/Divorced 7.5 $30-40K 12.5Single/Never Married 10.6 $40-50K 15.2Refused 0.3 $50-75K 16.9$75-100K 6.5Table 2 $100-150K 4.9Ethnicity of Respondents $150K + 2.9Ethnicity % Don’t know 2.0African American/Black 19.0 Refused 6.0American Indian/Aleut/ Eskimo 0.8Asian /Pacific Islander 1.2Caucasian 75.5Latino/Hispanic 6.0Something else 2.3Do not know 0.2Refused 1.0Of <strong>the</strong> surveys completed, 98.4% (4,088) were conduced in English; 1.6% of interviews (68) utilized <strong>the</strong>Spanish version of <strong>the</strong> survey.A third of subjects had a high school diploma or GED, and nearly half had completed at least somecollege or beyond. Mean household income was between $30,000 and $40,000. Half <strong>the</strong> sample were marriedor lived with a partner. Nearly two thirds of subjects self-rated <strong>the</strong>ir health as “good,” “very good” or “excellent.”Very few subjects were IADL-impaired and even fewer were ADL-impaired, as is typical of a study that solicitsinformation from telephone respondents who must possess enough cognitive and physical ability to use atelephone and participate in such an interview.Subjects were drawn from all regions of <strong>New</strong> <strong>York</strong> <strong>State</strong> given <strong>the</strong> sampling strategy undertaken (Table 4). For<strong>the</strong> purpose of <strong>the</strong> study, <strong>the</strong> state was divided into seven regions (see Figure 2): Western, Finger Lakes, Central/Sou<strong>the</strong>rn Tier, Capital Region /North Country/Mohawk Valley, Mid-Hudson, <strong>New</strong> <strong>York</strong> City, and Long Island.S e l f R e p o r t e d P r e v a l e n c e a n d D o c u m e n t e d C a s e S u r v e y s F i n a l R e p o r t 2 0 1 1 | 25
Figure 2Map of <strong>New</strong> <strong>York</strong> <strong>State</strong> Regions4465457REGION 1: NEW YORK CITY (Bronx, Kings, <strong>New</strong> <strong>York</strong>,Queens, Richmond)32REGION 2: LONG ISLAND (Nassau, Suffolk)1REGION 3: MID-HUDSON (Dutchess, Orange, Putnam,Rockland, Sullivan, Ulster, Westchester)REGION 4: CAPITAL REGION, MOHAWK VALLEY, NORTHCOUNTRY (Albany, Clinton, Columbia, Essex, Franklin,Fulton, Greene, Hamilton, Herkimer, Jefferson, Lewis,Montgomery, Oneida, Rensselaer, Saratoga, Schenectady,Schoharie, St. Lawrence, Warren, Washington)REGION 5: CENTRAL NEW YORK AND SOUTHERN TIER(Broome, Cayuga, Chemung, Chenango, Cortland,Delaware, Madison, Onondaga, Oswego, Otsego, Steuben,Tioga, Tompkins)REGION 6: FINGER LAKES (Genesee, Livingston, Monroe,Ontario, Orleans, Schuyler, Seneca, Wayne, Wyoming, Yates)REGION 7: WESTERN NEW YORK (Allegany, Cattaraugus,Chautauqua, Erie, Niagara)The regional breakdown of <strong>New</strong><strong>York</strong> <strong>State</strong> was based on <strong>the</strong> regional areasused by <strong>New</strong> <strong>York</strong> <strong>State</strong> Office for <strong>the</strong>Aging for service planning purposes. Ineach case <strong>the</strong> regions represent separategeographic regions, important populationclusters and distinct economic centers. Theintent of <strong>the</strong> study partners was to reporton each of <strong>the</strong> ten regions of state separatelybut some aggregation of regions becamenecessary in order to assure an adequatesample for <strong>the</strong> data to be useful and to allowmeaningful comparison between regions.26 | U n d e r t h e R a d a r : N e w Y o r k S t a t e E l d e r A b u s e P r e v a l e n c e S t u d y
Table 4Respondent and <strong>Elder</strong> Population Distribution by RegionRegionRegion Name/(number of counties)Respondents(Self Report <strong>Study</strong>)% of allrespondentsApprox.population –total regionpopulation(2008 US censusfigures)Over 60population inregionusing 2008 USCensus populationestimates1 NYC (5) 1,378 33.2 8.4M 1,394,4862 Long Island (2) 579 13.9 2.7M 545,5123 Mid- Hudson (7) 428 10.3 2.2M 421,9494 Capital Region (8)Mohawk Valley (7)North Country (5)27913912613.0 1.89M 382,3395 Central NY (6)Sou<strong>the</strong>rn Tier (7)2461289.0 1.48M 288,0536 Finger Lakes (10) 362 8.7 1.2M 232,9897 Western NY (5) 492 11.8 1.4M 293,132Total 4,156 19.27M 3,558,460Table 5 shows <strong>the</strong> major prevalence results of <strong>the</strong> Self-Reported Case <strong>Study</strong>; rates are expressed as elderabuse events per thousand subjects interviewed and reported by domain. Data in Table 5 represent prevalencerates for elder abuse in <strong>New</strong> <strong>York</strong> <strong>State</strong>, that is, mistreatment events reported by study respondents as havingoccurred since turning 60.The lowest rates of mistreatment are in <strong>the</strong> sub-domain of neglect (failing to provide IADL and ADLassistance to older adults who were identified as impaired in one or more ADLs or IADLs). The overall rateof IADL neglect was 14.9 per 1,000 individuals interviewed, and for ADL neglect it was 4.1 per thousandindividuals interviewed.The highest rate of mistreatment since a subject turned 60 years of age occurred for verbal/emotionalabuse, with a reported rate of 85.4 victims per thousand subjects interviewed. The rate for major financialexploitation (<strong>the</strong>ft of money or property, using items without permission, impersonation to get access, forcingor misleading to get items such as money, bank cards, accounts, power of attorney) was 41.6 per thousand; aS e l f R e p o r t e d P r e v a l e n c e a n d D o c u m e n t e d C a s e S u r v e y s F i n a l R e p o r t 2 0 1 1 | 27
ate of 10.8 per thousand was reported for moderate financial exploitation (e.g., “Unwilling to contribute tohousehold expenses to <strong>the</strong> extent that <strong>the</strong>re was not enough money for food or o<strong>the</strong>r necessities”).The rate for physical abuse events was 22.6 per thousand. Survey subjects were also invited at <strong>the</strong> end of<strong>the</strong> survey questionnaire to report any o<strong>the</strong>r mistreatment experienced since turning 60. They reported o<strong>the</strong>relder abuse events at <strong>the</strong> rate of 4.1 per thousand subjects interviewed.The overall prevalence rate for any non-financial event was 109.2 per thousand interviewed. The rate forany form of financial exploitation was 47.9 per thousand. The overall prevalence rate for any form of elder abusewas 141.2 per thousand subjects interviewed.Table 5<strong>Prevalence</strong> Rates of Self-Reported <strong>Elder</strong> <strong>Abuse</strong> in <strong>New</strong> <strong>York</strong> <strong>State</strong>by Mistreatment DomainN=4,156Domain and Item n Rate per 1,000(95% Confidence Interval)Neglect■ IADL Assistance■ ADL AssistanceFinancial Exploitation■ Major Activities■ Moderate Activities92171734514.94.141.610.8Verbal/Emotional <strong>Abuse</strong> 345 85.4Physical <strong>Abuse</strong> 94 22.6Victims of o<strong>the</strong>r elder abuse events as reported by respondents i 17 4.1Cumulative Rates of <strong>Elder</strong> <strong>Abuse</strong> Within and Across DomainsVictim of any IADL/ADL neglect, verbal/emotional elder abuse event,or physical elder abuse event at any time since turning age 60Victim of any major or moderate financial exploitation event sinceturning age 60454199109.247.9Total Cumulative <strong>Prevalence</strong> RateVictim of any IADL/ADL neglect, major or moderate financialexploitation event, verbal/emotional elder abuse event or physicalelder abuse event at any time since turning age 60587 141.2i This category reflects positive responses to a “catch all” question asked at <strong>the</strong> end of <strong>the</strong> survey questionnaire: “Have you everexperienced elder abuse or neglect?” Descriptions of <strong>the</strong> type of mistreatment experienced were also recorded.28 | U n d e r t h e R a d a r : N e w Y o r k S t a t e E l d e r A b u s e P r e v a l e n c e S t u d y
Table 6 shows <strong>the</strong> self-reported financial and self-reported non-financial prevalence rates organized by typeand by geographic regions of <strong>the</strong> state. The rates represent <strong>the</strong> number of survey respondents who reported havingexperienced various forms of mistreatment since turning 60. Rates are not mutually exclusive, as respondentsmay have reported having been subjected to more than one form of abuse. The total <strong>New</strong> <strong>York</strong> <strong>State</strong> rate, forexample, is 141.2, which is less than <strong>the</strong> sum of <strong>the</strong> two rates shown in <strong>the</strong> table. Total prevalence rates amongurban, suburban and rural counties do not vary widely; however, when differences between rates by category ofabuse are examined, <strong>the</strong> data reveals a rate of financial abuse in urban counties that is nearly double that reportedin rural counties. The study reveals variability in rates for <strong>the</strong> prevalence of abuse among <strong>the</strong> regions of <strong>New</strong><strong>York</strong> <strong>State</strong> but, based on study data alone, it is difficult to account for <strong>the</strong> range of reported rates.One should also be mindful that prevalence rates are distributed by region based on <strong>the</strong> residence of <strong>the</strong>respondent at <strong>the</strong> time of <strong>the</strong> survey. The elder abuse event reported may have occurred years or even decadespreviously since <strong>the</strong> respondent turned 60 and may have taken place in a different region or even outside <strong>New</strong><strong>York</strong> <strong>State</strong>.Table 6<strong>Prevalence</strong> Rates of Self-Reported <strong>Elder</strong> <strong>Abuse</strong> in <strong>New</strong> <strong>York</strong> <strong>State</strong>by Geographic AreaGeographic AreaSelf-reportedSelf-reportedTotal Self-reportedRate per 1,000Rate per 1,000<strong>Prevalence</strong> RateNon-financialFinancial<strong>New</strong> <strong>York</strong> <strong>State</strong> 109.2 49.9 141.2County TypesUrban105.656.4138.2Suburban117.340.3141.5Rural110.229.9127.6Regions<strong>New</strong> <strong>York</strong> City114.766.0150.9Long Island126.144.9150.3Mid-Hudson109.842.1140.2Capital Region, MohawkValley, North Country95.829.5116.0Central <strong>New</strong> <strong>York</strong>,Sou<strong>the</strong>rn Tier112.340.1136.4Finger Lakes85.638.7107.7Western <strong>New</strong> <strong>York</strong>103.738.6126.0S e l f R e p o r t e d P r e v a l e n c e a n d D o c u m e n t e d C a s e S u r v e y s F i n a l R e p o r t 2 0 1 1 | 29
Table 7 shows incidence rates as reported by respondents in <strong>the</strong> Self-Reported <strong>Study</strong>; rates are againexpressed as elder abuse events per 1,000 subjects interviewed and reported by domain. Data in Table 7represents mistreatment events reported by respondents in <strong>the</strong> year preceding <strong>the</strong> survey. The lowest rates ofmistreatment are in <strong>the</strong> sub-domain of neglect (failing to provide IADL and ADL assistance to older adults whowere identified as impaired in one or more ADLs or IADLs). This is largely <strong>the</strong> result of extremely low rates offunctional dependency in <strong>the</strong> sample (which creates fewer “opportunities” for neglect to occur). The overallrate of IADL neglect was 14.9 per 1,000 individuals interviewed and for ADL neglect it was 3.4 per 1,000individuals interviewed.Higher rates of mistreatment are seen for o<strong>the</strong>r elder mistreatment domains. The highest rate ofmistreatment occurred for major financial exploitation (<strong>the</strong>ft of money or property, using items withoutpermission, impersonation to get access, forcing or misleading to get items such as money, bank cards, accounts,power of attorney) with a rate of 41 per 1,000 surveyed. Surprisingly, what was regarded as moderate financialexploitation (e.g., an adult child unwilling to contribute to household finances despite having agreed to do so)was less common than more egregious forms. This may result from <strong>the</strong> stringent criteria that for moderatefinancial exploitation to exist <strong>the</strong> respondent had to endorse it as occurring greater than ten times in <strong>the</strong> prioryear and rate its impact as very serious.Rates of any emotional abuse (being chronically cursed, insulted or threatened with being hit) were 16.4per thousand subjects interviewed. The rate for any physical abuse episode was 22.4 per thousand subjectsinterviewed; <strong>the</strong> most common physical abuse type was being pushed or grabbed, followed by someone tryingto slap <strong>the</strong> respondent or throwing something at <strong>the</strong>m.Overall <strong>the</strong> incidence of elder neglect (failure of a designated caregiver to provide assistance with basic orinstrumental activities of daily living) was 17 per thousand individuals interviewed, while <strong>the</strong> rate for financialexploitation was 42.1 per thousand subjects interviewed. Using a modified version of <strong>the</strong> Conflicts TacticsScale, <strong>the</strong> prevalence of verbal/emotional and physical abuse was 16.4 and 22.4 per thousand subjects studied,respectively. The cumulative incidence of any form of non-financial elder mistreatment was 46.2 per thousandsubjects studied (95% confidence intervals 39.8 to 52.6), consistent with o<strong>the</strong>r studies conducted internationally.The total cumulative incidence for any elder abuse event in <strong>the</strong> year preceding <strong>the</strong> survey, including IADL/ADLneglect, major or moderate financial exploitation, psychological/verbal abuse or physical abuse was 76.0 perthousand respondents.30 | U n d e r t h e R a d a r : N e w Y o r k S t a t e E l d e r A b u s e P r e v a l e n c e S t u d y
Table 7Incidence Rates of Self-Reported <strong>Elder</strong> <strong>Abuse</strong> in <strong>New</strong> <strong>York</strong> <strong>State</strong> by Mistreatment DomainN=4,156Domain and Item n Rate per 1,000(95% Confidence Interval)NeglectIADL Assistance■ Failure of designated/responsible caregiver to assist with shopping 25■ Failure of designated/responsible caregiver to assist with meal 11preparation■ Failure of designated/responsible caregiver to assist with housework 35■ Failure of designated/responsible caregiver to assist with0medication adminADL Assistance■ Failure of designated/responsible caregiver to assist with feeding 3■ Failure of designated/responsible caregiver to assist with dressing 2■ Failure of designated/responsible caregiver to assist with ambulation 5■ Failure of designated/responsible caregiver to assist with transfers 1■ Failure of designated/responsible caregiver to assist with bathing 3■ Failure of designated/responsible caregiver to assist with toileting 1■ Failure of designated/responsible caregiver to assist with any3specific task iiFinancial ExploitationMajor Activities■ Someone stole or used items without permission144■ Forced or misled you to give away something that belonged27to you iii■ Pretended to be you to get goods or money20Moderate Activities■ Stopped contributing to household finances iv2■ Unwilling to contribute to household expenses v 26.02.68.400.70.51.20.20.70.20.734.66.54.80.50.5Verbal <strong>Abuse</strong>■ Insulted or cursed at you■ Threatened to hit or throw something at you17574.113.7Physical <strong>Abuse</strong>■ Touched you sexually against your will11■ Thrown something at you21■ Tried to slap or hit you21■ Pushed or grabbed you41■ Slapped you18■ Forced you to have sex against your will1■ Kicked, hit, or bit you with a fist13■ Tried to hit you with something else12■ Locked you in a room1■ Beat you up5■ Threatened you with a knife or gun5■ Used a knife or gun against you0■ Committed o<strong>the</strong>r violence against you vi 112.65.15.19.94.30.23.12.90.21.21.202.6S e l f R e p o r t e d P r e v a l e n c e a n d D o c u m e n t e d C a s e S u r v e y s F i n a l R e p o r t 2 0 1 1 | 31
Table 7 (continued)Domain and Item n Rate per 1,000(95% Confidence Interval)Cumulative Rates of <strong>Elder</strong> <strong>Abuse</strong> Within and Across Domains■ Failure of designated/responsible caregiver to assist with one ormore IADLs■ Failure of designated/responsible caregiver to assist with one ormore ADLs■ Victim of at least one major financial exploitation event vii■ Victim of at least one moderate financial exploitation event viii■ Victim of at least one psychological/verbal elder abuse event■ Victim of at least one physical elder abuse event (includingsexual abuse)Victim of any IADL/ADL neglect, psychological/verbal elder abuse event,or physical elder abuse event.Victim of any major or moderate financial exploitation event62141714689319217514.93.441.11.016.422.446.142.1Total Cumulative Incidence RateVictim of any IADL/ADL neglect, major or moderate financialexploitation event, psychological/verbal elder abuse event or physicalelder abuse event316 76.0ii Respondents were asked to identify o<strong>the</strong>r areas of assistance need not covered in <strong>the</strong> standard IADL items. Examples providedincluded assistance with laundry, arranging transportation, driving <strong>the</strong> respondent and paying bills.iii These could include money, a bank account, a credit card, deed to a house, personal property or legal rights such as a lastwill and testament or power of attorney.iv Despite a previous agreement to do so and resources still available to do so.v To <strong>the</strong> extent that <strong>the</strong>re was not enough money at <strong>the</strong> end of <strong>the</strong> month for necessities such as food.vi Examples provided by respondents included breaking down a bedroom door, death threats, being spit at.vii For example, <strong>the</strong>ft of money or property, using items without permission, impersonation to get access, forcing or misleadingto get items such as money, bank cards, accounts, power of attorney.viii For example, an adult child unwilling to contribute to household finances despite having agreed to do so.Self-reported financial and self-reported non-financial incidence rates for <strong>the</strong> state as a whole and foreach county type and state region are displayed in Table 8. The rates are again not mutually exclusive. The total<strong>New</strong> <strong>York</strong> <strong>State</strong> rate is 76.0, which is less than <strong>the</strong> sum of <strong>the</strong> two rates shown in <strong>the</strong> table. The data in this tablepoints to higher rates of abuse overall in non-financial and financial categories in more populated areas (urbanand suburban counties). <strong>New</strong> <strong>York</strong> City exhibits <strong>the</strong> highest incidence of elder abuse (number of respondentsper 1,000 reporting elder abuse events in <strong>the</strong> year preceding <strong>the</strong> survey) of any region in non-financial abuseand financial abuse categories as well as in <strong>the</strong> overall rate. As in <strong>the</strong> table of prevalence rates (Table 6),variability in rates of abuse among <strong>the</strong> regions of <strong>New</strong> <strong>York</strong> <strong>State</strong> are evident but cannot be explained adequatelyusing data ga<strong>the</strong>red through this study alone.32 | U n d e r t h e R a d a r : N e w Y o r k S t a t e E l d e r A b u s e P r e v a l e n c e S t u d y
Table 8Incidence Rates of Self-Reported <strong>Elder</strong> <strong>Abuse</strong> in <strong>New</strong> <strong>York</strong> <strong>State</strong>by Geographic AreaGeographic AreaSelf-reportedSelf-reportedTotal Self-reportedRate per 1,000Rate per 1,000<strong>Prevalence</strong> RateNon-financialFinancial<strong>New</strong> <strong>York</strong> <strong>State</strong> 46.2 42.1 76.0County TypesUrban51.447.284.8Suburban41.235.868.9Rural36.229.956.7Regions<strong>New</strong> <strong>York</strong> City55.253.092.2Long Island44.938.074.3Mid-Hudson37.439.770.1Capital Region, MohawkValley, North Country35.029.555.2Central <strong>New</strong> <strong>York</strong>,Sou<strong>the</strong>rn Tier53.534.880.2Finger Lakes35.935.958.0Western <strong>New</strong> <strong>York</strong>44.736.671.1The Self-Reported <strong>Study</strong> collected basic data from respondents about <strong>the</strong>ir abusers. Tables 9 and 10display data reported regarding perpetrators of mistreatment committed in <strong>the</strong> year preceding <strong>the</strong> survey. In all,316 respondents indicated that <strong>the</strong>y had been abused. They individually described having been abused by oneto five perpetrators. In 74% of <strong>the</strong> cases, <strong>the</strong>re was a single abuser; 17% of respondents described two abusers.In 9% of cases, respondents cited more than two abusers.S e l f R e p o r t e d P r e v a l e n c e a n d D o c u m e n t e d C a s e S u r v e y s F i n a l R e p o r t 2 0 1 1 | 33
Table 9Self-Reported <strong>Study</strong>Number of <strong>Abuse</strong>rs in Individual CasesTotal Number of Respondents: 316Number of Reported <strong>Abuse</strong>rs Frequencyin Individual Cases1 2352 543 244 25 1Table 10 shows revealing patterns in <strong>the</strong> data collected regarding <strong>the</strong> relationship between victims andabusers organized by mistreatment domains. The survey questionnaire allowed collection of data on up to twoabusers for each type of abuse described. A total of 428 abusers are included in <strong>the</strong> count as 26% of <strong>the</strong> 316respondents described abuse by multiple perpetrators. Overall, spouses/partners and adult children wereresponsible for 40% of <strong>the</strong> mistreatment reported.O<strong>the</strong>r relatives were cited as perpetrators in 12% of <strong>the</strong> abuse reported; home health aides were also citedin 12% of <strong>the</strong> incidents described. <strong>Abuse</strong> by home health aides clustered around two categories of mistreatment:IADL neglect and major financial exploitation. Of <strong>the</strong> 428 reported abusers, 177 or 41.4% were involved inmajor financial exploitation activities. This correlates with <strong>the</strong> finding that major financial exploitation was <strong>the</strong>type of mistreatment most commonly reported by respondents as having occurred in <strong>the</strong> twelve-month periodimmediately preceding <strong>the</strong> survey. The most common perpetrators of major financial exploitation were adultchildren, grandchildren, o<strong>the</strong>r relatives, friends and paid home care aides.Spouses/partners were described as <strong>the</strong> most common perpetrators of emotional abuse and physicalabuse. Ninety-eight abusers or 23% of <strong>the</strong> total number cited by respondents were involved in physical abuseevents. Friends were named as abusers, primarily in major financial exploitation cases, 11% of <strong>the</strong> time. It isalso revealing to note that, following spouses or partners, adult children, o<strong>the</strong>r relatives, friends and o<strong>the</strong>rnon-relatives were also described as <strong>the</strong> most common perpetrators of physical abuse (which includes anyinstances of sexual abuse.) In four cases, respondents indicated <strong>the</strong>y did not know <strong>the</strong> relationship of <strong>the</strong> abuser;six respondents refused to divulge <strong>the</strong> relationship of <strong>the</strong> abuser.The data displayed in this table reveals patterns that may be helpful in elder abuse investigations and inpreventive efforts targeting particular forms of abuse.34 | U n d e r t h e R a d a r : N e w Y o r k S t a t e E l d e r A b u s e P r e v a l e n c e S t u d y
Table 10Self-Reported <strong>Study</strong>Distribution of <strong>Abuse</strong>rs by Relationship and Type of MistreatmentTotal Number of <strong>Abuse</strong>rs: 428<strong>Abuse</strong>rIADLNeglectADLNeglectMajorFinancialExploitationModerateFinancialExploitationEmotional<strong>Abuse</strong>Physical<strong>Abuse</strong>TOTALSpouse/Partner13 2 13 0 24 35 87Adult Child 21 3 32 2 13 13 84Son/Daughterin-Law3 0 6 0 3 2 14Grandchild 2 0 21 1 1 4 29O<strong>the</strong>rRelative2 1 24 1 10 12 50Neighbor 1 0 7 0 5 2 15Friend 4 0 25 0 5 11 45O<strong>the</strong>r Non-RelativePaid HomeCare AideDon’tKnow5 0 12 0 7 17 4114 9 29 0 0 1 531 0 3 0 0 0 4Refused 0 0 5 0 0 1 6Totals 66 15 177 4 68 98 428Self-Reported <strong>Study</strong>: DiscussionOlder <strong>New</strong> <strong>York</strong>ers confirm, by <strong>the</strong>ir own responses in <strong>the</strong> Self-Reported <strong>Study</strong>, that <strong>the</strong>y experience mistreatmentin significant numbers in all parts of <strong>the</strong> state. <strong>Prevalence</strong> and incidence rates uncovered by <strong>the</strong> Self-Reported<strong>Study</strong> and reported in Tables 5 through 8 also demonstrate revealing patterns of mistreatment across <strong>New</strong> <strong>York</strong><strong>State</strong>. Although financial exploitation was <strong>the</strong> most common form of abuse cited by respondents as havingoccurred in <strong>the</strong> 12 months preceding <strong>the</strong> administration of <strong>the</strong> survey questionnaire, when asked about anyabuse event since turning age 60, <strong>the</strong> most commonly reported type of mistreatment was emotional abuse.S e l f R e p o r t e d P r e v a l e n c e a n d D o c u m e n t e d C a s e S u r v e y s F i n a l R e p o r t 2 0 1 1 | 35
None<strong>the</strong>less, <strong>the</strong> prevalence rate for any form of financial exploitation was still significant, 47.2 per 1,000respondents. When compared by region and type of county, prevalence rates of mistreatment reported byrespondents since turning 60 are similar in <strong>the</strong> three major categories of counties: urban, suburban and rural;however, when examined on a regional basis, prevalence data reveals some marked differences. <strong>New</strong> <strong>York</strong> Cityand Long Island regions have prevalence rates that are nearly 50% higher than <strong>the</strong> region with <strong>the</strong> lowestprevalence rate. On a regional basis <strong>the</strong> difference in rates for any form of financial exploitation is even moredramatic. <strong>New</strong> <strong>York</strong> City older adults reported having been financially exploited since turning 60 at a rate thatwas 47% higher than <strong>the</strong> region with <strong>the</strong> next lowest rate (Long Island).By contrast, <strong>the</strong> incidence data (Tables 7 and 8) shows that <strong>the</strong> highest rate of recent elder abuse (occurringin <strong>the</strong> past 12 months) was in <strong>the</strong> major financial category. Incidence rates also show much more variabilityamong types of counties. Older rural residents reported having been abused in <strong>the</strong> prior 12 months a third lessoften than urban residents. Older suburban residents also reported abuse at an incidence rate that was 19%lower than urban residents. It is beyond <strong>the</strong> scope of <strong>the</strong> study to definitively explain <strong>the</strong> difference in ratesby region and type of county. The patterns that emerge from <strong>the</strong> Self-Reported <strong>Study</strong> data do suggest fur<strong>the</strong>rinvestigation is warranted of <strong>the</strong> factors accounting for <strong>the</strong> vulnerability of older adults to abuse in someregions, in particular, urban areas, and in specific categories of abuse, especially financial and emotional abuse.RESULTS: DOCUMENTED CASESDocumented Case <strong>Study</strong>Aggregate System-wide DataService systems surveyed through <strong>the</strong> <strong>Elder</strong> <strong>Abuse</strong> Documented Case <strong>Study</strong> included: Adult Protective Services(APS); Area Agencies on Aging (AAA); law enforcement; domestic violence programs (DV); District Attorneyoffices (DA); community-based agencies, most of which are funded by <strong>the</strong> <strong>New</strong> <strong>York</strong> <strong>State</strong> Office of VictimServices (OVS); and elder abuse coalition member agencies not o<strong>the</strong>rwise part of <strong>the</strong> above-listed state servicedelivery systems. <strong>New</strong> <strong>York</strong> City (NYC) APS was surveyed separately from <strong>the</strong> NYS APS data system as <strong>New</strong> <strong>York</strong>City utilizes a different computerized data collection system from <strong>the</strong> rest of NYS. Law enforcement dataoutside of <strong>New</strong> <strong>York</strong> City was obtained through Domestic Incidence Reports (DIR) and exclude abuse andneglect by non-family members. Law enforcement data ga<strong>the</strong>red within <strong>New</strong> <strong>York</strong> City was obtained through<strong>the</strong> <strong>New</strong> <strong>York</strong> City Police Department (NYPD) and includes both family and non-family members.Data was collected for all 62 counties of <strong>New</strong> <strong>York</strong> <strong>State</strong>. A total of 419 individual surveys were sent outand 325 surveys were completed for a robust response rate of 78%. Of <strong>the</strong>se, 78 agencies that do serve elderabuse victims had no cases during calendar year 2008; an additional 16 agencies serving elder abuse victims donot have computer systems to record and report <strong>the</strong> statistics requested. This resulted in 231 agencies reportingdata on known cases of elder abuse.Table 11 shows <strong>the</strong> response rate for <strong>the</strong> Documented Case <strong>Study</strong> organized by service system respondingto <strong>the</strong> questionnaire. Community-based agencies include those programs funded by <strong>the</strong> Office of Victim Servicesfor elder abuse or domestic violence services. Services could be located in a stand-alone agency or as part of a36 | U n d e r t h e R a d a r : N e w Y o r k S t a t e E l d e r A b u s e P r e v a l e n c e S t u d y
District Attorney’s office, a domestic violence organization or a hospital. Also included are those communitybasedorganizations that are not funded by <strong>the</strong> Office of Victim Services but receive funding from o<strong>the</strong>r sources.Of <strong>the</strong> 124 OVS programs that were sent <strong>the</strong> survey, 75 completed <strong>the</strong> survey with demographic information;49 programs did not respond. Overall data was also obtained through <strong>the</strong> statewide OVS reporting system.The sum total of agencies within each service system exceeds <strong>the</strong> total number of unduplicated agencies(419) as some programs are counted in multiple categories. As an example, <strong>the</strong> <strong>New</strong> <strong>York</strong> City Department for<strong>the</strong> Aging receives OVS funding for elder abuse and is <strong>the</strong>refore counted under community-based agencies. Itis also, however, an Area Agency on Aging (AAA) and so is also counted under AAA; <strong>the</strong>refore, its programs willbe captured in both service systems, but were counted only once within <strong>the</strong> unduplicated information.All 59 AAAs in <strong>New</strong> <strong>York</strong> <strong>State</strong> were initially sent an email asking whe<strong>the</strong>r <strong>the</strong>y assist elder abuse victims(beyond identifying and referring to o<strong>the</strong>r organizations) and, if so, whe<strong>the</strong>r <strong>the</strong>y had reporting systems in placeto answer a survey on <strong>the</strong> number of victims served. Of <strong>the</strong> 59, 23 responded that <strong>the</strong>y in fact serve elder abusevictims but only eight indicated that <strong>the</strong>y were able to retrieve elder abuse case data necessary to respond to <strong>the</strong>survey. These eight AAA agencies were sent a survey to complete.Table 11Documented Case <strong>Study</strong>Response Rate by Service System and OrganizationOrganizations Total Number of Surveys Number Completed % CompletedTotal NumberUnduplicatedCommunity BasedAgencies419 325 78%254 191 75%Adult Protective Services 62 62 100%Law Enforcement 62 62 100%Coalition MemberAgencies42 9 21%District Attorneys 62 36 58%Domestic ViolencePrograms and Shelters106 76 72%Area Agencies on Aging 8 2 25%Response Rate by RegionOf <strong>the</strong> 419 agencies/programs determined qualified to respond to <strong>the</strong> survey, a total of 78% completed <strong>the</strong>survey. The response rates outlined in Table 12 varied considerably across <strong>the</strong> regions of <strong>the</strong> state ranging from65% in Region 3 (Mid-Hudson) to 98% in Region 6 (Finger Lakes.)S e l f R e p o r t e d P r e v a l e n c e a n d D o c u m e n t e d C a s e S u r v e y s F i n a l R e p o r t 2 0 1 1 | 37
Table 12Documented Case <strong>Study</strong>-Response Rate by RegionOrganizationsTotal Number ofAgenciesNumber Completed% CompletedTotal Number (Unduplicated)* 419 325 78%Region 1: <strong>New</strong> <strong>York</strong> City 111 105 95%Region 2: Long Island 16 15 94%Region 3: Mid-Hudson 60 39 65%Region 4: Capital Region,Mohawk Valley, North CountryRegion 5: Central <strong>New</strong> <strong>York</strong>,Sou<strong>the</strong>rn Tier95 90 95%68 53 78%Region 6: Finger Lakes 56 55 98%Region 7: Western <strong>New</strong> <strong>York</strong> 32 25 78%*The total number of regional agencies will not add up to <strong>the</strong> total number of unduplicated agencies becausesome agencies serve more than one county across regions. Respondent agencies were asked to submit a separatesurvey for each county served.Rates of Documented Cases by RegionTable 13 illustrates <strong>the</strong> overall distribution of documented cases by county type and by <strong>the</strong> geographic regionsof <strong>New</strong> <strong>York</strong> chosen for this study.In total, 11,432 victims were served throughout <strong>New</strong> <strong>York</strong> <strong>State</strong>, yielding a rate of 3.24 per 1,000 olderadults. The highest rate was in <strong>New</strong> <strong>York</strong> City (3.55 reported cases per 1,000 older adult residents) compared to <strong>the</strong>region with <strong>the</strong> lowest rate of documented cases, Central <strong>New</strong> <strong>York</strong> and <strong>the</strong> Sou<strong>the</strong>rn Tier (2.30 cases per 1,000.)Of <strong>the</strong> 325 agencies that could report numbers of victims, 78 reported serving zero victims during calendaryear 2008 (24% of <strong>the</strong> agencies). It should be noted that a statistical adjustment was made in determining <strong>the</strong>final number of elder abuse victims to account for cases served by multiple organizations during <strong>the</strong> study period(e.g., APS and law enforcement.)Agencies were asked to report demographic and service information for both victims and perpetrators.However, not all organizations were able to respond fully to all of <strong>the</strong> questions asked. In some cases, agencieswere able to give information on one data element, such as type of mistreatment, but were unable to provide38 | U n d e r t h e R a d a r : N e w Y o r k S t a t e E l d e r A b u s e P r e v a l e n c e S t u d y
information on o<strong>the</strong>r items, such as whe<strong>the</strong>r <strong>the</strong> victim and perpetrator live toge<strong>the</strong>r. The availability of datafor each question will be addressed at <strong>the</strong> end of this section.When <strong>the</strong> results of <strong>the</strong> survey were sorted by region, in all cases at least some organizations suppliedinformation on demographic and service information for both victims and perpetrators. Once again, in somecases agencies were able to give information on at least one or more data elements but were unable to provideinformation on all items.Adjustment for Duplication of VictimsThe count used in this documented rate was adjusted for estimated duplication of victims within differentservice organizations. Information was received from <strong>the</strong> agencies regarding <strong>the</strong> number of cases <strong>the</strong>y referredto o<strong>the</strong>r agencies and <strong>the</strong> number that were referred to <strong>the</strong>m by o<strong>the</strong>r agencies. A detailed analysis of <strong>the</strong>mapping of referrals to and from all agencies, separately for each county of <strong>the</strong> state, was carried out. Thepatterns and proportions of duplication of cases appearing in <strong>the</strong> records of two or more agencies were <strong>the</strong>ndetermined. The duplication was <strong>the</strong>n removed from <strong>the</strong> documented case counts.Table 13Rates of Documented <strong>Elder</strong> <strong>Abuse</strong> in <strong>New</strong> <strong>York</strong> <strong>State</strong> by Geographic AreaN=11,432Region N Rate per 1,000<strong>New</strong> <strong>York</strong> <strong>State</strong> 11,432 3.24County Types*UrbanSuburbanRuralRegions<strong>New</strong> <strong>York</strong> CityLong IslandMid-HudsonCapital Region, Mohawk Valley, North CountryCentral <strong>New</strong> <strong>York</strong>, Sou<strong>the</strong>rn TierFinger LakesWestern <strong>New</strong> <strong>York</strong>7,2983,1909445,3031,9981,0311,0186417706713.553.082.163.793.612.522.732.303.372.34* County types were determined by guidelines set forth by <strong>the</strong> <strong>New</strong> <strong>York</strong> <strong>State</strong> Office of Mental Health.S e l f R e p o r t e d P r e v a l e n c e a n d D o c u m e n t e d C a s e S u r v e y s F i n a l R e p o r t 2 0 1 1 | 39
Victim Informationby type of reported abuse experiencedTable 14 outlines <strong>the</strong> type of abuse reported and details characteristics of victims. A small number ofagencies were unable to report type of mistreatment (n = 36 or 15.9%). Among <strong>the</strong> agencies that didreport this information, 47% were emotional abuse victims, 32.7% were financial abuse victims,10.9% were neglect victims, 38.6% were physical abuse victims, and 0.99% were sexual abuse victims.(It should be noted that <strong>the</strong> sum of <strong>the</strong> percentages exceeds 100% because some victims experiencedmore than one type of abuse.) For those agencies that were able to report some information on typeof mistreatment, in 22.6% of <strong>the</strong> cases, information about type of abuse experienced by victims wasmissing. A total of 15.6% of all respondent agencies could not retrieve data on type of elder abuse at all.Age breakdown of reported victimsA small number of agencies were unable to report an age breakdown for victims (n = 33 or 14%). Ofthose victims with age range reported by respondent agency/programs, 17% were in <strong>the</strong> 60-64 agecategory; 41.9% were in <strong>the</strong> 65-74 age category; 28.1% were in <strong>the</strong> 75-84 age category; and 13% fellinto <strong>the</strong> 85+ age category. For those agencies that were able to report some information on ageinformation, in 15% of <strong>the</strong> cases data regarding <strong>the</strong> age of victims was missing.Gender breakdown of reported victimsA small number of agencies were unable to report gender for victims (n = 30 or 13%). The genderbreakdown for those victims whose gender was reported by respondent agency/programs was: 32.8%male and 67.2% female. For those agencies that were able to report some information on gender, in13.8% of cases, data related to victim gender was missing.Race/ethnicity breakdown for reported victimsAgencies tended to collect less racial and ethnic data on <strong>the</strong>ir victims than o<strong>the</strong>r demographics; a totalof 44 or 19.1% of agencies were unable to report this information. As reported by those agencies thatdid have racial and ethnic information on victims, 69.3% were Caucasians; 27.9% were AfricanAmericans; 3% were Asian/Pacific Islanders; 16.4% were Hispanic/Latino; 0.75% were American/AleutEskimos; and 10.5% “o<strong>the</strong>r” races. For those agencies that were able to report some information onrace and ethnicity, 50.8% of <strong>the</strong> data related to victim race or ethnicity was missing. It should be notedthat some agencies permitted elder abuse victims to declare more than one ethnic category; as a result<strong>the</strong> sum of percentages exceeds 100.40 | U n d e r t h e R a d a r : N e w Y o r k S t a t e E l d e r A b u s e P r e v a l e n c e S t u d y
Living arrangements of victimClose to one-half of <strong>the</strong> agencies were unable to report information on living arrangements of <strong>the</strong> victims(n = 111 or 48.1%). Of victims for whom respondent agency/programs reported on living arrangements,45.8% lived alone; 16.9% lived with spouses or partners; 17.3% lived with adult children; 7% livedwith sons-in-law or daughters-in-law; 6.3% lived with grandchildren; 4.7% lived with o<strong>the</strong>r relativesand 8.8% lived with o<strong>the</strong>r non-relatives. (Percentages add up to more than 100 as some victims fellinto more than one category.) For those agencies that were able to report some information on livingarrangement of <strong>the</strong> victim, in 78% of cases, <strong>the</strong> data that made up victim information on livingarrangements was missing.Lives with abuserAlmost one-half of <strong>the</strong> agencies were unable to report information on whe<strong>the</strong>r <strong>the</strong> victim and abuserlived toge<strong>the</strong>r (n = 109 or 47.2%). Of those agencies that could give this information, over one-third(39.4%) of <strong>the</strong> victims lived with <strong>the</strong>ir abusers.Living in povertyAgencies were asked to provide aggregate data regarding number of victims living below <strong>the</strong> povertythreshold (i.e., incomes below <strong>the</strong> federal poverty level for 2008). In 2008 this amount was $10,400 forone person, $14,000 for a two-person family. Only a small percentage of responding agencies were ableto give information on whe<strong>the</strong>r elder abuse victims were living at or below <strong>the</strong> poverty threshold;83.6% of <strong>the</strong> agencies could not report this information. However, of those that responded, 59.3%victims were identified as living at or below <strong>the</strong> poverty threshold.S e l f R e p o r t e d P r e v a l e n c e a n d D o c u m e n t e d C a s e S u r v e y s F i n a l R e p o r t 2 0 1 1 | 41
Table 14Documented Case Data – All Service Systems <strong>State</strong>wideVictim InformationELDER ABUSE AGGREGATE DATAVICTIM INFORMATIONTotal Number of Agencies submitting information on victims = 231Type of MistreatmentEmotional <strong>Abuse</strong> 47.0%Financial <strong>Abuse</strong> 32.7%Neglect 10.9%Physical 38.6%Sexual 0.99%Cases Missing Mistreatment Data 22.6%Total Number of Agencies Missing All Mistreatment Information 15.6%Age Groups60-64 17.0%65-74 41.9%75-84 28.1%85+ 13.0%Cases Missing Age Data 14.9%Total Number of Agencies Missing All Age Information 14.3%GenderMale 32.8%Female 67.2%Cases Missing Gender Data 13.8%Total Number of Agencies Missing All Gender Data 13.0%Race/EthnicityAfrican American 27.9%Asian/Pacific Islander 3.0%Hispanic/Latino 16.4%Native American/Aleut Eskimo 0.75%Caucasian 69.3%Race O<strong>the</strong>r 10.5%Cases Missing Race/Ethnicity Data 50.8%Total Number of Agencies Missing All Race/Ethnicity Information 19.1%42 | U n d e r t h e R a d a r : N e w Y o r k S t a t e E l d e r A b u s e P r e v a l e n c e S t u d y
Living ArrangementAlone 45.8%Spouse/Partner 16.9%Children 17.3%Son/Daughter-In-Law 7.0%Grandchild 6.3%O<strong>the</strong>r Relative 4.7%O<strong>the</strong>r Non Relative 8.8%Cases Missing Living Arrangement Data 78.0%Total Number of Agencies Missing All Living Arrangement Information 48.1%Lives with <strong>Abuse</strong>rLives with <strong>Abuse</strong>r 39.4%Cases Missing “Lives with <strong>Abuse</strong>r” Data 38.2%Total Number of Agencies Missing All “Lives with <strong>Abuse</strong>r” Information 47.2%PovertyBelow Poverty Level 59.3%Cases Missing Poverty Level Data 93.7%Total Number of Agencies Missing All Poverty Level Information 83.6%<strong>Abuse</strong>r informationTable 15 relates to demographics of reported abusers. A total of 187 agencies/programs reported informationon abusers of elder abuse victims (80.9% of all agencies reporting cases during this period), representing 10,530abusers in <strong>New</strong> <strong>York</strong> <strong>State</strong> during calendar year 2008.Age groups of abusersOver one-third of <strong>the</strong> agencies were unable to report age information for abusers (n = 72 or 38.5%). Of thoseagencies that could give this information, 7.7% reported abusers were in <strong>the</strong> younger than age 18 years category;44.8% were in <strong>the</strong> 18-45 age category; 25.6% were in <strong>the</strong> age 46-59 age category; and 22% were in <strong>the</strong> 60 yearsand older category. For those agencies that were able to report some information on age of <strong>the</strong> abuser, in 47.1%of cases, abuser information regarding age was missing.<strong>Abuse</strong>r genderA small number of agencies were unable to report gender for abusers (n = 2 or 1.1%). Respondent agency/programsthat identified gender of abuser reported 66.3% male abusers and 33.7% female abusers. Among those agenciesthat were able to report some information on gender, in 18.3% of cases, data elements concerning abuser genderwere missing.S e l f R e p o r t e d P r e v a l e n c e a n d D o c u m e n t e d C a s e S u r v e y s F i n a l R e p o r t 2 0 1 1 | 43
<strong>Abuse</strong>r relationship with victimA small number of agencies were unable to report <strong>the</strong> abuser’s relationship with victim (n = 8 or 4.3%). Respondentagency/programs reported on <strong>the</strong> relationship between victim and abuser as: spouses or partners, 26%; own adultchildren, 39.7%; sons or daughters-in-law, 2%; grandchildren, 9.5%; friends or neighbors, 3.5%; paid home careworkers, 0.65%; o<strong>the</strong>r relatives, 13.1%; and o<strong>the</strong>r non-relatives, 5.6%. For those agencies that were able to reportsome information on relationship, in 21.6% of cases, <strong>the</strong> relationship information was missing.Table 15Documented Case Data – All Service Systems <strong>State</strong>wide-<strong>Abuse</strong>r InformationELDER ABUSE AGGREGATE DATAABUSER INFORMATIONTotal Number of <strong>Abuse</strong>rs = 10,530Total number agencies submitting information on abusers = 187Age Groups18 or younger 7.7%18-45 44.8%46-59 25.6%60 and older 22.0%Cases Missing Age Data 47.1%Total Number of Agencies Missing All Age Information 38.5%GenderMale 66.3%Female 33.7%Cases Missing Gender Data 18.3%Total Number of Agencies Missing All Gender Information 1.1%RelationshipSpouse/Partner 26.0%Own Adult Children 39.7%Son-in-law/Daughter-in-law 2.0%Grandchild 9.5%Friends/Neighbors 3.5%Paid Home Assistant 0.65%O<strong>the</strong>r Relatives 13.1%O<strong>the</strong>r non-relatives 5.6%Cases Missing <strong>Abuse</strong>r Relationship Data 21.6%Total Number of Agencies Missing All <strong>Abuse</strong>r Relationship Information 4.3%44 | U n d e r t h e R a d a r : N e w Y o r k S t a t e E l d e r A b u s e P r e v a l e n c e S t u d y
Information on sources of elder abuse referralsreceived by respondent agenciesData presented in Table 16 and described below refers to both formal and informal system referrals. Over 40%of all respondent agencies were missing all information in this category (n=97 or 41.9%). For those agenciesthat were able to report some information on sources of referrals, in 51.5% of <strong>the</strong> cases <strong>the</strong> source of referralwas missing.Formal service system referrals received byrespondent agency/programsRespondent agency/programs reported receiving elder abuse referrals from <strong>the</strong> following agencies: AdultProtective Services (1.4%), district attorneys (4.4%), domestic violence programs (0.90%), elder abuse programs(2.2%), law enforcement (22.1%), community-based agencies (8.1%), financial services (1.1%), healthcareprograms (9.1%), homecare programs (4.4%) and Area Agencies on Aging (2.4%).Informal system referralsRespondent agency/programs also received referrals from elder abuse victims <strong>the</strong>mselves (17.6%), perpetrators(0.05%), family members (14%), friends and neighbors (3.8%), concerned citizens (0.88%), anonymoussources (4.8%) and “o<strong>the</strong>r information sources” (8.9%).A number of referrals were received from “o<strong>the</strong>r” sources (8.9%). These included referrals from formalservice programs or professionals as well as from informal sources. The most common sources described wereacquaintances, landlords and courts. Referrals were also received from social workers, housing authorities, <strong>the</strong>Veterans Administration and Departments of Social Services. Fur<strong>the</strong>r information about “o<strong>the</strong>r” referralsources is contained in Appendix D, Documented Case Data by Region: Discussion.Information on referrals of victims torespondent agenciesTable 16 below also documents referrals made by agencies on behalf of elder abuse victims. Close to one-thirdof all respondent agencies were missing all information in this category (n=71 or 30.7%). For those agenciesthat were able to report some information on where referrals of victims were made for fur<strong>the</strong>r service, in 60%of cases, <strong>the</strong> referral information was missing. In addition, in over one-third of <strong>the</strong> cases agencies indicated thatvictims were not referred to any o<strong>the</strong>r programs or agencies (36.7%). Referrals may or may not result in a casebeing closed, but can be part of an overall service plan for <strong>the</strong> victim. Of <strong>the</strong> total number of victims that werereferred for assistance, 17.9% of victims were referred to Adult Protective Services. Respondent agency/programsalso reported referring 30.1% of victims to community-based agencies, 15.2% of <strong>the</strong> cases to District Attorneyoffices, 9.8% of <strong>the</strong> cases to domestic violence programs, 16% of <strong>the</strong> cases to elder abuse programs, 15.7% of<strong>the</strong> cases to Family Court, 22.6% of <strong>the</strong> cases to healthcare services, 18.2% of <strong>the</strong> cases to law enforcement, 3.3%of <strong>the</strong> cases to Area Agencies on Aging, and 21.3% of <strong>the</strong> cases to “o<strong>the</strong>r.”S e l f R e p o r t e d P r e v a l e n c e a n d D o c u m e n t e d C a s e S u r v e y s F i n a l R e p o r t 2 0 1 1 | 45
Referrals to “o<strong>the</strong>r” services or programs comprised 21.3% of referrals reported. Respondents provided <strong>the</strong>following examples of “o<strong>the</strong>r” referrals: financial assistance, housing, immigration, lock replacement, places of worship,attorneys, Medicaid unit, Veterans Administration, Family Court. Additional information about referrals made forassistance to clients in elder abuse cases can be found in Appendix D, Documented Case Data by Region: Discussion.Domestic Incident Reports (DIR)Three-fifths (58%) of agency responders could not report information on whe<strong>the</strong>r DIRs were submitted onbehalf of reported victims. Of those respondent agency/programs that did report information on DIRs, 70.2%of elder abuse victims had DIRs filed on <strong>the</strong>ir behalf.A table of Documented Case Data displayed by region along with a discussion of <strong>the</strong> results by region canbe found in Appendices C and D.Table 16Documented Case Data – All Service Systems <strong>State</strong>wideReferral InformationELDER ABUSE AGGREGATE DATATotal Number of Agencies = 231Source of Referral-Formal SourcesAdult Protective Services 1.4%Community Agency 8.1%District Attorney 4.4%Domestic Violence Programs 0.90%<strong>Elder</strong> <strong>Abuse</strong> Programs 2.2%Financial Institution 1.1%Law Enforcement 22.1%Health Care Provider 9.1%Homecare 4.4%Office for <strong>the</strong> Aging 2.4%Source of Referral-Informal SourcesAnonymous 4.8%Concerned Citizen 0.88%Family Member 14.0%Friends/Neighbors 3.8%Perpetrator 0.05%Victim 17.6%46 | U n d e r t h e R a d a r : N e w Y o r k S t a t e E l d e r A b u s e P r e v a l e n c e S t u d y
O<strong>the</strong>r Total 8.9%Cases Missing Data on Source of Referral 51.5%Total Number of Agencies Missing All Referral Source Information 41.9%Referral ToAdult Protective Services 17.9%Community Agency 30.1%District Attorney 15.2%Domestic Violence Programs 9.8%<strong>Elder</strong> <strong>Abuse</strong> Programs 16.0%Family Court 15.7%Health Care Provider 22.6%Law Enforcement 18.2%Office for <strong>the</strong> Aging 3.3%O<strong>the</strong>r 21.3%Cases Missing Information on “Referral To” 60.0%Number of Victims Not Referred to O<strong>the</strong>r Services/Agencies (Cases in whichAgencies Reported No Referrals)36.7%Total Number of Agencies Missing All “Referral To” Information 30.7%Domestic Incident Reports (DIR)Cases with DIRs Completed 70.2%Cases Missing DIR Data 64.3%Total Number of Agencies Missing All DIR Information 58.0%Overall availability of <strong>the</strong> dataLooking at <strong>the</strong> completeness of <strong>the</strong> data among <strong>the</strong> various data elements, that is, <strong>the</strong> availability of <strong>the</strong> data toprovide a comprehensive look at cases reported to agencies and programs serving elder abuse victims throughout<strong>New</strong> <strong>York</strong> <strong>State</strong>, <strong>the</strong>re were two aspects that were examined: 1. those agencies that were unable to give us anyinformation on <strong>the</strong> data elements requested and 2. those agencies that could provide some information but notfor every case or for all <strong>the</strong> categories surveyed. (For example, <strong>the</strong>y could provide a gender or age breakdownbut not for all victims served.) Factoring <strong>the</strong>se two elements toge<strong>the</strong>r, <strong>the</strong> following observations about <strong>the</strong>availability of data from agencies can be made:<strong>Elder</strong> abuse case information most consistently available from agencies■ Type of mistreatment■ Gender of victims■ Age of victims■ Gender of abusers■ Relationship of abuser and victimS e l f R e p o r t e d P r e v a l e n c e a n d D o c u m e n t e d C a s e S u r v e y s F i n a l R e p o r t 2 0 1 1 | 47
<strong>Elder</strong> abuse case information less consistently available from agencies■ Race and ethnicity of victim■ Referrals to o<strong>the</strong>r agencies<strong>Elder</strong> abuse case information most frequently not available from respondent agencies■ Living arrangement of victim■ Age of abusers■ Whe<strong>the</strong>r <strong>the</strong> victim and abuser live toge<strong>the</strong>r■ Poverty■ Source of referrals■ DIR reportsOur findings also revealed surprising gaps in data collected. For example, data on whe<strong>the</strong>r victims livewith abusers is not collected in all systems that document serving elder abuse victims. While APS and lawenforcement collect <strong>the</strong> most complete case data of all service systems at <strong>the</strong> county level, some data elementsrequested in <strong>the</strong> Documented Case Survey were consistently missing in all systems, even among <strong>the</strong>se two.Ability of Organizations to Provide VictimInformation by Service SystemIn <strong>the</strong> Documented Case <strong>Study</strong>, organizations were asked to complete demographic information based on whatwas determined to be a “minimum dataset” of elder abuse information. Information was collected on type ofmistreatment, information on victims (age, gender, race/ethnicity, living arrangement, whe<strong>the</strong>r <strong>the</strong> victim livedwith <strong>the</strong> abuser, poverty status) and information on <strong>the</strong> abusers (age, gender, relationship of abuser).Table 17 displays <strong>the</strong> percentage of individual organizations within major service systems that were ableto provide data about specific categories of demographic data related to type of mistreatment, victims andperpetrators of abuse. For example, 94.7% of county Adult Protective Services (APS) units were able to provideinformation on <strong>the</strong> type of mistreatment; all law enforcement units responding to <strong>the</strong> survey were able toprovide this information, while only 61.1% of District Attorney offices and 74% of community-basedorganizations could report on <strong>the</strong> type of mistreatment experienced by victims.In general, APS and law enforcement maintained <strong>the</strong> most comprehensive data systems, with <strong>the</strong> vastmajority of counties able to complete most of <strong>the</strong> demographic categories. In both systems, <strong>the</strong>re were a fewitems that were not included in <strong>the</strong>ir standardized data systems and, <strong>the</strong>refore, information was not available inthose categories. District Attorneys and community-based organizations had data systems from which extractingquantitative information proved to be <strong>the</strong> most difficult, with significantly less information collected on <strong>the</strong>victims than on abusers.The findings displayed in this table highlight <strong>the</strong> gaps in documentation of data about elder abuse across<strong>the</strong> service systems surveyed by <strong>the</strong> Documented Case <strong>Study</strong>. Appendix E, Documented Case <strong>Study</strong> – AggregateData by Service System, along with Appendix F, Documented Case <strong>Study</strong> – Service System Data: Discussion,provide a more detailed examination of <strong>the</strong> responses of each service system surveyed to <strong>the</strong> Documented Case<strong>Study</strong> request for elder abuse case information.48 | U n d e r t h e R a d a r : N e w Y o r k S t a t e E l d e r A b u s e P r e v a l e n c e S t u d y
Table 17Documented Case <strong>Study</strong> DataPercent of Organizations Providing Victim Information by Service SystemMinimum data set informationfor elder abuseAdultProtectiveServicesLawEnforcementDistrictAttorneyCommunityBasedOrganizationType of mistreatment94.7%100.0%61.1%74.0%Information on victimsAgeGenderRace/ethnicityLiving arrangementsLives with <strong>Abuse</strong>rPoverty Status94.7%94.7%94.7%94.7%0.0%0.0%100.0%100.0%100.0%0.0%100.0%0.0%44.4%50.0%38.9%16.7%22.2%5.6%78.1%81.2%68.7%64.6%60.4%39.6%Information on abusersAgeGenderRelationship of abuser9.3%100.0%100.0%100.0%100.0%100.0%80.0%0.0%60.0%75.0%96.9%93.7%Documented Case <strong>Study</strong>: DiscussionIn addition to identifying clear issues with <strong>the</strong> way data about elder abuse cases is collected across servicesystems, <strong>the</strong> Documented Case component of <strong>the</strong> study demonstrates significant reporting trends in <strong>the</strong> state.Urban areas tend to have higher reported case rates than rural counties. When <strong>the</strong> data is sorted by urban versusrural counties, one finds that cases are referred to elder abuse programs and agencies 64% more often in urbancounties than in rural counties.The study does not attempt to tease out <strong>the</strong> reasons for <strong>the</strong> disparity in documented cases between urban andrural counties but some explanations can be offered for fur<strong>the</strong>r exploration. One can speculate that populationdensity in urban areas, in particular in <strong>New</strong> <strong>York</strong> City, may foster easier identification of mistreatment of older adults.While <strong>the</strong>re is little difference among urban, suburban and rural counties in types of abuse reported (for allregions, emotional abuse is <strong>the</strong> most common abuse category reported), rates of underreporting may be linkedto social isolation of <strong>the</strong> population served. Urban counties tend to be more “service rich” than rural counties.This is evident in <strong>New</strong> <strong>York</strong> City and in Monroe County, for example, in which not-for-profit agencies sponsorprograms specifically designed to aid elder abuse clients, supplementing <strong>the</strong> work of Adult Protective Service inthose counties. In addition urban counties are more likely to have <strong>the</strong> critical mass of cases and <strong>the</strong> financialresources to support elder abuse specialists in law enforcement or in <strong>the</strong> District Attorney’s office.On <strong>the</strong> o<strong>the</strong>r hand, rural counties may lack not only <strong>the</strong> service infrastructure to identify and serve olderadult victims of abuse, but also <strong>the</strong> systems needed to document cases o<strong>the</strong>r than in case records.S e l f R e p o r t e d P r e v a l e n c e a n d D o c u m e n t e d C a s e S u r v e y s F i n a l R e p o r t 2 0 1 1 | 49
COMPARISON OF SELF-REPORTED AND DOCUMENTED CASE DATATable 18 displays overall rates of self-reported abuse and documented case for <strong>the</strong> state as a whole. The data ispresented for all forms of abuse and by each mistreatment category as well. The table demonstrates thatalthough respondents in <strong>the</strong> study reported having been abused in <strong>the</strong> year preceding <strong>the</strong> survey at <strong>the</strong> rate of76 individuals per 1,000, only 3.2 persons per 1,000 received intervention from any of <strong>the</strong> service systemssurveyed during <strong>the</strong> same time period under consideration. The enormous gap between <strong>the</strong> self-reported rateand <strong>the</strong> documented case rate means that for every case in <strong>the</strong> formal service system, approximately 24 o<strong>the</strong>rswere not referred to services. Despite <strong>the</strong> high rate of financial abuse reported by Self-Reported <strong>Study</strong> respondents,<strong>the</strong> comparison of <strong>the</strong> data demonstrates that only one out of 44 financial abuse cases received service for thisform of mistreatment from agencies serving elder abuse victims. The ratio of reported neglect cases to documentedneglect case was also especially high (57.2 self reported cases for every documented case). Physical abuse andemotional abuse ratios were by comparison moderate but still involved nearly 20 and 12 victims, respectively,who were not referred to elder abuse service providers for every victim who received intervention.Table 18Rates of <strong>Elder</strong> <strong>Abuse</strong> in <strong>New</strong> <strong>York</strong> <strong>State</strong>: Comparison of Self-ReportedOne-Year Incidence and Documented Case DataDocumentedRate per 1,000Self-reportedRate per 1,000Ratio of Self-Reportedto Documented<strong>New</strong> <strong>York</strong> <strong>State</strong> -All forms of abuse3.24 76.0 23.5Financial .96 42.1 43.9Physical and Sexual 1.13* 22.4* 19.8Neglect .32 18.3 57.2Emotional 1.37 16.4 12.0*The Documented Case rate includes physical abuse cases only. Physical and sexual abuse data were combinedin <strong>the</strong> Self-Reported <strong>Study</strong>. The sexual abuse rate for <strong>the</strong> Documented Case <strong>Study</strong> was 0.03 per 1,000.It should be noted that <strong>the</strong> sum of <strong>the</strong> rates exceeds <strong>the</strong> total rates in both <strong>the</strong> Documented Case and Self-Reported Studies because some victims experienced more than one type of abuse.50 | U n d e r t h e R a d a r : N e w Y o r k S t a t e E l d e r A b u s e P r e v a l e n c e S t u d y
Rates of <strong>Elder</strong> <strong>Abuse</strong> by Geographic AreaTable 19 breaks down rates of mistreatment uncovered in both <strong>the</strong> Self-Reported <strong>Study</strong> and <strong>the</strong> DocumentedCase <strong>Study</strong> by type of county (urban, suburban and rural) and by region of <strong>the</strong> state. It fur<strong>the</strong>r displays datashowing a comparison of rates established in each component of <strong>the</strong> study by type of county and region andalso broken down by non-financial and financial abuse categories.Rates of self-reported and documented elder abuse varied considerably by region. Residents of urbancounties tend to report higher rates of mistreatment than o<strong>the</strong>r types of counties. Older adult residents of <strong>New</strong><strong>York</strong> City included in <strong>the</strong> sample reported a mistreatment rate of 92.2 per 1,000, a rate 67% higher than thatreported by older residents of <strong>the</strong> region with <strong>the</strong> lowest rate, Region 4 (Capital Region/Mohawk Valley/NorthCountry). Overall urban residents surveyed reported 23% to 50% higher rates of abuse than residents insuburban and rural counties, respectively. Although rates for subcategories of abuse (non-financial vs. financial)also varied somewhat by region, <strong>the</strong> data demonstrates that financial exploitation figures prominently as amajor form of mistreatment in every quarter of <strong>the</strong> state with self-reported rates ranging from a low of 29.5 per1,000 in <strong>the</strong> Capital Region /Mohawk/North Country region to a high of 53.0 per 1,000 in <strong>New</strong> <strong>York</strong> City.Rates of documented elder abuse also varied by region. The highest rate was in <strong>New</strong> <strong>York</strong> City (3.79reported cases per 1,000 older adult residents) compared to <strong>the</strong> region with <strong>the</strong> lowest rate of documented cases,Central <strong>New</strong> <strong>York</strong> /Sou<strong>the</strong>rn Tier (2.30 cases per 1,000). In spite of reaching more elders per 1,000 through itsnetwork of elder abuse programs and services, <strong>the</strong> data shows that due to <strong>the</strong> higher rate of mistreatmentuncovered in <strong>New</strong> <strong>York</strong> City versus o<strong>the</strong>r areas of <strong>the</strong> state, for every case served, 24 o<strong>the</strong>r victims still remainoutside <strong>the</strong> system and are potentially in need of intervention. Likewise, <strong>the</strong> lower rate of documented cases in<strong>the</strong> Central <strong>New</strong> <strong>York</strong>/Sou<strong>the</strong>rn Tier region is juxtaposed with a higher reported rate (80 per 1,000) than <strong>the</strong>average for <strong>the</strong> state resulting in only one out of 35 older adult victims known to <strong>the</strong> elder abuse service systemin that region in a one-year period.S e l f R e p o r t e d P r e v a l e n c e a n d D o c u m e n t e d C a s e S u r v e y s F i n a l R e p o r t 2 0 1 1 | 51
Table 19Comparison of Self-Reported One-Year Incidence andDocumented Case Rates of <strong>Elder</strong> <strong>Abuse</strong> by Geographic AreaRegionDocumentedSelf-reportedRatio of Self-ReportedRate per 1,000Rate per 1,000to Documented<strong>New</strong> <strong>York</strong> <strong>State</strong> 3.24 76.0 23.5County Types■ Urban3.5584.823.9■ Suburban3.0868.922.4■ Rural2.1656.726.3Regional Breakdown<strong>New</strong> <strong>York</strong> City 3.79 92.2• 55.2 non-financial• 53.0 financialLong Island 3.61 74.3• 44.9 non-financial• 38.0 financialMid-Hudson 2.52 70.1• 37.4 non-financial• 39.7 financial24.320.627.8Capital Region, MohawkValley, North CountryCentral <strong>New</strong> <strong>York</strong>,Sou<strong>the</strong>rn Tier2.73 55.2• 35.0 non-financial• 29.5 financial2.30 80.2• 53.5 non-financial• 34.8 financial20.234.9Finger Lakes 3.37 58.0• 35.9 non-financial• 35.9 financialWestern <strong>New</strong> <strong>York</strong> 2.34 71.1• 44.7 non-financial• 36.6 financial17.230.452 | U n d e r t h e R a d a r : N e w Y o r k S t a t e E l d e r A b u s e P r e v a l e n c e S t u d y
Comparison of Victim Demographic DataTable 20 displays a comparison of demographic characteristics of Self-Reported <strong>Study</strong> respondents withDocumented Case <strong>Study</strong> clients. <strong>Under</strong> Race/Ethnicity, it should be noted that in <strong>the</strong> Documented Case <strong>Study</strong>, someagencies permitted elder abuse victims to declare more than one ethnic category; as a result <strong>the</strong> sum of percentagesexceeds 100. In <strong>the</strong> Self-Reported <strong>Study</strong> column, respondents who self identified as Hispanic/Latino in addition toano<strong>the</strong>r category are reported in a separate statistic (7.6%). As a result, <strong>the</strong> sum of all categories again exceeds 100percent. Note that in Table 20, “Missing” in <strong>the</strong> Documented Case <strong>Study</strong> column indicates <strong>the</strong> percentage of casesin which responding organizations were unable to supply <strong>the</strong> data requested. In <strong>the</strong> Self-Reported <strong>Study</strong> column,“Missing” indicates <strong>the</strong> percentage of telephone survey respondents who declined to supply <strong>the</strong> requested information.“Missing” data is not included in <strong>the</strong> total sums for each demographic category.The comparison of demographic data in Table 20 reveals similar trends in both <strong>the</strong> Self-Reported andDocumented Case data except in <strong>the</strong> area of Race/Ethnicity. The percentage of Hispanic/Latino and Asian/PacificIslander victims served by Documented Case <strong>Study</strong> respondent organizations was approximately twice <strong>the</strong> percentageof Self-Reported <strong>Study</strong> respondents who self-identified as Hispanic/Latino or Asian/Pacific Islander. On <strong>the</strong> o<strong>the</strong>rhand, Native Americans/Aleut Eskimos were represented in <strong>the</strong> Documented Case findings at less than half <strong>the</strong> rate<strong>the</strong>y were found in <strong>the</strong> Self-Reported <strong>Study</strong>. It should also be noted, however, that responding organizations in <strong>the</strong>Documented Case <strong>Study</strong> were as a whole unable to provide racial/ethnic data in half of <strong>the</strong> cases.Table 20Victim Demographic InformationComparison of Documented Case Data and Self-Reported DataInformation about victimsAge groups60-6465-7475-8485+(Missing)GenderMaleFemale(Missing)Race/EthnicityAfrican AmericanAsian/Pacific IslanderCaucasianHispanic/LatinoNative American/Aleut EskimoRace, o<strong>the</strong>r(Missing)Documented Case <strong>Study</strong>Percent of victims for whichdata is available17.041.928.113.014.932.867.213.827.93.069.316.40.810.550.8Self-Reported <strong>Study</strong>Percent of Victims20.338.029.112.70.035.864.20.026.31.665.57.61.92.91.9S e l f R e p o r t e d P r e v a l e n c e a n d D o c u m e n t e d C a s e S u r v e y s F i n a l R e p o r t 2 0 1 1 | 53
CONCLUSIONSThis study is groundbreaking in a number of ways. It is <strong>the</strong> first study that has undertaken to examine elderabuse in <strong>New</strong> <strong>York</strong> <strong>State</strong> through two different but complementary methods, by obtaining data on self-reportedcases of elder abuse, by surveying <strong>the</strong> number of documented cases in <strong>the</strong> state and comparing <strong>the</strong> results toachieve a rate of underreporting. It is one of <strong>the</strong> largest studies of its kind, with over 4,100 subjects interviewedand 325 service organizations responding to <strong>the</strong> Documented Case survey. It has identified some important andunique findings that will guide not only government and agency policymaking and professional practice witholder adults and <strong>the</strong>ir families in <strong>New</strong> <strong>York</strong> <strong>State</strong> but also provide a methodology for studying elder abuse at <strong>the</strong>state level that can be replicated and adapted by o<strong>the</strong>r states as well.What follows is a summary of original goals of <strong>the</strong> study and research findings, which address <strong>the</strong> threecomponents of <strong>the</strong> study.1. To estimate <strong>the</strong> prevalence of various forms of elder abuse in a large, representative, statewidesample of older <strong>New</strong> <strong>York</strong>ers through direct subject interview.One of <strong>the</strong> primary goals of <strong>the</strong> study was to obtain a prevalence rate for elder abuse events in <strong>New</strong> <strong>York</strong><strong>State</strong> using sound research methods. The Self-Reported <strong>Elder</strong> <strong>Abuse</strong> component of <strong>the</strong> study found an overallprevalence rate of 141.2 per 1,000 and an incidence rate of 76 per 1,000 among older adult respondents acrossall sectors of <strong>the</strong> state.Applying <strong>the</strong> incidence rate to <strong>the</strong> general population of older <strong>New</strong> <strong>York</strong>ers, an estimated 260,000older adults in <strong>the</strong> state were victims of at least one form of elder abuse in <strong>the</strong> year preceding <strong>the</strong> survey.Fur<strong>the</strong>r analysis of <strong>the</strong> Self-Reported <strong>Study</strong> data uncovers interesting differences in patterns of abuse forprevalence (any elder abuse event experienced since turning 60) and incidence (new elder abuse events experiencedin <strong>the</strong> year preceding <strong>the</strong> survey).When <strong>the</strong> Self-Reported <strong>Study</strong> incidence data is broken down fur<strong>the</strong>r by typeof abuse, it is revealing to find <strong>the</strong> predominance of financial exploitation among all elder abuse events reportedby respondents in <strong>the</strong> year preceding <strong>the</strong> survey. The study findings show that 46.2 per thousand older <strong>New</strong><strong>York</strong>ers ages 60 years and older have experienced neglect, emotional abuse or physical (including sexual) abuse;41.1 per thousand have experienced major financial exploitation, while 42.1 per thousand have experiencedei<strong>the</strong>r major or moderate financial exploitation. This stands in contrast to <strong>the</strong> findings of <strong>the</strong> prevalence data,which revealed that <strong>the</strong> most common form of elder mistreatment experienced by older <strong>New</strong> <strong>York</strong>ers sinceturning 60 was emotional abuse, which was reported at a rate of 85.4 per thousand respondents. <strong>Prevalence</strong> andincidence rates, on <strong>the</strong> o<strong>the</strong>r hand, for neglect and physical abuse (which includes sexual abuse) were very similar.The mistreatment rates for both categories of abuse show decided disparity between regions and betweenrural/suburban counties and counties considered urban. The most marked divergence in reported abuse wasbetween urban areas and rural, a difference of 15 to 17 cases per thousand in non-financial and financial casesrespectively. <strong>New</strong> <strong>York</strong> City respondents reported a much higher rate of mistreatment than in almost all o<strong>the</strong>rregions of <strong>the</strong> state. In <strong>the</strong> most dramatic example, respondents from <strong>New</strong> <strong>York</strong> City reported 80% more financialexploitation than in Region 4 (Capital Region, Mohawk Valley, North Country).54 | U n d e r t h e R a d a r : N e w Y o r k S t a t e E l d e r A b u s e P r e v a l e n c e S t u d y
The high incidence of financial exploitation across regions argues for particular attention to this categoryof mistreatment in elder abuse service planning.2. To estimate <strong>the</strong> number of elder abuse cases coming to <strong>the</strong> attention of all agencies and programsresponsible for serving elder abuse victims in <strong>New</strong> <strong>York</strong> <strong>State</strong> in a one year period.A second focus of <strong>the</strong> study was to determine <strong>the</strong> number of elder abuse cases referred for intervention ina one-year period, in this case, calendar year 2008. A total of 11, 432 cases were identified among all <strong>the</strong> servicesystems charged with serving elder abuse victims. This number represents a rate of 3.24 elder abuse victimsstatewide per 1,000 older adult residents. Again <strong>the</strong>re was significant variation in documented case rates amongurban, suburban and rural counties as well as by region. At <strong>the</strong> extremes, urban counties reported documentedcase rates of 3.55 per 1,000 elders versus 2.16 for rural counties. Suburban counties reported a slightly lower ratethan urban counties. Regional rates ranged from a high of 3.79 persons served per 1,000 in <strong>New</strong> <strong>York</strong> City to2.30 in <strong>the</strong> Central <strong>New</strong> <strong>York</strong>/Sou<strong>the</strong>rn Tier region.While urban areas tend to have higher documented case rates than rural counties, <strong>the</strong>re was little differenceamong urban, suburban and rural counties in types of abuse reported in <strong>the</strong> Documented Case Survey (for allregions, emotional abuse was <strong>the</strong> most common abuse category reported).3. To compare rates of elder abuse in <strong>the</strong> two component studies, permitting a comparison of “known”to “hidden” cases, and <strong>the</strong>reby determining an estimate of <strong>the</strong> rate of elder abuse underreporting in<strong>New</strong> <strong>York</strong> <strong>State</strong>.A third focus of <strong>the</strong> study was to determine, through <strong>the</strong> comparison of Self-Reported <strong>Study</strong> data withDocumented Case <strong>Study</strong> data from service systems throughout <strong>the</strong> state, <strong>the</strong> difference, if any, between <strong>the</strong> ratesof elder mistreatment reported by older adults, and <strong>the</strong> actual number of cases served by agencies and programstasked with serving elder abuse victims.The findings of <strong>the</strong> study point to a dramatic gap between <strong>the</strong> rate of elder abuse events reported byolder <strong>New</strong> <strong>York</strong>ers and <strong>the</strong> number of cases served in <strong>the</strong> formal elder abuse service system.Overall <strong>the</strong> study found an elder abuse incidence rate that was nearly 24 times greater than <strong>the</strong> numberof cases referred to social service, law enforcement or legal authorities who have <strong>the</strong> capacity as well as <strong>the</strong>responsibility to assist older adult victims.Caution must be used in interpreting <strong>the</strong> large gap between <strong>the</strong> extent of elder abuse reported directly byolder adults and <strong>the</strong> number of cases served. Documentation systems may have played a role in <strong>the</strong> results. Theinability of some service systems and individual programs to report on <strong>the</strong>ir involvement in elder abuse casesaffected <strong>the</strong> final tally of documented cases. An undetermined number of cases are not accounted for fromagencies and programs that could not access data about elder abuse victims served. The extent to which <strong>the</strong> gapbetween <strong>the</strong> number of cases reported through <strong>the</strong> Documented Case <strong>Study</strong> and <strong>the</strong> incidence rates found in <strong>the</strong>Self-Reported <strong>Study</strong> can be attributed to data collection issues among service systems has not been established.However, <strong>the</strong> study received comprehensive data from <strong>the</strong> largest programs serving elder abuse victims: AdultProtective Services, law enforcement and community-based elder abuse programs.S e l f R e p o r t e d P r e v a l e n c e a n d D o c u m e n t e d C a s e S u r v e y s F i n a l R e p o r t 2 0 1 1 | 55
Consequently, <strong>the</strong> study results suggest a dramatic underreporting of elder abuse in all regions of <strong>the</strong>state and all three categories of counties.The actual reasons for <strong>the</strong> level of underreporting of elder mistreatment apparent among respondentagencies and service systems are unclear but may be explained in two ways based on <strong>the</strong> analysis of survey datafor <strong>the</strong> Documented Case part of <strong>the</strong> study. One is based on differences in available services and methods ofdocumentation by service system and a second is based on differences among geographic regions.The difference in rates suggests underreporting in rural areas. Referrals of elder abuse cases may bestimulated by <strong>the</strong> availability of services in urban areas such as <strong>New</strong> <strong>York</strong> City and o<strong>the</strong>r “service-rich” areas dueto <strong>the</strong> expectation that victims will receive adequate help to stop <strong>the</strong> mistreatment. Region 1 (<strong>New</strong> <strong>York</strong> City) isrelatively resource-rich with <strong>the</strong> only Area Agency on Aging that has a program funded by <strong>the</strong> Office of VictimServices and a network of specialized elder abuse service providers. Enhanced public education campaignsabout elder abuse in high reporting areas may also be affecting identification and referral of cases.Inconsistent documentation of elder abuse case activity may also be a factor. Adult Protective Servicesoutside of <strong>New</strong> <strong>York</strong> City uses a common database that captures almost all <strong>the</strong> elements requested in <strong>the</strong>Documented Case survey. Since <strong>the</strong> completion of <strong>the</strong> Documented Case <strong>Study</strong>, <strong>New</strong> <strong>York</strong> City APS has updatedits computer database and now captures data about elder abuse cases equivalent to <strong>the</strong> data elements recordedby o<strong>the</strong>r counties in <strong>the</strong> state. <strong>New</strong> <strong>York</strong> City Police Department also has a unique computer system thatcaptures data at a level that not all counties in <strong>New</strong> <strong>York</strong> <strong>State</strong> can match.Some service systems and some regions may lack <strong>the</strong> resources to integrate elder abuse elements in datacollection systems or may simply not have an adequate elder abuse focus in <strong>the</strong>ir data collection. While eachservice system from which an elder abuse victim may need service has a different mission and mandate, <strong>the</strong>reis a need for basic data for documentation of elder abuse events in <strong>the</strong> state for good service planning, clinicalintervention and a coordinated response across systems.Finally, population density and often greater visibility of older adults in <strong>the</strong> community in urban areas and,conversely, social isolation in rural areas may contribute to differences in reporting trends based on geography.Greater awareness by “sentinels,” that is, individuals, both lay and professional, who have contact with older adultsand are alert to <strong>the</strong> signs and symptoms of elder abuse, may also explain higher referral rates in some areas.The role of local Offices for <strong>the</strong> Aging (also known as Area Agencies on Aging (AAAs)) in elder abusecases also merits fur<strong>the</strong>r exploration. Of <strong>the</strong> 31 AAA agencies that responded to <strong>the</strong> Documented Case <strong>Study</strong>invitation to participate in <strong>the</strong> study, 23 reported serving elder abuse victims but only a third of that number(8) reported <strong>the</strong>y were able to retrieve data about elder abuse victims served. AAAs are not required to trackelder abuse and thus <strong>the</strong>ir data systems do not consistently include questions related to elder abuse. The AAAnetwork plays a central role in providing, making available and funding aging services on a local level. Thereasons behind <strong>the</strong> findings need to be explored fur<strong>the</strong>r as AAAs can, and in some cases already do, play acritical role in service planning in elder abuse cases and can offer a range of supportive services for victims ofelder abuse identified by APS, law enforcement, District Attorneys and community-based service systems.56 | U n d e r t h e R a d a r : N e w Y o r k S t a t e E l d e r A b u s e P r e v a l e n c e S t u d y
It should be noted that all local Offices for <strong>the</strong> Aging are engaged in certain core functions, includingsystems development, service coordination and filling in service gaps. However, <strong>the</strong>ir specific roles and activitiesvary to some extent from county to county in <strong>New</strong> <strong>York</strong> <strong>State</strong> due to local needs and conditions. Theirorganizational structures vary as well. All provide some direct services, including programs for elder abusevictims; however, what services <strong>the</strong>y provide directly and <strong>the</strong> extent to which <strong>the</strong>y contract with communitybasedagencies to provide aging services can differ in each county.One significant finding of <strong>the</strong> Self-Reported <strong>Study</strong> was <strong>the</strong> high rate of financial abuse reported byrespondents as having occurred in <strong>the</strong> year preceding <strong>the</strong> survey. This stands in contrast to <strong>the</strong> DocumentedCase survey in which emotional abuse was <strong>the</strong> most common form of mistreatment reported by agenciesproviding data on elder abuse victims. None<strong>the</strong>less, in two of <strong>the</strong> seven regions surveyed for documented cases,financial abuse emerged proportionally at a higher rate. However, few referrals come from financial institutionsto any of <strong>the</strong> service systems surveyed (1.1% of all referrals).Overall, <strong>the</strong> <strong>New</strong> <strong>York</strong> <strong>State</strong> <strong>Elder</strong> <strong>Abuse</strong> <strong>Prevalence</strong> <strong>Study</strong> uncovered a large number of older adults forwhom elder abuse is a reality but who remain “under <strong>the</strong> radar” of <strong>the</strong> community response system set upto assist <strong>the</strong>m.The findings of <strong>the</strong> <strong>New</strong> <strong>York</strong> <strong>State</strong> <strong>Elder</strong> <strong>Abuse</strong> <strong>Prevalence</strong> <strong>Study</strong> suggest that attention should be paid to<strong>the</strong> following issues in elder abuse services:■ Consistency and adequacy in <strong>the</strong> collection of data regarding elder abuse cases across service systems.Complete data collected consistently can be used by a broad range of elder-serving organizations toreduce elder abuse.■ Emphasis on cross system collaboration to foster effective use of limited resources to identify andserve more elder abuse victims. This may include ongoing dialogue and written agreements concerningcollaborative efforts and cross training within and among systems serving elder abuse victims and<strong>the</strong>ir families at <strong>the</strong> state and county levels.■ Greater focus on prevention and intervention in those forms of elder abuse reported to be mostcommon, in particular, financial exploitation. There appears to be a need for fur<strong>the</strong>r involvementof <strong>the</strong> financial industry in training and outreach and for general education of all sectors aboutidentification of financial abuse.■ Promotion of public and professional awareness through education campaigns and training around<strong>the</strong> signs of elder abuse and around resources available to assist older adults who are being mistreatedby trusted individuals.S e l f R e p o r t e d P r e v a l e n c e a n d D o c u m e n t e d C a s e S u r v e y s F i n a l R e p o r t 2 0 1 1 | 57
LIMITATIONS OF STUDYThe <strong>New</strong> <strong>York</strong> <strong>State</strong> <strong>Elder</strong> <strong>Abuse</strong> <strong>Prevalence</strong> <strong>Study</strong> is one of <strong>the</strong> largest and most detailed studies of elder abusesubjects ever conducted; yet <strong>the</strong>re are limitations inherent in <strong>the</strong> study design and study sample chosen.Although older adults were surveyed from every county in <strong>New</strong> <strong>York</strong> <strong>State</strong>, <strong>the</strong> size of <strong>the</strong> sample below <strong>the</strong>regional level does not allow for a statistically reliable profile of elder abuse cases on <strong>the</strong> county level in mostcases. O<strong>the</strong>r than populous counties with a large sample in <strong>the</strong> Self-Reported <strong>Study</strong>, individual counties mustinterpret <strong>the</strong> data in <strong>the</strong> context of <strong>the</strong> region in which <strong>the</strong>y are located or in comparison to <strong>the</strong> overallclassification of results into urban, suburban and rural county cohorts.It should also be noted that in order to participate in <strong>the</strong> Self-Reported Survey, subjects needed to have<strong>the</strong> physical ability as well as <strong>the</strong> cognitive capability of using a telephone and answering <strong>the</strong> survey questionsmeaningfully. Excluded were older adults with frailties and cognitive impairments that prevented <strong>the</strong>m fromparticipating in <strong>the</strong> study. It is possible but cannot be determined with certainty that <strong>the</strong> rate of elder mistreatmentwould have been found to be even higher if this vulnerable group could have been included in <strong>the</strong> survey sample.The research team believes that <strong>the</strong> Documented Case <strong>Study</strong> was successful in uncovering <strong>the</strong> vast majorityof active elder abuse cases in <strong>New</strong> <strong>York</strong> <strong>State</strong> in a one-year period. Never<strong>the</strong>less, some agencies and organizationswere unable to contribute to <strong>the</strong> study because <strong>the</strong>y were unable to retrieve data about <strong>the</strong> elder abuse victims<strong>the</strong>y served or, because <strong>the</strong>y do not keep data on elder abuse victims, were unable to complete <strong>the</strong> studyquestionnaire.IMPLICATIONS FOR FURTHER STUDYFor <strong>the</strong> first time, a scientifically rigorous estimate of <strong>the</strong> prevalence of elder abuse in <strong>New</strong> <strong>York</strong> <strong>State</strong> has beenestablished. The study also provides an estimate of <strong>the</strong> number of cases that received intervention in a one-yearperiod throughout <strong>the</strong> state. The study raises many questions about differences in rates of abuse in variousregions and types of counties. The study also revealed many issues about how elder abuse data is recorded byservice providers. Fur<strong>the</strong>r exploration of <strong>the</strong>se topics in future research studies is warranted.The study also uncovered a range of case reporting rates across regions in <strong>New</strong> <strong>York</strong>. It would be usefulto explore <strong>the</strong> factors that lead to higher referral rates to elder abuse agencies and programs in some areas thanin o<strong>the</strong>rs. Fur<strong>the</strong>r examination of <strong>the</strong> data produced by <strong>the</strong> study may also lead to better understanding ofvulnerability profiles of victims for specific types of abuse.The findings also serve as a platform to make more informed decisions about policy, use of limitedresources and models of service provision for <strong>the</strong> thousands of older <strong>New</strong> <strong>York</strong>ers whose safety, quality of lifeand dignity are compromised each year by elder mistreatment.58 | U n d e r t h e R a d a r : N e w Y o r k S t a t e E l d e r A b u s e P r e v a l e n c e S t u d y
REFERENCESREFERENCESAbelman, I. (1997). Profile of <strong>the</strong> protective services for adults caseload in <strong>New</strong> <strong>York</strong> <strong>State</strong>. Albany, NY: <strong>New</strong> <strong>York</strong><strong>State</strong> Office of Children and Family Services.Acierno, R., Hernandez, M.A., Amstadter, A.B., Resnick, H.S., Steve, K., Muzzy, W., & Kilpatrick, D.G. (2010).<strong>Prevalence</strong> and correlates of emotional, physical, sexual, and financial abuse and potential neglect in <strong>the</strong>United <strong>State</strong>s: The national elder mistreatment study. American Journal of Public Health, 100(2), 292-297.Bonnie, R.J., Wallace, R.B. (2002). <strong>Elder</strong> mistreatment: <strong>Abuse</strong>, neglect and exploitation in an aging America(pp. 39-41). Washington, DC: National Academies Press.Brownell, P. (1998). Family crimes against <strong>the</strong> elderly: <strong>Elder</strong> abuse and <strong>the</strong> criminal justice system. <strong>New</strong> <strong>York</strong>:Garland Publishing, Inc.Lachs, M., & Pillemer, K. (1998). The mortality of elder mistreatment. Journal of <strong>the</strong> American MedicalAssociation, 280(5), 428-432.Lachs, M., & Pillemer, K. (2004). <strong>Elder</strong> abuse. The Lancet, 364, 1192-1263.Manthorpe, J., Biggs, S., McCreadie, C., Tinker, A., Hills, A., O’Keefe, M., … Erens, B. (2007). The U.K.national study of abuse and neglect among older people. Nursing Older People, 19(8), 24-6.MetLife Mature Market Institute (2009). Broken trust: <strong>Elder</strong>s, family and finances. Westport, CT: Author.Monroe County Department of Health (2008). Older adult and adult health report card. Rochester, NY: Author.National Center on <strong>Elder</strong> <strong>Abuse</strong> at <strong>the</strong> American Public Welfare Association (1998). National elder abuseincidence study – Final report. Washington, DC: Author.<strong>New</strong> <strong>York</strong> Academy of Medicine (2008). Toward an aging friendly <strong>New</strong> <strong>York</strong>: A findings report. <strong>New</strong> <strong>York</strong>, NY:Author.<strong>New</strong> <strong>York</strong> City Department of City Planning (December 2006). <strong>New</strong> <strong>York</strong> City population projections byage/sex & borough, 2000-2030. <strong>New</strong> <strong>York</strong>, NY: Author.<strong>New</strong> <strong>York</strong> <strong>State</strong> Office for <strong>the</strong> Aging. Demographic changes in <strong>New</strong> <strong>York</strong> <strong>State</strong> (2000). Retrieved on July 5,2010, from http://www.aging.ny.gov/NYSOFA/Demographics/DemographicChangesin<strong>New</strong><strong>York</strong><strong>State</strong>.pdfPillemer, K. & Finkelhor, D. (1988). The prevalence of elder abuse: A random sample survey. Gerontologist,28(1), 51-57.S e l f R e p o r t e d P r e v a l e n c e a n d D o c u m e n t e d C a s e S u r v e y s F i n a l R e p o r t 2 0 1 1 | 59
Podnieks, E. (1992). National survey on abuse of <strong>the</strong> elderly in Canada. Journal of <strong>Elder</strong> <strong>Abuse</strong> and Neglect,4(1/2), 5-58.Teaster, P. B. & Otto, J. M. (2006). The 2004 survey of state adult protective services: <strong>Abuse</strong> of adults 60 years ofage and older. Washington, DC: National Center on <strong>Elder</strong> <strong>Abuse</strong>.US Census Bureau, American Fact Finder. Retrieved on June 13, 2010, fromhttp://factfinder.census.gov/servlet/SAFFPopulation?_event=Search&geo_id=01000US&_geoContext=01000US&_street=&_county=&_cityTown=&_state=04000US36&_zip=&_lang=en&_sse=on&ActiveGeoDiv=geoSelect&_useEV=&pctxt=fph&pgsl=010&_submenuId=population_0&ds_name=null&_ci_nbr=&qr_name=®=%3A&_keyword=&_industry=US Census Bureau, US Population Projections- <strong>State</strong> Interim Population Projections by Age and Sex:2004 – 2030. Retrieved on July 4, 2010, fromhttp://www.census.gov/population/www/projections/projectionsagesex.htmlUS Census Bureau, 2006-2008 American Community Survey, Selected Population Profile in <strong>the</strong> US: <strong>New</strong> <strong>York</strong>.Retrieved on July 5, 2010, from http://factfinder.census.gov/servlet/IPTable?_bm=y&-context=ip&-reg=ACS_2008_3YR_G00_S0201:007;ACS_2008_3YR_G00_S0201PR:007;ACS_2008_3YR_G00_S0201T:007;ACS_2008_3YR_G00_S0201TPR:007;&-qr_name=ACS_2008_3YR_G00_S0201&-qr_name=ACS_2008_3YR_G00_S0201PR&-qr_name=ACS_2008_3YR_G00_S0201T&-qr_name=ACS_2008_3YR_G00_S0201TPR&-ds_name=ACS_2008_3YR_G00_&-tree_id=3308&-redoLog=false&-_caller=geoselect&-geo_id=04000US36&-search_results=01000US&-format=&-_lang=en60 | U n d e r t h e R a d a r : N e w Y o r k S t a t e E l d e r A b u s e P r e v a l e n c e S t u d y
APPENDIX ASELF-REPORTED STUDY QUESTIONNAIRE(English version. Spanish version available upon request.)PREVALENCE OF ELDER ABUSE SURVEYFINAL QUESTIONNAIRE>langintro
eligr namepre_letternewintro
proxyprefusepnameconfblurb
maritaldobagecheck_cogcheck_age 60 in household]64 | U n d e r t h e R a d a r : N e w Y o r k S t a t e E l d e r A b u s e P r e v a l e n c e S t u d y
HH relations / Health>HH_relationshealth
Duke OARS IADL>DukeOARS_IADL
IADLcheckDuke_ADL
Duke_ADL (continued)
Duke_ADL (continued)
Financial Exploitation>financial_exploitation
<strong>Elder</strong> mistreatment>elder_mistreatment_1
[If at least one “Yes” in 5. through 10.[Else➜ Go to elder_mistreatment_3]➜ Continue to elder_mistreatment_2]>elder_mistreatment_2elder_mistreatment_3
elder_mistreatment_4catchall
Demographics>demog_introhispanicethnicityeducationhomeown
hhinc gendercontactselfases
post_letterdoneinvwasesdanger
APPENDIX BDOCUMENTED CASE STUDY SURVEYS e l f R e p o r t e d P r e v a l e n c e a n d D o c u m e n t e d C a s e S u r v e y s F i n a l R e p o r t 2 0 1 1 | 77
78 | U n d e r t h e R a d a r : N e w Y o r k S t a t e E l d e r A b u s e P r e v a l e n c e S t u d y
S e l f R e p o r t e d P r e v a l e n c e a n d D o c u m e n t e d C a s e S u r v e y s F i n a l R e p o r t 2 0 1 1 | 79
80 | U n d e r t h e R a d a r : N e w Y o r k S t a t e E l d e r A b u s e P r e v a l e n c e S t u d y
S e l f R e p o r t e d P r e v a l e n c e a n d D o c u m e n t e d C a s e S u r v e y s F i n a l R e p o r t 2 0 1 1 | 81
82 | U n d e r t h e R a d a r : N e w Y o r k S t a t e E l d e r A b u s e P r e v a l e n c e S t u d y
S e l f R e p o r t e d P r e v a l e n c e a n d D o c u m e n t e d C a s e S u r v e y s F i n a l R e p o r t 2 0 1 1 | 83
84 | U n d e r t h e R a d a r : N e w Y o r k S t a t e E l d e r A b u s e P r e v a l e n c e S t u d y
S e l f R e p o r t e d P r e v a l e n c e a n d D o c u m e n t e d C a s e S u r v e y s F i n a l R e p o r t 2 0 1 1 | 85
86 | U n d e r t h e R a d a r : N e w Y o r k S t a t e E l d e r A b u s e P r e v a l e n c e S t u d y
S e l f R e p o r t e d P r e v a l e n c e a n d D o c u m e n t e d C a s e S u r v e y s F i n a l R e p o r t 2 0 1 1 | 87
88 | U n d e r t h e R a d a r : N e w Y o r k S t a t e E l d e r A b u s e P r e v a l e n c e S t u d y
S e l f R e p o r t e d P r e v a l e n c e a n d D o c u m e n t e d C a s e S u r v e y s F i n a l R e p o r t 2 0 1 1 | 89
90 | U n d e r t h e R a d a r : N e w Y o r k S t a t e E l d e r A b u s e P r e v a l e n c e S t u d y
S e l f R e p o r t e d P r e v a l e n c e a n d D o c u m e n t e d C a s e S u r v e y s F i n a l R e p o r t 2 0 1 1 | 91
92 | U n d e r t h e R a d a r : N e w Y o r k S t a t e E l d e r A b u s e P r e v a l e n c e S t u d y
S e l f R e p o r t e d P r e v a l e n c e a n d D o c u m e n t e d C a s e S u r v e y s F i n a l R e p o r t 2 0 1 1 | 93
APPENDIX CDOCUMENTED CASE STUDYAGGREGATE CASE DATA BY REGIONELDER ABUSE AGGREGATEREGIONAL DATASERVICE SYSTEM INFORMATION<strong>New</strong> <strong>York</strong> City Long Island Mid-Hudson RegionType of <strong>Abuse</strong> Total Number of Agencies = 50 Total Number of Agencies =10 Total Number of Agencies = 30Emotional <strong>Abuse</strong> 76.00% 90.00% 90.00%Financial <strong>Abuse</strong> 80.00% 90.00% 83.33%Neglect 64.00% 50.00% 50.00%Physical 82.00% 90.00% 83.33%Sexual 46.00% 60.00% 16.67%VICTIM INFORMATIONTotal Number of Victims = 6780 Total Number of Victims = 2021 Total Number of Victims = 1165Total Number of Agencies = 47 Total Number of Agencies = 10 Total Number of Agencies = 28Emotional <strong>Abuse</strong> 48.13% 63.66% 40.19%Financial <strong>Abuse</strong> 34.72% 15.91% 28.36%Neglect 10.94% 9.66% 11.51%Physical 44.15% 26.68% 34.36%Sexual 0.71% 1.66% 0.32%Age Groups60-64 24.85% 5.61% 2.85%65-74 35.12% 53.08% 48.26%75-84 26.37% 30.09% 31.14%85+ 13.67% 11.21% 17.74%Total* 89.34% 79.42% 69.18%Age Cumulative60+ 100.00% 100.00% 100.00%65+ 67.12% 74.96% 67.21%85+ 12.21% 8.91% 12.27%GenderMale 33.84% 27.19% 30.91%Female 66.16% 72.81% 69.09%Total* 90.27% 78.97% 78.03%Race/EthnicityAfrican American 33.12% 18.29% 17.50%Asian/Pacific Islander 4.93% 0.78% 0.56%Hispanic/Latino 25.92% 3.32% 6.80%Native American/Aleut Eskimo 0.31% 0.26% 0.00%Caucasian 33.40% 68.82% 65.89%Race O<strong>the</strong>r 2.32% 8.53% 9.25%Total* 52.68% 76.00% 77.00%*Total = percentage of cases reporting data in <strong>the</strong> category94 | U n d e r t h e R a d a r : N e w Y o r k S t a t e E l d e r A b u s e P r e v a l e n c e S t u d y
Capital Region, MohawkValley, North CountrySERVICE SYSTEM INFORMATIONCentral <strong>New</strong> <strong>York</strong>,Sou<strong>the</strong>rn TierFinger LakesWestern <strong>New</strong> <strong>York</strong>Total Number of Agencies = 66 Total Number of Agencies = 39 Total Number of Agencies = 33 Total Number of Agencies = 2174.24% 82.05% 75.76% 76.47%74.24% 69.23% 81.82% 70.59%43.94% 33.33% 39.39% 52.94%77.27% 87.18% 69.70% 76.47%19.70% 20.51% 21.21% 29.41%VICTIM INFORMATIONTotal Number of Victims = 1083 Total Number of Victims = 700 Total Number of Victims = 923 Total Number of Victims = 676Total Number of Agencies = 62 Total Number of Agencies = 36 Total Number of Agencies = 31 Total Number of Agencies = 1943.47% 50.00% 28.26% 29.91%31.09% 36.60% 43.35% 39.29%8.61% 15.85% 10.36% 10.94%36.07% 39.81% 24.94% 31.25%1.48% 3.02% 0.38% 1.56%12.77% 11.76% 9.22% 6.70%53.80% 51.39% 39.76% 46.17%25.63% 25.70% 35.93% 33.97%7.80% 11.15% 15.09% 13.16%91.14% 92.29% 90.47% 61.83%100.00% 100.00% 100.00% 100.00%79.50% 81.14% 82.12% 57.69%7.11% 10.29% 13.65% 8.14%34.03% 33.87% 36.61% 31.33%65.97% 66.13% 63.39% 68.67%88.18% 88.57% 89.38% 71.30%9.20% 4.24% 13.15% 9.74%0.23% 0.51% 0.22% 0.00%1.93% 0.68% 2.16% 1.95%2.05% 1.02% 1.94% 0.22%76.59% 67.29% 74.57% 64.07%10.00% 26.27% 7.97% 24.03%81.26% 84.29% 50.27% 68.34%S e l f R e p o r t e d P r e v a l e n c e a n d D o c u m e n t e d C a s e S u r v e y s F i n a l R e p o r t 2 0 1 1 | 95
AGGREGATE CASE DATA BY REGION (continued)ELDER ABUSE AGGREGATEREGIONAL DATALiving Arrangement<strong>New</strong> <strong>York</strong> City Long Island Mid-Hudson RegionAlone 46.95% 31.33% 56.57%Spouse/Partner 12.70% 23.69% 17.74%Children 11.94% 37.75% 18.04%Son/Daughter In Law 12.70% 3.61% 0.92%Grandchild 7.48% 8.84% 3.06%O<strong>the</strong>r Relative 5.28% 3.61% 3.36%O<strong>the</strong>r Non Relative 5.28% 12.05% 9.48%Lives with <strong>Abuse</strong>rLives With <strong>Abuse</strong>r 27.96% 35.46% 66.67%PovertyBelow Poverty 96.92% 0.00% 31.53%ABUSER INFORMATIONAge GroupsTotal Number of <strong>Abuse</strong>rs = 5778 Total Number of <strong>Abuse</strong>rs = 1521 Total Number of <strong>Abuse</strong>rs = 668Total Number of Agencies = 38 Total Number of Agencies = 8 Total Number of Agencies = 1918 or younger 2.63% 8.19% 7.68%18-45 50.08% 43.65% 44.57%46-59 27.70% 25.96% 25.09%60 and older 19.58% 22.19% 22.66%Total* 31.55% 90.66% 79.94%GenderMale 68.90% 65.14% 66.87%Female 31.10% 34.86% 33.13%Total Gender* 68.40% 97.50% 98.95%RelationshipSpouse/Partner 29.07% 24.03% 23.02%Own Adult Children 36.24% 47.99% 43.14%Son-in-law/Daughter-in-law 3.57% 0.27% 0.15%Grandchild 8.71% 9.15% 10.37%Friends/Neighbors 4.68% 1.02% 1.37%Paid Home Attendant 1.19% 0.00% 0.46%O<strong>the</strong>r Relatives 9.12% 16.66% 17.07%O<strong>the</strong>r non-relatives 7.42% 0.89% 4.42%Total relationship* 63.95% 96.32% 98.20%*Total = percentage of cases reporting data in <strong>the</strong> category96 | U n d e r t h e R a d a r : N e w Y o r k S t a t e E l d e r A b u s e P r e v a l e n c e S t u d y
Capital Region, MohawkValley, North CountryCentral <strong>New</strong> <strong>York</strong>,Sou<strong>the</strong>rn TierFinger LakesWestern <strong>New</strong> <strong>York</strong>43.47% 33.22% 49.67% 61.93%31.09% 22.03% 24.18% 11.36%8.61% 25.87% 14.38% 13.64%36.07% 1.75% 0.00% 0.00%1.48% 9.44% 4.58% 2.84%43.47% 7.69% 4.58% 1.14%31.09% 19.23% 11.11% 12.50%61.73% 55.24% 59.02% 66.93%48.21% 58.18% 58.96% 57.89%Total Number of <strong>Abuse</strong>rs = 855 Total Number of <strong>Abuse</strong>rs = 523 Total Number of <strong>Abuse</strong>rs = 777 Total Number of <strong>Abuse</strong>rs = 408Total Number of Agencies = 49 Total Number of Agencies = 34 Total Number of Agencies = 26 Total Number of Agencies = 1112.76% 16.30% 8.92% 11.39%41.51% 39.51% 38.17% 42.62%21.46% 20.99% 26.76% 26.16%24.26% 23.21% 26.14% 19.83%83.39% 77.44% 62.03% 58.09%65.25% 65.95% 56.61% 65.47%34.75% 34.05% 43.39% 34.53%99.30% 98.28% 97.30% 95.83%24.63% 24.28% 21.35% 17.29%37.87% 34.42% 43.78% 39.35%1.23% 2.68% 0.31% 0.00%12.01% 12.05% 9.06% 10.53%1.59% 3.44% 6.14% 5.76%0.25% 0.57% 0.15% 0.25%18.87% 16.25% 11.67% 18.30%3.55% 6.31% 7.53% 8.52%95.44% 100.00% 83.78% 97.79%S e l f R e p o r t e d P r e v a l e n c e a n d D o c u m e n t e d C a s e S u r v e y s F i n a l R e p o r t 2 0 1 1 | 97
AGGREGATE CASE DATA BY REGION (continued)ELDER ABUSE AGGREGATEREGIONAL DATAREFERRAL INFORMATIONReferral From<strong>New</strong> <strong>York</strong> City Long Island Mid-Hudson RegionAdult Protective Services 0.40% 1.83% 3.36%Community Agency 9.76% 2.90% 4.62%District Attorney 5.90% 0.00% 6.30%Domestic Violence Programs 0.64% 0.31% 0.00%<strong>Elder</strong> <strong>Abuse</strong> Programs 3.40% 0.00% 0.00%Financial Institution 0.48% 1.53% 0.84%Health Care Provider 8.19% 5.80% 16.39%Homecare 3.55% 4.89% 6.72%Law Enforcement 25.60% 2.75% 9.24%Office for <strong>the</strong> Aging 2.38% 1.07% 5.88%Anonymous 6.14% 1.83% 2.10%Concerned Citizen 1.07% 0.15% 1.26%Family Member 15.43% 6.26% 13.45%Friends/Neighbors 4.29% 2.14% 3.78%Perpetrator 0.05% 0.00% 0.42%Victim 14.71% 64.58% 5.88%O<strong>the</strong>r total 3.38% 5.04% 20.17%Referral ToAdult Protective Services 18.72% 4.71% 27.97%Community Agency 21.60% 69.58% 11.02%District Attorney 3.20% 68.24% 0.85%Domestic Violence Programs 5.26% 10.42% 14.41%<strong>Elder</strong> <strong>Abuse</strong> Programs 23.84% 0.00% 1.69%Family Court 2.47% 69.41% 0.85%Health Care Provider 10.66% 60.17% 15.25%Law Enforcement 5.77% 69.41% 2.54%Office for <strong>the</strong> Aging 1.97% 0.00% 0.85%O<strong>the</strong>r 26.50% 4.37% 25.42%Percentage of VictimsNot Referred to O<strong>the</strong>rAgenicesPercentage of AgenciesReporting No VictimReferrals At AllDomestic Incident Reports (DIRs)Percentage of cases withcompleted DIRs54.76% 8.66% 35.71%46.81% 20.00% 28.57%4.62% 100.00% 92.55%98 | U n d e r t h e R a d a r : N e w Y o r k S t a t e E l d e r A b u s e P r e v a l e n c e S t u d y
Capital Region, MohawkValley, North CountryCentral <strong>New</strong> <strong>York</strong>,Sou<strong>the</strong>rn TierFinger LakesWestern <strong>New</strong> <strong>York</strong>3.46% 33.22% 5.04% 1.83%3.14% 7.69% 7.72% 8.54%1.89% 22.03% 0.79% 0.00%3.14% 25.87% 1.89% 0.00%0.00% 1.75% 0.31% 0.00%1.26% 19.23% 1.89% 7.93%9.75% 33.22% 9.29% 14.02%4.09% 22.03% 6.61% 4.88%24.84% 9.44% 32.44% 7.32%5.35% 25.87% 0.79% 2.44%2.20% 4.46% 1.26% 3.66%0.63% 0.74% 0.31% 1.22%8.81% 13.38% 15.43% 14.02%3.14% 5.95% 1.10% 4.27%0.00% 0.00% 0.00% 0.00%9.75% 5.95% 3.94% 6.10%19.81% 11.90% 34.33% 23.78%20.36% 30.83% 38.38% 20.00%25.34% 24.81% 27.27% 6.00%8.14% 8.27% 4.04% 8.00%24.89% 32.33% 24.24% 30.00%2.26% 4.51% 5.05% 6.00%12.67% 18.80% 5.05% 6.00%25.34% 42.86% 30.30% 26.00%7.69% 34.59% 6.06% 10.00%7.69% 27.82% 9.09% 6.00%17.19% 18.05% 12.12% 20.00%16.90% 12.57% 21.78% 14.20%29.03% 19.44% 19.35% 31.58%92.70% 97.07% 46.79% 98.36%S e l f R e p o r t e d P r e v a l e n c e a n d D o c u m e n t e d C a s e S u r v e y s F i n a l R e p o r t 2 0 1 1 | 99
APPENDIX DDOCUMENTED CASE STUDY DATA BY REGIONDISCUSSIONOf those agencies/programs that reported serving elder abuse victims and could provide aggregate elder abusecase data, not all could provide aggregate elder abuse case data for every data element requested. Requested dataelements included:■ Total number of elder abuse and neglect victims assisted in <strong>the</strong> calendar year■ Types of elder abuse on caseload■ Number of victims suffering from each type of abuse■ Age categories of victims and abusers■ Gender of victims and abusers■ Race/ethnicity of victims■ Relationship of abusers to victims■ Poverty status of victims■ From what sources responding agency/program received elder abuse case referrals■ To what programs/services responding agency/program made elder abuse case referralsDocumented case study data by region must be understood within <strong>the</strong> context of <strong>the</strong> total aggregatenumber of victims that were reported by respondent agencies in each region and whe<strong>the</strong>r those respondingagencies/programs that reported serving elder abuse victims were able to provide responses to every requesteddata element. This appended regional report focuses on aggregate data elements for reported elder abuse victimsserved in calendar year 2008.Respondents were asked to provide elder abuse case level data in <strong>the</strong> aggregate for each data element. Thefollowing discussion of findings by region for each data element reflects aggregate case data as reported byrespondent agencies/programs. In each region, <strong>the</strong>re are varying levels of missing data for each data element.Data elements by region are reported only if at least 50% of aggregate victim data was reported for that elementin completed surveys.Consistent reporting of data on poverty, Domestic Incident Reports (DIRs) and living arrangements ofvictims was not available for all regions.100 | U n d e r t h e R a d a r : N e w Y o r k S t a t e E l d e r A b u s e P r e v a l e n c e S t u d y
REGION 1: NEW YORK CITYRegion 1 is comprised of five counties within <strong>the</strong> <strong>New</strong> <strong>York</strong> City area; in total, 5,303 victims of elder abuse wereserved throughout Region 1, yielding a rate of 3.8 per 1,000 older adults.Type of <strong>Abuse</strong>When types of abuse were reported, 48.1% of reported victims experienced emotional abuse; 34.7% experiencedfinancial abuse; 10.9% experienced neglect; 44.2% experienced physical abuse and .71% experienced sexualabuse. Aggregate data reported included victims who experienced multiple forms of abuse. For example, elderabuse victims who were provided services for both physical and emotional abuse could be included in aggregatedata reported in both categories.Age Groups of VictimsWhen age groups of victims were reported, 24.9% were reported in <strong>the</strong> 60-64 age category; 35.1% were reportedin <strong>the</strong> 65-74 age category: 26.4% were reported in <strong>the</strong> 75-84 age category and 13.7% were reported in <strong>the</strong> 85+age category.Gender of VictimsWhen gender of victims was reported, 33.8% were identified as male victims and 66.2% were identified asfemale victims.Race/Ethnicity of VictimsWhen race/ethnicity of victims was reported, 33.1% were reported as African-American; 4.9% as Asian/PacificIslander; 25.9% as Hispanic/Latino; 0.31% as Native American/Aleut Eskimo; 33.4% as Caucasian and 2.3%victims were reported as “o<strong>the</strong>r race.”ABUSER INFORMATIONWhen aggregate abuser data were reported, a total of 5,778 abusers were identified in <strong>the</strong> five counties of Region1 during calendar year 2008.Age Groups of <strong>Abuse</strong>rsWhen age category of abusers was reported, 2.6% of abusers were identified as 18 years of age or younger; 50.1%were in <strong>the</strong> 18-45 years of age category; 27.7% were in <strong>the</strong> 46-59 age category and 19.6% were in <strong>the</strong> age categoryof 60 years and older.<strong>Abuse</strong>r GenderWhen gender of abusers was reported, 68.9% were male abusers and 31.1% female abusers.S e l f R e p o r t e d P r e v a l e n c e a n d D o c u m e n t e d C a s e S u r v e y s F i n a l R e p o r t 2 0 1 1 | 101
<strong>Abuse</strong>r Relationship with VictimWhen aggregate data on victim and abuser relationships was reported, victims’ abusers included spouses orpartners, 29.1%; own adult children, 36.2%; sons or daughters-in-law, 3.6%; grandchildren, 8.7%; friends orneighbors, 4.7%; paid home care workers, 1.2%; o<strong>the</strong>r relatives, 9.1% and o<strong>the</strong>r non-relatives, 7.4%.INFORMATION ON SOURCES OF ELDER ABUSE REFERRALS RECEIVED BYRESPONDENT AGENCIESVictim referrals were received from both formal and informal sources:Formal service system referrals received byrespondent agency/programsRespondent agency/programs in Region 1 reported receiving elder abuse referrals from <strong>the</strong> following agencies:Adult Protective Services (0.40%), district attorneys (5.9%), domestic violence programs (0.64%), elder abuseprograms (3.4%), law enforcement (25.6%), community-based agencies such as Office of Victim Servicesprograms (9.8%), financial institutions (0.48%), healthcare programs (8.2%), homecare programs (3.6%), andArea Agencies on Aging (2.4%).Informal system referralsRespondent agency/programs in Region 1 also received referrals from elder abuse victims <strong>the</strong>mselves (14.7%),perpetrators (0.05%), family members (15.4%), friends and neighbors (4.3%), concerned citizens (1.1%) andanonymous sources (6.1%).A total of 3.4% of victims in Region 1 were referred from “o<strong>the</strong>r referral sources,” both formal and informal,including: colleague, attorney, government, hospital and media.INFORMATION ON REFERRALS MADE BY RESPONDENT AGENCIES TOOTHER SERVICES AND PROGRAMSVictims may be referred to multiple agencies and programs by respondent agencies. A total of 18.7% victimswere referred to Adult Protective Services. Respondent agency/programs reported referring 21.6% of cases tocommunity-based agencies such as Office of Victim Services programs, 3.2% to district attorneys’ offices,5.3% to domestic violence programs, 23.8% to elder abuse programs, 2.5% to Family Court, 10.7% tohealthcare services, 5.8% to law enforcement, 2% to Area Agencies on Aging and 26.5% of cases to “o<strong>the</strong>r.”Referrals to “o<strong>the</strong>r” in Region 1 included referrals for financial assistance, housing, immigration, lockreplacement and legal services.102 | U n d e r t h e R a d a r : N e w Y o r k S t a t e E l d e r A b u s e P r e v a l e n c e S t u d y
REGION 2: LONG ISLANDRegion 2 consists of two counties, Nassau and Suffolk, within <strong>the</strong> Long Island area; in total, 1,998 victims ofelder abuse were served throughout Region 2, yielding a rate of 3.6 per 1,000 older adults.Type of <strong>Abuse</strong>When types of abuse were reported, 63.7% of reported victims experienced emotional abuse; 15.9% experiencedfinancial abuse; 9.7% experienced neglect; 26.7% experienced physical abuse and 1.7% experienced sexual abuse.Age Groups of VictimsWhen age categories of victims were reported, 5.6% victims were in <strong>the</strong> 60-64 age category, 53.1% were in <strong>the</strong>65-74 age category, 30.1% were in <strong>the</strong> 75-84 age category, and 11.2% were in <strong>the</strong> 85+ age category.Gender of VictimsWhen gender of victims was reported, 27.2% victims were reported as male victims and 72.8% were reportedas female victims.Race/Ethnicity of VictimsWhen victims’ race/ethnicity was reported, 18.3% victims were African-American; 0.78% were Asian/Pacific Islander;3.3% were Hispanic/Latino; 0.26% were Native American/Aleut Eskimo; 68.8% were Caucasian; and 8.5% wereidentified as “o<strong>the</strong>r race.”Lives with <strong>Abuse</strong>rWhen victims’ living arrangements with <strong>the</strong>ir abusers were reported, over one-third (35.5%) of identifiedvictims were reported to be living with <strong>the</strong>ir abusers.ABUSER INFORMATIONWhen aggregate data on abusers of elder abuse victims was reported in Region 2, a total of 1,521 abusers wereidentified in <strong>the</strong> two counties (Nassau and Suffolk) of Region 2 during calendar year 2008.Age Groups of <strong>Abuse</strong>rsWhen age categories of abusers were identified, 8.2% of abusers were reported to be younger than 18 years ofage; 43.7% were in <strong>the</strong> 18-45 years of age category; 26% were in <strong>the</strong> 46-59 age category and 22.2% were in <strong>the</strong>age category of 60 years and older.S e l f R e p o r t e d P r e v a l e n c e a n d D o c u m e n t e d C a s e S u r v e y s F i n a l R e p o r t 2 0 1 1 | 103
<strong>Abuse</strong>r GenderWhen gender of abusers was identified, 65.1% abusers were male and 34.9% abusers were female.<strong>Abuse</strong>r Relationship with VictimWhen aggregate data on victim and abuser relationships was reported, 24% were spouses or partners; 48% werevictims’ own adult children; 0.27% were victims’ sons or daughters-in-law; 9.2% were victims’ grandchildren;1% were friends or neighbors; 16.7% were o<strong>the</strong>r relatives and 0.90% were o<strong>the</strong>r non-relatives. No respondentagency/program reported that paid home care workers were abusers.INFORMATION ON SOURCES OF ELDER ABUSE REFERRALS RECEIVED BYRESPONDENT AGENCIESVictim referrals were received from both formal and informal sources:Formal service system referrals received byrespondent agency/programsRespondent agency/programs in Region 2 reported receiving elder abuse referrals from <strong>the</strong> following agencies:Adult Protective Services (1.8%); no referrals were received from district attorneys; domestic violence programs(0.31%); no referrals were received from elder abuse programs; law enforcement (2.8%); community-basedagencies such as Office of Victim Services programs (2.9%); financial institutions (1.5%); healthcare programs(5.8%); homecare programs (4.9%) and Area Agencies on Aging (1.1%).Informal system referralsRespondent agency/programs in Region 2 also received referrals from elder abuse victims <strong>the</strong>mselves (64.6%);no referrals were received from perpetrators; family members (6.3%); friends and neighbors (2.1%); concernedcitizens (0.15%) and anonymous sources (1.8%).A total of 5% of victims in Region 2 were referred from “o<strong>the</strong>r referral sources,” both formal and informal,including acquaintances, building manager, social worker, department of social services, housing authoritiesand private <strong>the</strong>rapies (sic).INFORMATION ON REFERRALS TO RESPONDENT AGENCIESVictims may be referred to multiple agencies and programs by respondent agencies. A total of 4.7% of elderabuse victims were referred to Adult Protective Services, 69.6% to community-based agencies such as Office ofVictim Services programs, 68.2% to district attorneys’ offices, 10.4% to domestic violence programs, none to104 | U n d e r t h e R a d a r : N e w Y o r k S t a t e E l d e r A b u s e P r e v a l e n c e S t u d y
elder abuse programs, 69.4% to Family Court, 60.2% to healthcare services, 69.4% to law enforcement, none toArea Agencies on Aging and 4.4% to “o<strong>the</strong>r.”Referrals to “o<strong>the</strong>r” in Region 2 included referrals to Veterans Affairs and <strong>the</strong>rapeutic services.REGION 3: MID-HUDSONRegion 3 consists of seven counties located within <strong>the</strong> Mid-Hudson area; in total, 1,031 victims of elder abusewere served throughout Region 3, yielding a rate of 2.5 per 1,000 older adults.Type of <strong>Abuse</strong>When types of abuse were reported, 40.2% of victims experienced emotional abuse; 28.4% experienced financialabuse; 11.5% experienced neglect; 34.4% experienced physical abuse and 0.32% experienced sexual abuse.Age Groups of VictimsWhen victims’ age categories were reported, 2.9% victims were reported to be in <strong>the</strong> 60-64 age category; 48.3%were in <strong>the</strong> 65-74 age category; 31.1% were in <strong>the</strong> 75-84 age category and 17.7% were in <strong>the</strong> 85+ age category.Gender of VictimsWhen victims’ gender was reported, 30.9% victims were male victims and 69.1% were female victims.Race/Ethnicity of VictimsWhen victims’ race/ethnicity was reported, 17.5% of victims were reported as African-American; 0.56% wereAsian/Pacific Islander; 6.8% were Hispanic/Latino; no victims of abuse were Native American/Aleut Eskimo;65.9% were Caucasian and 9.3% were identified as “o<strong>the</strong>r race.”Lives with <strong>Abuse</strong>rWhen victims’ living arrangements with <strong>the</strong>ir abusers were reported, over two-thirds (66.7%) of identified victimslived with <strong>the</strong>ir abusers.ABUSER INFORMATIONA total of 19 respondent agencies/programs within Region 3 were able to provide some aggregate data on abusersof elder abuse victims, representing 668 abusers in <strong>the</strong> seven counties throughout Region 3 during calendar year 2008.Age Groups of <strong>Abuse</strong>rsWhen age categories of abusers were reported, 7.7% of abusers were identified as younger than 18 years of age;44.6% were in <strong>the</strong> 18-45 age category; 25.1% were in <strong>the</strong> 46-59 age category and 22.7% were in <strong>the</strong> age categoryof 60 years and older.S e l f R e p o r t e d P r e v a l e n c e a n d D o c u m e n t e d C a s e S u r v e y s F i n a l R e p o r t 2 0 1 1 | 105
<strong>Abuse</strong>r GenderWhen gender of abusers was identified, 66.9% of abusers were male and 33.1% were female.<strong>Abuse</strong>r Relationship with VictimWhen aggregate data on victim and abuser relationships was reported, 23% were spouses or partners; 43.1%were victims’ own adult children; 0.15% were victims’ sons or daughters-in-law; 10.4% were victims’ grandchildren;1.4% were friends or neighbors; 0.46% were paid home care workers; 17.1% were o<strong>the</strong>r relatives and 4.4% wereo<strong>the</strong>r non-relatives.INFORMATION ON SOURCES OF ELDER ABUSE REFERRALS RECEIVED BYRESPONDENT AGENCIESVictims were referred to respondent agencies/programs from both formal and informal sources.Formal service system referrals received byrespondent agency/programsRespondent agency/programs in Region 3 reported receiving elder abuse referrals from <strong>the</strong> following agencies:Adult Protective Services (3.4%), district attorneys (6.3%), law enforcement (9.2%), community-based agenciessuch as Office of Victim Services programs (4.6%), financial institutions (0.84%), healthcare programs (16.4%),homecare programs (6.7%) and Area Agencies on Aging (5.9%).Informal system referralsRespondent agency/programs in Region 3 also received referrals from elder abuse victims <strong>the</strong>mselves (5.9%),perpetrators (0.42%), family members (13.5%), friends and neighbors (3.8%), concerned citizens (1.3%) andanonymous sources (2.1%).A total of 20% of victims in Region 3 were also referred from “o<strong>the</strong>r referral sources,” both formal and informal,including: landlord, apartment manager, acquaintance, places of worship, attorneys, social services, courts andMedicaid unit.INFORMATION ON REFERRALS TO RESPONDENT AGENCIESVictims may be referred to multiple agencies and programs by respondent agencies. A total of 28% of victimswere referred to Adult Protective Services, 11% to community-based agencies such as Office of Victim Servicesprograms, 0.85% to district attorneys’ offices, 14.4% to domestic violence programs, 1.7% to elder abuse programs,0.85% to Family Court, 15.3% to healthcare services, 2.5% to law enforcement, 0.85% to Area Agencies onAging and 25.4% cases to “o<strong>the</strong>r.”Referrals to “o<strong>the</strong>r” in Region 3 included referrals to department of social services, Veterans Affairs and legal services.106 | U n d e r t h e R a d a r : N e w Y o r k S t a t e E l d e r A b u s e P r e v a l e n c e S t u d y
REGION 4: CAPITAL REGION, MOHAWK VALLEY, ANDNORTH COUNTRYRegion 4 consists of twenty counties located within <strong>the</strong> Capital Region, Mohawk Valley, and North Country area;in total, 1,018 victims of elder abuse were served throughout Region 4, yielding a rate of 2.7 per 1,000 older adults.Type of <strong>Abuse</strong>When types of abuse were identified, 43.5% of victims were reported as experiencing emotional abuse; 31.1%financial abuse; 8.6% neglect; 36.1% physical abuse and 1.5% sexual abuse.Age Groups of VictimsWhen age categories of victims were identified, 12.8% of victims were in <strong>the</strong> 60-64 years age category; 53.8%in <strong>the</strong> 65-74 years age category; 25.6% in <strong>the</strong> 75-84 years age category and 7.8% were in <strong>the</strong> 85 years and olderage category.Gender of VictimsWhen victims’ gender was reported, 34% victims were male and 66% were female.Race/Ethnicity of VictimsWhen victims’ race/ethnicity was reported, 9.2% of victims were reported as African-American; 0.23% wereAsian/Pacific Islander; 1.9% were Hispanic/Latino; 2.1% were Native American/Aleut Eskimo; 76.6% wereCaucasian and 10% were “o<strong>the</strong>r race.”ABUSER INFORMATIONA total of 49 respondent agencies/programs within Region 4 reported information on abusers of elder abusevictims, representing 855 abusers in <strong>the</strong> twenty counties throughout Region 4 during calendar year 2008.Age Groups of <strong>Abuse</strong>rsWhen age categories of abusers were reported, 12.8% abusers were younger than 18 years of age; 41.5% were in<strong>the</strong> 18-45 years of age category; 21.5% were in <strong>the</strong> 46-59 age category; and 24.3% were in <strong>the</strong> age category of 60years and older.<strong>Abuse</strong>r GenderWhen gender of abusers was reported, 65.3% of abusers were male and 34.8% female.S e l f R e p o r t e d P r e v a l e n c e a n d D o c u m e n t e d C a s e S u r v e y s F i n a l R e p o r t 2 0 1 1 | 107
<strong>Abuse</strong>r Relationship with VictimWhen aggregate data on victim and abuser relationships was reported, 24.6% were reported as spouse/partners;37.9% adult children; 1.2% sons-in-law /daughters-in-law; 12% grandchildren; 1.6% friends/neighbors;0.25% home attendants; 18.9% o<strong>the</strong>r relatives and 3.6% non-relatives.INFORMATION ON SOURCES OF ELDER ABUSE REFERRALS RECEIVED BYRESPONDENT AGENCIESVictim referrals were received from both formal and informal sources.Formal service system referrals received byrespondent agency/programsRespondent agency/programs in Region 4 reported receiving elder abuse referrals from <strong>the</strong> following agencies:Adult Protective Services (3.5%), district attorneys (1.9%), domestic violence programs (3.1%), elder abuseprograms (none-0%), law enforcement (24.8%), community-based agencies such as Office of Victim Servicesprograms (3.1%), financial institutions (1.3%), healthcare programs (9.8%), homecare programs (4.1%), andArea Agencies on Aging (5.4%).Informal system referralsRespondent agency/programs in Region 4 also received referrals from elder abuse victims <strong>the</strong>mselves (9.8%),perpetrators (none - 0%), family members (8.8%), friends and neighbors (3.1%), concerned citizens (0.63%),anonymous sources (2.2%).A total of 19.8% of victims in Region 4 were referred from “o<strong>the</strong>r referral sources,” both formal and informal,including: landlords, acquaintance, Family Court, social services, Veterans Affairs, Joint Council on EconomicOpportunity, and heating and cooling company.INFORMATION ON REFERRALS TO RESPONDENT AGENCIESVictims may be referred to multiple agencies and programs by respondent agencies. A total of 20.4% of victimswere referred to Adult Protective Services, 25.3% to community-based agencies such as Office of Victim Servicesprograms, 8.1% to district attorneys’ offices, 24.9% to domestic violence programs, 2.3% to elder abuse programs,12.7% to Family Court, 25.3% to healthcare services, 7.7% to law enforcement, 7.7% to Area Agencies on Agingand 17.2% to “o<strong>the</strong>r.”Referrals to “o<strong>the</strong>r” in Region 4 included referrals to landlords and houses of worship and for housing, food andsocial services.108 | U n d e r t h e R a d a r : N e w Y o r k S t a t e E l d e r A b u s e P r e v a l e n c e S t u d y
REGION 5: CENTRAL NEW YORK AND SOUTHERN TIERRegion 5 consists of thirteen counties located within <strong>the</strong> Central <strong>New</strong> <strong>York</strong> and Sou<strong>the</strong>rn Tier area; in total, 641victims of elder abuse were served throughout Region 5, yielding a rate of 2.3 per 1,000 older adults.Type of <strong>Abuse</strong>When types of abuse were reported, 50% of victims were reported as experiencing emotional abuse; 36.6%experienced financial abuse; 15.9% experienced neglect; 39.8% experienced physical abuse and 3% experiencedsexual abuse.Age Groups of VictimsWhen age categories of victims were reported, 11.8% of victims were in <strong>the</strong> 60-64 years age range; 51.4% in <strong>the</strong>65-74 years age range; 25.7% in <strong>the</strong> 75-84 years age range and 11.2% in <strong>the</strong> 85 years and older age range.Gender of VictimsWhen gender of victims was reported within Region 5, 33.9% were male and 66.1% were female.Race/Ethnicity of VictimsWhen victims’ race/ethnicity was reported, 4.2% were African-American; 0.51% were Asian/Pacific Islander;0.68% were Hispanic/Latino; 1% were Native American/Aleut Eskimo; 67.3% were Caucasian; and 26.3% wereidentified as “o<strong>the</strong>r race.”ABUSER INFORMATIONA total of 34 respondent agencies/programs within Region 5 reported information on abusers of elder abusevictims, representing 523 abusers in <strong>the</strong> 13 counties throughout <strong>the</strong> Central <strong>New</strong> <strong>York</strong> and Sou<strong>the</strong>rn TierRegion (Region 5) during calendar year 2008.Age Groups of <strong>Abuse</strong>rsWhen age categories of abusers were reported, 16.3% abusers were identified as younger than 18 years of age;39.5% were in <strong>the</strong> 18-45 years of age category; 20.9% were in <strong>the</strong> 46-59 age category; and 23.2% were in <strong>the</strong> agecategory of 60 years and older.<strong>Abuse</strong>r GenderWhen gender of abusers was reported, 65.9% were male and 34% were female.S e l f R e p o r t e d P r e v a l e n c e a n d D o c u m e n t e d C a s e S u r v e y s F i n a l R e p o r t 2 0 1 1 | 109
<strong>Abuse</strong>r Relationship with VictimWhen aggregate data on victim and abuser relationships were reported, 24.28% were spouses or partners,34.43% were victims’ own adult children, 2.68% were victims’ sons or daughters-in-law, 12.05% were victims’grandchildren, 3.44% were friends or neighbors, 0.57% were paid home care workers, 16.25% were o<strong>the</strong>r relativesand 6.31% were o<strong>the</strong>r non-relatives.INFORMATION ON SOURCES OF ELDER ABUSE REFERRALS RECEIVED BYRESPONDENT AGENCIESVictim referrals were received from both formal and informal sources.Formal service system referrals received byrespondent agency/programsRespondent agency/programs in Region 5 reported receiving elder abuse referrals from <strong>the</strong> following agencies:Adult Protective Services (33.2%), district attorneys (22%), domestic violence programs (25.9%), elder abuseprograms (1.8%), law enforcement (9.4%), community-based agencies such as Office of Victim Servicesprograms (7.7%), financial institutions (19.2%), healthcare providers (33.2%), homecare programs (22%) andArea Agencies on Aging (25.9%).Informal system referralsRespondent agency/programs in Region 5 also received referrals from elder abuse victims <strong>the</strong>mselves (6%),perpetrators (none-0%), family members (13.4%), friends and neighbors (6%), concerned citizens (0.74%) andanonymous sources (4.5%).A total of 11.9% of victims in Region 5 were referred from “o<strong>the</strong>r referral sources,” both formal and informal,including: acquaintance, guardianship hearing, courts, judges and department of social services.INFORMATION ON REFERRALS TO RESPONDENT AGENCIESVictims may be referred to multiple agencies and programs by respondent agencies. A total of 30.8% of victimswere referred to Adult Protective Services; 24.8% to community-based agencies such as Office of Victim Servicesprograms; 8.3% to district attorneys’ offices, 32.3% to domestic violence programs, 4.5% to elder abuse programs,18.8% to Family Court, 42.9% to healthcare services, 34.6% to law enforcement; 27.8% to Area Agencies onAging and 18.1% to “o<strong>the</strong>r.”Referrals to “o<strong>the</strong>r” in Region 5 included referrals to animal control, support groups, attorneys and social services.110 | U n d e r t h e R a d a r : N e w Y o r k S t a t e E l d e r A b u s e P r e v a l e n c e S t u d y
REGION 6: FINGER LAKESRegion 6 consists of ten counties located within <strong>the</strong> Finger Lakes area; in total, 770 victims of elder abuse wereserved throughout Region 6, yielding a rate of 3.4 per 1,000 older adults.Type of <strong>Abuse</strong>When types of abuse were reported, 28.3% of victims were reported as experiencing emotional abuse; 43.4%experienced financial abuse; 10.4% experienced neglect; 24.9% experienced physical abuse and 0.38% experiencedsexual abuse.Age Groups of VictimsWhen age categories of victims were reported, 9.2% were in <strong>the</strong> 60-64 age category; 39.8% were in <strong>the</strong> 65-74age category; 35.9% were in <strong>the</strong> 75-84 age category and 15.1% were in <strong>the</strong> 85+ age category.Gender of VictimsWhen victims’ gender was reported, 36.6% victims were identified as male and 63.4% were identified as female.Race/Ethnicity of VictimsWhen victims’ race/ethnicity was reported, 13.2% of victims were reported as African-American; 0.22% wereAsian/Pacific Islander; 2.2% were Hispanic/Latino; 1.9% were Native American/Aleut Eskimo; 74.6% wereCaucasian and 8% were “o<strong>the</strong>r race.”Lives with <strong>Abuse</strong>rWhen victims’ living arrangements with <strong>the</strong>ir abusers were reported, over 59% of identified victims werereported to be living with <strong>the</strong>ir abusers.ABUSER INFORMATIONA total of 26 respondent agencies/programs within Region 6 reported information on abusers of elder abusevictims, representing 777 abusers throughout <strong>the</strong> ten counties located within <strong>the</strong> Finger Lakes region duringcalendar year 2008.Age Groups of <strong>Abuse</strong>rsWhen age categories of abusers were reported, 8.9% abusers were identified as younger than 18 years of age;38.2% were in <strong>the</strong> 18-45 years of age category; 26.8% were in <strong>the</strong> 46-59 years of age category and 26.1% werein <strong>the</strong> age category of 60 years and older.S e l f R e p o r t e d P r e v a l e n c e a n d D o c u m e n t e d C a s e S u r v e y s F i n a l R e p o r t 2 0 1 1 | 111
<strong>Abuse</strong>r GenderWhen abusers’ gender was reported, 56.6% were male and 43.4% were female.<strong>Abuse</strong>r Relationship with VictimWhen aggregate data on victim and abuser relationships was reported, 21.4% were spouses or partners; 43.8%were victims’ own adult children; 0.31% were victims’ sons-in-law or daughters-in-law; 9.1% were victims’grandchildren; 6.1%; were friends or neighbors; 0.15% were paid home care workers; 11.7% were o<strong>the</strong>r relativesand 7.5% were o<strong>the</strong>r non-relatives.INFORMATION ON SOURCES OF ELDER ABUSE REFERRALS RECEIVED BYRESPONDENT AGENCIESVictims were referred to respondent agencies by formal and informal sources.Formal service system referrals received byrespondent agency/programsRespondent agency/programs in Region 6 reported receiving elder abuse referrals from <strong>the</strong> following agencies:Adult Protective Services (5%), district attorneys (0.79%), domestic violence programs (1.9%), elder abuseprograms (0.31%), law enforcement (32.4%), community-based agencies such as Office of Victim Servicesprograms (7.7%), financial institutions (1.9%), healthcare programs (9.3%), homecare programs (6.6%) andArea Agencies on Aging (0.79%).Informal system referralsRespondent agency/programs in Region 6 also received referrals from elder abuse victims <strong>the</strong>mselves (3.9%),no referrals from perpetrators, family members (15.4%), friends and neighbors (1.1%), concerned citizens(0.31%) and anonymous sources (1.3%).A total of 34.3% of victims in Region 6 were referred from “o<strong>the</strong>r referral sources,” both formal and informal,including: acquaintance, building managers, department of social services, courts and legal aid.Information on Referrals to respondent agenciesVictims may be referred to multiple agencies and programs by respondent agencies. A total of 38.4% of caseswere referred to Adult Protective Services. Respondent agency/programs also reported referring 27.3% ofvictims to community-based agencies such as Office of Victim Services programs, 4% to district attorneys’offices, 24.2% to domestic violence programs, 5.1% to elder abuse programs, 5.1% to Family Court, 30.3% tohealthcare services, 6.1% to law enforcement, 9.1% to Area Agencies on Aging and 12.1% of victims to “o<strong>the</strong>r.”Referrals to “o<strong>the</strong>r” in Region 6 included referrals to legal aid and Surrogate’s Court.112 | U n d e r t h e R a d a r : N e w Y o r k S t a t e E l d e r A b u s e P r e v a l e n c e S t u d y
REGION 7: WESTERN NEW YORKRegion 7 consists of five counties located within <strong>the</strong> Western <strong>New</strong> <strong>York</strong> area; in total, 671 victims of elder abusewere served throughout Region 7, yielding a rate of 2.3 per 1,000 older adults.Type of <strong>Abuse</strong>When types of abuse were reported, 30% of victims experienced emotional abuse; 39.3% experienced financialabuse; 10.9% experienced neglect; 31.3% experienced physical abuse and 1.6% experienced sexual abuse.Age Groups of VictimsWhen age categories of victims were reported, 6.7% were in <strong>the</strong> 60-64 age category; 46.2% were in <strong>the</strong> 65-74age category; 34% were in <strong>the</strong> 75-84 age category and 13.2% were in <strong>the</strong> 85+ age category.Gender of VictimsWhen victims’ gender was reported, 31.3% victims were identified as male and 68.7% were identified as female.Race/Ethnicity of VictimsWhen victims’ race/ethnicity was reported, 9.7% victims were African-American; 2% were Hispanic/Latino;0.22% were Native American/Aleut Eskimo; 64.1% were Caucasian and 24% were reported as “o<strong>the</strong>r race.”There were no reported Asian/Pacific islander victims.ABUSER INFORMATIONWhen aggregate data on abusers of elder abuse victims was reported in Region 7, a total of 408 abusers werereported in <strong>the</strong> five counties throughout Western <strong>New</strong> <strong>York</strong> (Region 7) during calendar year 2008.Age Groups of <strong>Abuse</strong>rsWhen age categories of abusers were identified, 11.4% of abusers were identified as under 18 years of age; 42.6%were in <strong>the</strong> 18-45 years of age category; 26.2% were in <strong>the</strong> 46-59 age category and 19.8% were in <strong>the</strong> age categoryof 60 years and older.<strong>Abuse</strong>r GenderWhen abusers’ gender was identified, 65.5% were male and 34.5% were female.S e l f R e p o r t e d P r e v a l e n c e a n d D o c u m e n t e d C a s e S u r v e y s F i n a l R e p o r t 2 0 1 1 | 113
<strong>Abuse</strong>r Relationship with VictimWhen aggregate data on victim and abuser relationships was reported, 17.3% were spouses or partners; 39.4%were victims’ own adult children; 10.5% were victims’ grandchildren; 5.8% were friends or neighbors; 0.25%were paid home care workers; 18.3% were o<strong>the</strong>r relatives and 8.5% were o<strong>the</strong>r non-relatives. There were noreported son or daughter-in-law abusers in Region 7 for 2008.INFORMATION ON SOURCES OF ELDER ABUSE REFERRALS RECEIVED BYRESPONDENT AGENCIESVictim referrals were received from both formal and informal sources.Formal service system referrals received byrespondent agency/programsRespondent agency/programs in Region 7 reported receiving elder abuse referrals from <strong>the</strong> following agencies:Adult Protective Services (1.8%), law enforcement (7.3%), community-based agencies such as Office of VictimServices programs (8.5%), financial institutions (7.9%), healthcare programs (14%), homecare programs (4.9%)and Area Agencies on Aging (2.4%). There were no reported referrals from district attorneys (0%), domesticviolence programs (0%) or elder abuse programs (0%),Informal system referralsRespondent agency/programs in Region 7 also received referrals from elder abuse victims <strong>the</strong>mselves (6.1%),family members (14%), friends and neighbors (4.3%), concerned citizens (1.2%) and anonymous sources(3.7%).A total of 23.8% of victims in Region 7 were referred from “o<strong>the</strong>r referral sources,” both formal and informal,including: law enforcement, court, attorneys, hospital, clergy, home care, primary care physicians, landlords andconsumer credit authority.INFORMATION ON REFERRALS TO RESPONDENT AGENCIESVictims may be referred to multiple agencies and programs by respondent agencies. A total of 20% of victimswere referred to Adult Protective Services. Respondent agency/programs also reported referring 6% of victimsto community-based agencies such as Office of Victim Services programs, 8% to district attorneys’ offices, 30% todomestic violence programs, 6% to elder abuse programs, 6% to Family Court, 26% to healthcare services, 10% tolaw enforcement, 6% to Area Agencies on Aging and 20% of cases to “o<strong>the</strong>r.”Referrals to “o<strong>the</strong>r” in Region 7 included referrals to attorneys and Veterans Affairs.114 | U n d e r t h e R a d a r : N e w Y o r k S t a t e E l d e r A b u s e P r e v a l e n c e S t u d y
APPENDIX EDOCUMENTED CASE STUDYAGGREGATE DATA BY SERVICE SYSTEMELDER ABUSE AGGREGATESERVICE SYSTEM DATAAdult ProtectiveServicesLawEnforcementDistrictAttorneyCommunity-BasedOrganizationsVICTIM INFORMATIONType of <strong>Abuse</strong>Total Number of Total Number of Total Number of Total Number ofVictims = 2180 Victims = 4905 Victims = 1560 Victims = 4703Total Number ofAgencies = 57Total Number ofAgencies = 59Total Number ofAgencies = 18Total Number ofAgencies = 96Emotional <strong>Abuse</strong> 8.8% 55.37% 68.91% 51.09%Financial <strong>Abuse</strong> 65.77% 14.7% 38.05% 13.37%Neglect 37.93% 0.12% 0.55% 12.18%Physical 33.66% 54.06% 18.83% 29.61%Sexual 0.15% 0.12% 0.86% 2.71%Age Groups60-64 9.65% 13.70% 30.55% 21.49%65-74 26.41% 56.86% 35.09% 32.27%75-84 36.69% 24.73% 22.73% 30.36%85+ 27.25% 4.71% 11.64% 15.87%GenderMale 30.32% 34.21% 59.55% 24.08%Female 69.68% 65.79% 40.45% 75.92%Race/EthnicityAfrican American 20.46% 23.30% 24.73% 18.52%Asian/Pacific Islander 0.00% 2.52% 5.58% 3.49%Caucasian 31.97% 61.48% 59.57% 54.92%Hispanic/Latino 12.78% 11.02% 9.57% 18.52%Native American/Aleut Eskimo 1.38% 0.45% 0.00% 0.29%Race O<strong>the</strong>r 33.41% 1.23% 0.27% 4.25%Living ArrangementAlone 42.11% 0.00% 40.91% 51.94%Spouse/Partner 12.74% 0.00% 31.82% 23.49%Children 18.95% 0.00% 4.55% 14.72%Son/Daughter-in-Law 11.02% 0.00% 0.00% 0.45%Grandchild 6.87% 0.00% 9.09% 5.42%O<strong>the</strong>r Relative 6.20% 0.00% 0.00% 2.44%O<strong>the</strong>r Non Relative 12.41% 0.00% 13.64% 2.89%Lives With <strong>Abuse</strong>rLives With <strong>Abuse</strong>r 0.00% 50.78% 29.73% 22.55%PovertyBelow Poverty 0.00% 0.00% 0.00% 59.41%S e l f R e p o r t e d P r e v a l e n c e a n d D o c u m e n t e d C a s e S u r v e y s F i n a l R e p o r t 2 0 1 1 | 115
AGGREGATE DATA BY SERVICE SYSTEM (continued)ELDER ABUSE AGGREGATESERVICE SYSTEM DATAABUSER INFORMATIONAge GroupsAdult ProtectiveServicesTotal Number of<strong>Abuse</strong>rs = 1338Total Number ofAgencies = 54LawEnforcementTotal Number of<strong>Abuse</strong>rs = 4889Total Number ofAgencies = 59DistrictAttorneyTotal Number of<strong>Abuse</strong>rs = 1133Total Number ofAgencies = 10Community-BasedOrganizationsTotal Number of<strong>Abuse</strong>rs = 3170Total Number ofAgencies = 6418 or younger 0.79% 11.54% 4.53% 2.47%18-45 40.58% 43.82% 64.48% 36.11%46-59 34.55% 24.06% 21.91% 28.86%60 and older 24.08% 20.57% 9.07% 32.56%GenderMale 52.69% 70.49% 71.62% 61.51%Female 47.31% 29.51% 28.38% 38.49%RelationshipSpouse/Partner 11.03% 30.19% 5.32% 28.49%Own Adult Children 43.02% 38.14% 21.29% 43.98%Son-in-law/Daughter-in-law 1.08% 2.19% 1.14% 2.18%Grandchild 7.56% 11.33% 5.70% 6.34%Friends/Neighbors 9.18% 0.73% 11.41% 5.70%Paid Home Attendant 1.00% 0.00% 5.70% 1.38%O<strong>the</strong>r Relatives 9.48% 17.38% 4.94% 5.91%O<strong>the</strong>r Non-Relatives 17.66% 0.04% 44.49% 6.02%REFERRAL INFORMATIONSource of Referral – Formal SourcesAdult Protective Services 0.69% 0.00% 0.29% 2.13%Community Agency 11.26% 0.00% 0.68% 8.59%District Attorney 0.90% 0.00% 14.51% 3.37%Domestic Violence Program 0.32% 0.00% 0.00% 1.46%<strong>Elder</strong> <strong>Abuse</strong> Program 2.17% 0.00% 0.00% 2.92%Financial Institution 2.86% 0.00% 0.10% 0.51%Health Care Provider 21.63% 0.00% 0.00% 5.05%Homecare 12.64% 0.00% 0.00% 1.21%Law Enforcement 5.61% 0.00% 80.62% 13.90%Office for <strong>the</strong> Aging 4.76% 0.00% 0.00% 1.83%116 | U n d e r t h e R a d a r : N e w Y o r k S t a t e E l d e r A b u s e P r e v a l e n c e S t u d y
AGGREGATE DATA BY SERVICE SYSTEM (continued)ELDER ABUSE AGGREGATE Adult ProtectiveSERVICE SYSTEM DATA ServicesREFERRAL INFORMATION (continued)Source of Referral – Informal SourcesLawEnforcementDistrictAttorneyAnonymous 3.75% 0.00% 0.00% 6.66%Concerned Citizen 1.00% 0.00% 0.00% 1.07%Family Member 14.75% 0.00% 2.14% 16.99%Friends/Neighbors 6.61% 0.00% 0.39% 3.20%Perpetrator 0.00% 0.00% 0.00% 0.08%Victim 2.64% 0.00% 1.75% 30.02%O<strong>the</strong>r-Total 15.39% 0.00% 0.49% 7.83%Referral ToAdult Protective Services 0.95% 26.23% 0.00% 21.23%Community Agency 20.50% 0.00% 0.00% 36.39%District Attorney 1.58% 0.00% 0.00% 20.66%Domestic Violence Program 1.89% 41.64% 0.00% 7.87%<strong>Elder</strong> <strong>Abuse</strong> Program 2.84% 0.00% 0.00% 21.48%Family Court 0.00% 0.00% 0.00% 21.68%Health Care Provider 42.43% 10.49% 0.00% 19.02%Law Enforcement 1.42% 4.92% 50.00% 24.22%Office for <strong>the</strong> Aging 6.31% 0.00% 0.00% 2.87%O<strong>the</strong>r 22.08% 16.72% 50.00% 21.60%Community-BasedOrganizationsNumber of VictimsNot Referred to O<strong>the</strong>rServices/Agencies(Cases in which AgenciesReported No Referrals)3.44% 36.88% 93.01% 33.11%Domestic Incident ReportsPercentage of cases withcompleted DIRs0.00% 100.00% 58.09% 13.91%S e l f R e p o r t e d P r e v a l e n c e a n d D o c u m e n t e d C a s e S u r v e y s F i n a l R e p o r t 2 0 1 1 | 117
APPENDIX FDOCUMENTED CASE STUDYSERVICE SYSTEM DATADISCUSSION<strong>Elder</strong> abuse victims may receive help from a variety of service systems. The data provided by <strong>the</strong> service systemsthat were identified for this study are described in greater detail in this section. (Data discussed in this sectionis contained in <strong>the</strong> table reproduced in Appendix E.) The service systems surveyed include: Adult ProtectiveServices (APS), law enforcement, district attorneys’ offices (DA), community-based agencies, some of which arefunded by <strong>the</strong> Office of Victim Services for ei<strong>the</strong>r elder abuse or domestic violence services. The table belowoutlines <strong>the</strong> number of surveys that were distributed by service system and <strong>the</strong> number of surveys that werereturned with information on ei<strong>the</strong>r <strong>the</strong> victim or <strong>the</strong> abuser. In some cases surveys were completed butorganizations ei<strong>the</strong>r had zero cases during calendar year 2008 or were unable to give any information o<strong>the</strong>r thanjust <strong>the</strong> total number of victims. The following table describes those surveys that were completed in whichorganizations were able to submit at minimum <strong>the</strong> number of victims served.Law enforcement and APS had <strong>the</strong> highest rates of completed surveys with some information included(95.2% and 91.9%, respectively). A smaller percentage of completed questionnaires were returned from bothcommunity-based agencies and district attorneys’ offices (58.9% and 50%, respectively).Table ADOCUMENTED CASE STUDYRESPONSE RATE BY SERVICE SYSTEMORGANIZATIONSTOTAL NUMBER OFSURVEYSNUMBER COMPLETED(Able to provideinformation)% COMPLETEDCommunity-BasedAgenciesAdult ProtectiveServices163 96 58.9%63 57 90.5%Law Enforcement 62 59 95.2%District Attorneys 36 18 50.0%The following analysis examines <strong>the</strong> profile of victims and abusers by service system, starting withCommunity Based Agencies.118 | U n d e r t h e R a d a r : N e w Y o r k S t a t e E l d e r A b u s e P r e v a l e n c e S t u d y
COMMUNITY-BASED AGENCIESData obtained from community-based agencies consisted of programs that were funded by <strong>the</strong> NYS Office ofVictim Services (49 of which were unable to give us any information with <strong>the</strong> exception of total number ofvictims as generated from statewide reporting data), elder abuse programs and members of elder abusecoalitions that were not captured within o<strong>the</strong>r service systems. Of <strong>the</strong> 163 agencies, 53 reported having no casesin 2008 (32.5%); 14 agencies reported serving elder abuse victims but were unable to report on <strong>the</strong> number ofvictims (8.6%). In <strong>the</strong> final analysis, 96 agencies (58.9%) were able to report at a minimum <strong>the</strong> number ofvictims served.Victim information by type of reportedabuse experiencedNearly one-quarter of <strong>the</strong> agencies were unable to report any information on <strong>the</strong> type of mistreatment (n = 25or 26%). Among <strong>the</strong> agencies that did report this information, 51.1% of reported victims were emotional abusevictims, 33.4% were financial abuse victims, 12.2% were neglect victims, 29.6% were physical abuse victims and2.7% were sexual abuse victims.Age breakdown of reported victimsNearly one-quarter of agencies were unable to report any information on age for victims (n = 21 or 21.9%).Of those victims with age range reported by respondent agencies/programs; 21.5% were in <strong>the</strong> 60-64 agecategory; 32.3% were in <strong>the</strong> 65-74 age category; 30.4% were in <strong>the</strong> 75-84 age category and 15.9% fell into <strong>the</strong>85+ age category.Gender breakdown of reported victimsApproximately one in five agencies was unable to report any information on gender for victims (n = 18 or 19%).The breakdown for those victims whose gender was reported by respondent agencies/programs was 24.1% maleand 75.9% female.Race/ethnicity breakdown for reported victimsAgencies tended to collect less racial and ethnic data on <strong>the</strong>ir victims than o<strong>the</strong>r demographics; a total of 30 or31.3% of agencies were unable to report this information. As reported by those agencies that did have racial andethnic information on <strong>the</strong> victim, 54.9% were Caucasians; 18.5% were African Americans, 3.5% wereAsian/Pacific Islanders; 18.5% were Hispanic/Latino; 0.29% were Native American/Aleut Eskimos and 4.3%were “o<strong>the</strong>r” races.S e l f R e p o r t e d P r e v a l e n c e a n d D o c u m e n t e d C a s e S u r v e y s F i n a l R e p o r t 2 0 1 1 | 119
Living arrangements of victimOver one third of <strong>the</strong> agencies were unable to report information on living arrangements of <strong>the</strong> victims (n = 34or 35.4%). Of victims for whom respondent agencies/programs reported on living arrangements, 51.9% livedalone; 23.5% lived with spouses or partners; 14.7% lived with adult children; 0.5% lived with sons-in-law ordaughters-in-law; 5.4% lived with grandchildren; 2.4% lived with o<strong>the</strong>r relatives and 2.9% lived with o<strong>the</strong>rnon-relatives.Lives with abuserClose to two out of five of all agencies were unable to report information on whe<strong>the</strong>r <strong>the</strong> victim and abuser livedtoge<strong>the</strong>r (n = 38 or 39.6%). Of those agencies that could give this information, 22.6% of <strong>the</strong> victims lived with<strong>the</strong>ir abusers.Living in povertyOver one-half of <strong>the</strong> agencies were unable to give information on whe<strong>the</strong>r elder abuse victims were living at orbelow <strong>the</strong> poverty threshold (n = 58 or 60.4%). However, of those that responded, 59.4% victims were identifiedas living at or below <strong>the</strong> poverty threshold.ABUSER INFORMATIONA total of 64 agencies/programs reported information on abusers of elder abuse victims (66% of all agenciesreporting cases during this period), representing 3,170 abusers in <strong>New</strong> <strong>York</strong> <strong>State</strong> during calendar year 2008.Age Groups of <strong>Abuse</strong>rsOne-quarter of <strong>the</strong> agencies were unable to report age information for abusers (n = 16 or 25%). Of thoseagencies that could give this information, 2.5% of abusers were reported to be in <strong>the</strong> younger than age 18category; 36.1% were in <strong>the</strong> 18-45 age category; 28.9% were in <strong>the</strong> age 46-59 age category and 32.6% were in<strong>the</strong> 60 years and older category.<strong>Abuse</strong>r GenderA small number of agencies were unable to report gender for abusers (n = 2 or 3.1%). Respondent agencies/programs that identified gender of abuser reported 61.5% male abusers and 38.5% female abusers.<strong>Abuse</strong>r Relationship with VictimA small number of agencies were unable to report <strong>the</strong> abuser’s relationship with victim (n = 4 or 6.3%).Respondent agencies/programs reported on <strong>the</strong> relationship between victim and abuser as: spouses or partners,28.5%; own adult children, 44%; sons or daughters-in-law, 2.2%; grandchildren, 6.3%; friends or neighbors,5.7%; paid home care workers, 1.4%; o<strong>the</strong>r relatives, 5.9% and o<strong>the</strong>r non-relatives, 6%.120 | U n d e r t h e R a d a r : N e w Y o r k S t a t e E l d e r A b u s e P r e v a l e n c e S t u d y
Information on sources of elder abuse referralsreceived by respondent agenciesOver one quarter of all respondent agencies were missing all information in this category (n=26 or 27.1%). Forthose agencies that were able to report some information on sources of referrals, in 24.3% of <strong>the</strong> cases <strong>the</strong> sourceof referral was missing. Data is presented below for both formal and informal system referrals.FORMAL SERVICE SYSTEM REFERRALS RECEIVED BY RESPONDENTAGENCIES/PROGRAMSRespondent agencies/programs reported receiving elder abuse referrals from <strong>the</strong> following agencies: AdultProtective Services (2.1%), district attorneys (3.4%), domestic violence programs (1.2%), elder abuse programs(2.9%), law enforcement (13.9%), o<strong>the</strong>r community-based agencies (8.6%), financial services (0.51%), healthcareprograms (5.1%), homecare programs (1.2%) and Area Agencies on Aging (1.8%).INFORMAL SYSTEM REFERRALSRespondent agencies/programs also received referrals from elder abuse victims <strong>the</strong>mselves (30%), perpetrators(0.08%), family members (17%), friends and neighbors (3.2%), concerned citizens (1.1%), anonymous sources(6.7%) and “o<strong>the</strong>r information sources” (7.8%).Information on referrals to respondent agenciesOver 40% of all respondent agencies were missing all information in this category (n=41 or 42.7%).Additionally, 33.1% of <strong>the</strong> victims were not referred to any outside organization. For those agencies that wereable to report some information on where referrals were made, in 22.4% of <strong>the</strong> cases, referral informationwas still missing. Agencies reported referring a total of 21.2% of cases to Adult Protective Services. Respondentagencies/programs also reported referring 36.4% of cases to o<strong>the</strong>r community-based agencies; 20.7% of casesto district attorney’s offices; 7.9% of cases to domestic violence programs; 21.5% of cases to elder abuse programs;21.7% of cases to Family Court; 19% of cases to healthcare services; 24.2% of cases to law enforcement;2.9% of cases to Area Agencies on Aging and 21.6% of cases to “o<strong>the</strong>r.”Domestic Incident Reports (DIR)Over three-fifths (63.5%) of agency responders could not report information on DIRs submitted on behalf ofreported victims. Of those respondent agencies/programs that did report information on DIRs, 13.9% of elderabuse victims had DIRs filed on <strong>the</strong>ir behalf.S e l f R e p o r t e d P r e v a l e n c e a n d D o c u m e n t e d C a s e S u r v e y s F i n a l R e p o r t 2 0 1 1 | 121
Overall data availabilityIn general, <strong>the</strong> availability of data requested from <strong>the</strong> community-based agencies was limited with a significantnumber of agencies unable to provide any demographic information, and when <strong>the</strong>y did, <strong>the</strong>re was often asubstantial amount of missing data. In looking at data availability alone for those community-based agenciesthat could provide at least some demographic information, based on <strong>the</strong> percentage of agencies able to reportand on <strong>the</strong> availability of data for individual survey fields, it was found:Data elements with <strong>the</strong> greatest availability■ Gender of abuser■ Relationship of abuser and victim■ Gender of victimData elements less frequently available■ Type of mistreatment■ Age of victim■ Race and ethnicity of victim■ Living arrangement of victim■ Age of abuser■ Source of referral■ ReferralsData elements with <strong>the</strong> least availability or no availability■ Whe<strong>the</strong>r <strong>the</strong> victim and abuser live toge<strong>the</strong>r■ Poverty■ DIR reportsADULT PROTECTIVE SERVICES (APS)Data was obtained from APS through two sources. The Office of Children and Family Services (OCFS) maintainsa robust statewide data system and was able to complete <strong>the</strong> survey for all counties, with <strong>the</strong> exception of <strong>New</strong><strong>York</strong> City. <strong>New</strong> <strong>York</strong> City APS uses its own data system and completed <strong>the</strong> survey for <strong>the</strong> five counties within<strong>New</strong> <strong>York</strong> City separately. Data was obtained for all 62 counties of <strong>New</strong> <strong>York</strong> <strong>State</strong>, with Franklin Countycompleting an additional survey for <strong>the</strong> division that serves <strong>the</strong> tribal community. Of <strong>the</strong> 62 counties (plus <strong>the</strong>tribal community), six reported having no elder abuse cases in 2008 (9.5%). This left 57 counties that were ableto report at a minimum <strong>the</strong> number of victims served. APS reported a total of 2,180 elder abuse victims in 2008.Victim Information by type of reportedabuse experiencedA small number of counties were unable to report type of mistreatment (n = 3 or 5.3%). Of <strong>the</strong> counties thatdid report this information, 8.8% were emotional abuse victims; 65.8% were financial abuse victims; 37.9%were neglect victims; 33.7% were physical abuse victims and 0.15% were sexual abuse victims.122 | U n d e r t h e R a d a r : N e w Y o r k S t a t e E l d e r A b u s e P r e v a l e n c e S t u d y
Age breakdown of reported victimsA small number of counties were unable to report age for victims (n = 3 or 5.3%). Of those victims with agerange reported by counties, 9.7% were in <strong>the</strong> 60-64 age category; 36.4% were in <strong>the</strong> 65-74 age category; 36.7%were in <strong>the</strong> 75-84 age category and 27.3% fell into <strong>the</strong> 85+ age category.Gender breakdown of reported victimsA small number of counties were unable to report gender for victims (n = 3 or 5.3%). The breakdown for thosevictims whose gender was reported by counties was 30.3% male and 69.7% female.Race/ethnicity breakdown for reported victimsA small number of counties were unable to report race/ethnicity for victims (n = 3 or 5.3%). As reported bythose counties that did have racial and ethnic information on <strong>the</strong> victim, 32% were Caucasians; 20.5% wereAfrican Americans; 0% were Asian/Pacific Islanders; 12.8% were Hispanic/Latino; 1.4% were NativeAmerican/Aleut Eskimos and 33.4% were classified as “o<strong>the</strong>r” races.Living arrangements of victimA small number of counties were unable to report living arrangements of victims (n = 3 or 5.3%). Of victimsfor whom counties reported on living arrangements, 42.1% lived alone; 12.7% lived with spouses or partners;19% lived with adult children; 11% lived with sons-in-law or daughters-in-law; 6.9% lived with grandchildren;6.2% lived with o<strong>the</strong>r relatives and 12.4% lived with o<strong>the</strong>r non-relatives.Lives with abuserNone of <strong>the</strong> counties was able to report whe<strong>the</strong>r <strong>the</strong> victim lives with <strong>the</strong> abuser.Living in povertyNone of <strong>the</strong> counties was able to report whe<strong>the</strong>r elder abuse victims were living at or below <strong>the</strong> poverty threshold.ABUSER INFORMATIONA total of 54 counties were able to report information on <strong>the</strong> abusers of elder abuse victims (94.7% of allcounties reporting cases during this period), representing 1,338 abusers in <strong>New</strong> <strong>York</strong> <strong>State</strong> during calendar year 2008.Age Groups of <strong>Abuse</strong>rsVirtually all of <strong>the</strong> counties were unable to report any age information for abusers (n = 49 or 90.7%). Countiesthat could give this information reported that .79% of abusers were in <strong>the</strong> younger than age 18 years category;S e l f R e p o r t e d P r e v a l e n c e a n d D o c u m e n t e d C a s e S u r v e y s F i n a l R e p o r t 2 0 1 1 | 123
40.6% were in <strong>the</strong> 18-45 age category; 34.6% were in <strong>the</strong> age 46-59 age category and 24.1% were in <strong>the</strong> 60 yearsand older category.<strong>Abuse</strong>r GenderAll counties (100%) were able to report information on <strong>the</strong> gender of <strong>the</strong> abuser. Counties identified <strong>the</strong> genderof abuser as 52.7% male abusers and 47.3% female abusers.<strong>Abuse</strong>r Relationship with VictimAll counties (100%) were able to report information on <strong>the</strong> relationship of <strong>the</strong> abuser to <strong>the</strong> victim. Countiesreported <strong>the</strong> relationship between victim and abuser as: spouses or partners, 11%; own adult children,43%; sons or daughters-in-law, 1.1%; grandchildren, 7.6%; friends or neighbors, 9.2%; paid home care workers,1%; o<strong>the</strong>r relatives, 9.5% and o<strong>the</strong>r non-relatives, 17.7%.Information on sources of elder abuse referralsreceived by respondent agenciesA small number of counties were unable to report information on <strong>the</strong> sources of referrals (n = 3 or 5.3%). Forthose counties that were able to report some information on sources of referrals, in 13.3% of <strong>the</strong> cases sourceof referral was missing. Data is presented below for both formal and informal system referrals.FORMAL SERVICE SYSTEM REFERRALS RECEIVED BY RESPONDENTAGENCIES/PROGRAMSCounties reported receiving elder abuse referrals from <strong>the</strong> following agencies: o<strong>the</strong>r Adult Protective Servicesunits (.69%), district attorneys (.90%), domestic violence programs (.32%), elder abuse programs (2.2%), lawenforcement (5.6%), community-based agencies (11.3%), financial services (2.9%), healthcare programs(21.6%), homecare programs (12.6%) and Area Agencies on Aging (4.8%).INFORMAL SYSTEM REFERRALSCounties also received referrals from elder abuse victims <strong>the</strong>mselves (2.6%), family members (14.8%), friends andneighbors (6.6%), concerned citizens (1%), anonymous sources (3.8%) and “o<strong>the</strong>r information sources” (15.4%).Information on referrals to respondent agenciesA greater number of counties were missing all information in this category (n=10 or 17.5%). A small percentageof victims were not referred to an outside organization for assistance (3.4%). For those counties that were ableto report some information on where referrals were made, in 69.9% of cases, <strong>the</strong> referral information wasmissing. Counties reported referring .95% of cases to o<strong>the</strong>r Adult Protective Services units, 20.5% of cases to124 | U n d e r t h e R a d a r : N e w Y o r k S t a t e E l d e r A b u s e P r e v a l e n c e S t u d y
community-based agencies, 1.6% of cases to district attorneys’ offices, 1.9% of cases to domestic violenceprograms, 2.8% of cases to elder abuse programs, 42.4% of cases to healthcare services, 1.4% of cases to lawenforcement, 6.3% of cases to Area Agencies on Aging and 22.1% of cases to “o<strong>the</strong>r.”Domestic Incident Reports (DIR)None of <strong>the</strong> counties was able to report whe<strong>the</strong>r DIRs had been submitted on behalf of reported victims.Based on <strong>the</strong> percentage of agencies able to report and on <strong>the</strong> availability of data for individual survey fields, itwas found:Overall data availabilityIn general, <strong>the</strong> data availability from APS was quite good. In looking at just <strong>the</strong> data availability for those APSunits that could provide at least some demographic information, based on <strong>the</strong> percentage of agencies able toreport and on <strong>the</strong> availability of data for individual survey fields, it was found:Data elements with <strong>the</strong> greatest availability■ Relationship of abuser and victim■ Type of mistreatment■ Living arrangement of victim■ Source of referralData elements less frequently available■ Age of victim■ Gender of victim■ Race and ethnicity of victim■ Gender of abuser■ ReferralsData elements with <strong>the</strong> least availability or no availability■ Whe<strong>the</strong>r <strong>the</strong> victim and abuser live toge<strong>the</strong>r■ Poverty■ Referrals■ DIR reports■ Age of abuserLAW ENFORCEMENTData was obtained from law enforcement through two sources. The Department of Criminal Justice Services(DCJS) made available <strong>the</strong>ir Domestic Incident Reports (DIR) by county for <strong>New</strong> <strong>York</strong> <strong>State</strong> (with <strong>the</strong> exceptionof <strong>New</strong> <strong>York</strong> City). DIR forms are completed by law enforcement agencies on crimes or offenses that occurS e l f R e p o r t e d P r e v a l e n c e a n d D o c u m e n t e d C a s e S u r v e y s F i n a l R e p o r t 2 0 1 1 | 125
etween family members or intimate partners. It will not include elder abuse that occurs when <strong>the</strong> abuser is anon-family member, such as a home attendant. Data was also obtained from <strong>the</strong> <strong>New</strong> <strong>York</strong> City PoliceDepartment (NYPD) on all cases regardless of whe<strong>the</strong>r <strong>the</strong> abuser was a family or non-family member. DIRand NYPD data was generated by penal code, which was <strong>the</strong>n categorized by <strong>the</strong> researchers in terms of type ofmistreatment. Data was obtained on all 62 counties of <strong>New</strong> <strong>York</strong> <strong>State</strong>. Of <strong>the</strong> 62 counties, three reportedhaving no cases in 2008 (4.8%). This left 59 counties that were able to report at a minimum <strong>the</strong> number ofvictims served.Victim information by type of reportedabuse experiencedAll counties (100%) were able to report information on <strong>the</strong> type of mistreatment. Counties reported mistreatmentin terms of penal codes, which were <strong>the</strong>n categorized as emotional abuse, financial abuse, neglect, physical abuseand sexual abuse. Overall, 55.4% were emotional abuse victims; 14.7% were financial abuse victims; .12% wereneglect victims; 54.1% were physical abuse victims and .12% were sexual abuse victims.Age breakdown of reported victimsAll counties (100%) were able to report information on <strong>the</strong> age of <strong>the</strong> victim in at least some cases. Of thosevictims with age range reported by counties, 13.7% were in <strong>the</strong> 60-64 age category; 56.9% were in <strong>the</strong> 65-74 agecategory; 24.7% were in <strong>the</strong> 75-84 age category and 4.7% fell into <strong>the</strong> 85+ age category.Gender breakdown of reported victimsAll counties (100%) were able to report information on <strong>the</strong> gender of <strong>the</strong> victim in at least some cases. Thebreakdown for those victims whose gender was reported by counties was 34.2% male and 65.8% female.Race/ethnicity breakdown for reported victimsAll counties (100%) were able to report information on <strong>the</strong> race and ethnicity of <strong>the</strong> victim in at least somecases. Respondent counties reported that 61.5% of victims were Caucasians; 23.3%, African Americans; 2.5%,Asian/Pacific Islanders; 11%, Hispanic/Latino; .45%, Native American/Aleut Eskimos and 1.2% were classifiedas “o<strong>the</strong>r” races.Living arrangements of victimNone of <strong>the</strong> counties was able to report on <strong>the</strong> living arrangement of <strong>the</strong> victim.Lives with abuserAll counties (100%) were able to report information on whe<strong>the</strong>r <strong>the</strong> victim lives with <strong>the</strong> victim in at least somecases. In cases in which this information was available, 50.8% of <strong>the</strong> victims lived with <strong>the</strong>ir abusers.126 | U n d e r t h e R a d a r : N e w Y o r k S t a t e E l d e r A b u s e P r e v a l e n c e S t u d y
Living in povertyNone of <strong>the</strong> counties was able to report whe<strong>the</strong>r elder abuse victims were living at or below <strong>the</strong> poverty threshold.ABUSER INFORMATIONA total of 59 counties were able to report information on <strong>the</strong> abusers of elder abuse victims (100% of all countiesreporting cases during this period), representing 4,889 abusers in <strong>New</strong> <strong>York</strong> <strong>State</strong> during calendar year 2008.Age Groups of <strong>Abuse</strong>rsAll counties (100%) were able to report age information for abusers in at least some cases. Overall 11.5% reportedabusers were in <strong>the</strong> younger than age 18 years category; 43.8% were in <strong>the</strong> 18-45 age category; 24.1% were in<strong>the</strong> age 46-59 age category and 20.6% were in <strong>the</strong> 60 years and older category.<strong>Abuse</strong>r GenderAll counties (100%) were able to report information on <strong>the</strong> gender of <strong>the</strong> abuser in at least some cases. Countiesidentified gender of abuser as 70.5% male abusers and 29.5% female abusers.<strong>Abuse</strong>r Relationship with VictimAll counties (100%) were able to report information on <strong>the</strong> relationship of <strong>the</strong> abuser to <strong>the</strong> victim in at leastsome cases. Counties reported <strong>the</strong> relationship between victim and abuser as spouses or partners, 30.2%; ownadult children, 38.1%; sons or daughters-in-law, 2.2%; grandchildren, 11.3%; friends or neighbors, .73%; o<strong>the</strong>rrelatives, 17.4% and o<strong>the</strong>r non-relatives, .04%.Information on sources of elder abuse referralsreceived by respondent agenciesNone of <strong>the</strong> counties was able to report on sources of <strong>the</strong> referral.Information on referrals to respondent agenciesA small number of counties were missing all information in this category (n=5 or 8.5%). Over one-third of <strong>the</strong>victims were not referred to an outside organization for assistance (36.9%). For those counties that were able toreport some information on where referrals were made, in 90.2% of <strong>the</strong> cases, referral information was stillmissing. Counties reported referring 26.2% of cases to Adult Protective Services, 41.6% of cases to domesticviolence programs, 10.5% of cases to healthcare services, 4.9% of cases to o<strong>the</strong>r divisions of law enforcementand 16.7% of cases to “o<strong>the</strong>r.”S e l f R e p o r t e d P r e v a l e n c e a n d D o c u m e n t e d C a s e S u r v e y s F i n a l R e p o r t 2 0 1 1 | 127
Domestic Incident Reports (DIR)A small number of counties were missing all information in this category (n=5 or 8.5%). Of those counties thatdid report information on DIRs, 100% of elder abuse victims had DIRs filed on <strong>the</strong>ir behalf.Overall data availabilityIn general, <strong>the</strong> data quality from law enforcement was quite good. In looking at just <strong>the</strong> data availability forthose law enforcement units that could provide at least some demographic information, based on <strong>the</strong> percentageof units able to report and on <strong>the</strong> availability of data for individual survey fields, it was found:Data elements with <strong>the</strong> greatest availability■ Type of mistreatment■ Age of victim■ Gender of victim■ Race and ethnicity of victim■ Whe<strong>the</strong>r <strong>the</strong> victim and abuser live toge<strong>the</strong>r■ Gender of abuser■ Relationship of abuser■ DIR reportsData elements less frequently available■ Age of abuserData elements with <strong>the</strong> least availability or no availability■ Living arrangement of victim■ Poverty■ Source of referral■ ReferralsDISTRICT ATTORNEYS’ OFFICESDistrict Attorneys’ (DA) offices across <strong>the</strong> state were also asked to participate in <strong>the</strong> study. Data was obtainedfrom DAs that received specific funding from <strong>the</strong> <strong>New</strong> <strong>York</strong> <strong>State</strong> Office of Victim Services as well as from DAsthat did not receive such funding. Of <strong>the</strong> 36 agencies that responded to <strong>the</strong> survey, 16 reported having no casesin 2008 (44.4%) and two agencies reported serving elder abuse victims but were unable to report on <strong>the</strong> numberof victims (5.6%). This left 18 agencies that were able to report at a minimum <strong>the</strong> number of victims served.Victim information by type of reportedabuse experiencedClose to two-fifths of <strong>the</strong> agencies were unable to report any information on <strong>the</strong> type of mistreatment (n = 7or 38.9%). Of <strong>the</strong> agencies that did report this information, 68.9% were emotional abuse victims; 38.1% were128 | U n d e r t h e R a d a r : N e w Y o r k S t a t e E l d e r A b u s e P r e v a l e n c e S t u d y
financial abuse victims; 0.55% were neglect victims; 18.8% were physical abuse victims and 0.86% were sexualabuse victims.Age breakdown of reported victimsOver half of <strong>the</strong> agencies were unable to report any information on age for victims (n = 10 or 55.6%). Of thosevictims with age range reported by respondent agencies/programs, 30.6% were in <strong>the</strong> 60-64 age category; 35.1%were in <strong>the</strong> 65-74 age category; 22.7% were in <strong>the</strong> 75-84 age category and 11.6% fell into <strong>the</strong> 85+ age category.Gender breakdown of reported victimsApproximately half of <strong>the</strong> agencies were unable to report any information on gender for victims (n = 9 or 50%).The gender breakdown for those victims whose gender was reported by respondent agencies/programs was59.6% male and 40.5% female.Race/ethnicity breakdown for reported victimsAgencies tended to collect less racial and ethnic data on <strong>the</strong>ir victims than o<strong>the</strong>r demographics; a total of 11 or61.1% of agencies were unable to report this information. As reported by those agencies that did have racial andethnic information on <strong>the</strong> victim, 59.6% were Caucasians; 24.7%, African Americans; 5.9%, Asian/PacificIslanders; 9.6%, Hispanic/Latino; 0%, Native American/Aleut Eskimos and 0.27% were classified as “o<strong>the</strong>r” races.Living arrangements of victimApproximately four out of five agencies were unable to report information on living arrangements of <strong>the</strong> victims(n = 15 or 83.3%). Of victims for whom respondent agencies/programs reported on living arrangements, 40.9%lived alone; 31.8% lived with spouses or partners; 4.6% lived with adult children; 9.1% lived with grandchildrenand 13.6% lived with o<strong>the</strong>r non-relatives.Lives with abuserOver three-fourths of <strong>the</strong> agencies were unable to report information on whe<strong>the</strong>r <strong>the</strong> victim and abuser livedtoge<strong>the</strong>r (n = 14 or 77.8%). Of those agencies that could give this information, 29.7% of <strong>the</strong> victims lived with<strong>the</strong>ir abusers.Living in povertyAlmost all of <strong>the</strong> agencies were unable to give information on whe<strong>the</strong>r elder abuse victims were living at or below<strong>the</strong> poverty threshold (n = 17 or 97.6%). Similarly, of those agencies that could give this information, 99.8% of<strong>the</strong> information was missing. As a result, 0% of victims were identified as living at or below <strong>the</strong> poverty threshold.S e l f R e p o r t e d P r e v a l e n c e a n d D o c u m e n t e d C a s e S u r v e y s F i n a l R e p o r t 2 0 1 1 | 129
ABUSER INFORMATIONA total of ten agencies/programs reported information on abusers of elder abuse victims (55.6% of all agenciesreporting cases during this period), representing 1,133 abusers in <strong>New</strong> <strong>York</strong> <strong>State</strong> during calendar year 2008.Age Groups of <strong>Abuse</strong>rsOne-fifth of <strong>the</strong> agencies were unable to report age of abusers (n = 2 or 20%). Of those agencies that could givethis information, 4.5% reported abusers were in <strong>the</strong> younger than age 18 years category; 64.5% were in <strong>the</strong>18-45 age category; 21.9% were in <strong>the</strong> age 46-59 age category and 9.1% were in <strong>the</strong> 60 years and older category.<strong>Abuse</strong>r GenderAll agencies were able to report gender for abusers. Respondent agencies/programs that identified gender ofabuser reported 71.6% male abusers and 28.4% female abusers<strong>Abuse</strong>r Relationship with VictimTwo out of every five agencies were unable to report <strong>the</strong> abuser’s relationship with <strong>the</strong> victim (n = 4 or 40%).Respondent agencies/programs reported on <strong>the</strong> relationship between victim and abuser as: spouses or partners,5.3%; own adult children, 21.3%; sons or daughters-in-law, 1.1%; grandchildren, 5.7%; friends or neighbors,11.4%; paid home care workers, 5.7%; o<strong>the</strong>r relatives, 4.9%, and o<strong>the</strong>r non-relatives, 44.5%.Information on sources of elder abuse referralsreceived by respondent agenciesHalf of all respondent agencies were missing all information in this category (n=5 or 50%). For those agenciesthat were able to report some information on sources of referrals, in 34.2% of <strong>the</strong> cases source of referral wasmissing. Data are presented below for both formal and informal system referrals.FORMAL SERVICE SYSTEM REFERRALS RECEIVED BY RESPONDENTAGENCIES/PROGRAMSRespondent agencies/programs reported receiving elder abuse referrals from <strong>the</strong> following agencies: AdultProtective Services (0.29%), o<strong>the</strong>r division within district attorneys’ offices (14.5%), law enforcement (80.6%),community-based agencies (0.68%), financial services (0.10%).INFORMAL SYSTEM REFERRALSRespondent agencies/programs also received referrals from elder abuse victims <strong>the</strong>mselves (1.8%), family members(2.1%), friends and neighbors (0.4%), and “o<strong>the</strong>r information sources” (0.5%).130 | U n d e r t h e R a d a r : N e w Y o r k S t a t e E l d e r A b u s e P r e v a l e n c e S t u d y
Information on referrals to respondent agenciesOver three-fourths of all respondent agencies were missing all information in this category (n=14 or 77.8%).The vast majority of victims were not referred to outside organizations for assistance (93%). For those agenciesthat were able to report some information on where referrals were made, in 98.1% of <strong>the</strong> cases, referralinformation was missing. The only categories of referrals listed were to law enforcement (50%) and to “o<strong>the</strong>r”(50%).Domestic Incident Reports (DIR)Over three-fourths of all agency responders could not report information on DIRs submitted on behalf ofreported victims (n=14 or 77.8%). Of those respondent agencies/programs that did report information onDIRs, 58.1% of elder abuse victims had DIRs filed on <strong>the</strong>ir behalf.Overall data availabilityIn general, <strong>the</strong> availability of data from <strong>the</strong> district attorney offices was fairly limited with ei<strong>the</strong>r a significantnumber of offices unable to provide any demographic information and, when <strong>the</strong>y did, <strong>the</strong>re was still asubstantial amount of missing data. In looking at data availability alone for those offices that could provide atleast some demographic information, based on <strong>the</strong> percentage of offices able to report and on <strong>the</strong> availabilityof data for individual survey fields, it was found:Data elements with <strong>the</strong> greatest availability■ Type of mistreatment■ Gender of abuser■ Age of abuserData elements less frequently available■ Gender of victim■ Age of victim■ Race and ethnicity of victim■ Source of referralData elements with <strong>the</strong> least availability or no availability■ Whe<strong>the</strong>r <strong>the</strong> victim and abuser live toge<strong>the</strong>r■ Poverty■ Living arrangement of victim■ Relationship of abuser and victim■ Referrals■ DIR reportsS e l f R e p o r t e d P r e v a l e n c e a n d D o c u m e n t e d C a s e S u r v e y s F i n a l R e p o r t 2 0 1 1 | 131
VICTIM AND ABUSER PROFILES BY SYSTEMData availability across four service systems surveyed in <strong>the</strong> Documented Case <strong>Study</strong> (APS, community-basedagencies, DAs, law enforcement) is robust enough to permit a comparison in some study data fields, in particular,types of mistreatment, gender of <strong>the</strong> victims, age of <strong>the</strong> victims and gender of <strong>the</strong> abuser. Several profiles ofinterest emerge related to <strong>the</strong> victims and abusers served in each system.Victim Information by type of reportedabuse experiencedAPS serves a higher percentage of neglect cases (37.9%) than community-based agencies (12.2%); bothsystems serve higher percentages than law enforcement and DAs (0.12% and 0.55%, respectively). Similarly, APSsees more financial abuse (65.8% of all cases) and less emotional abuse (8.8%) than all o<strong>the</strong>r service systems.Law enforcement sees more physical abuse (54.1%) than <strong>the</strong> o<strong>the</strong>r service systems (18.8% for DAs; 29.6% forcommunity-based agencies; 33.7% for APS).Age breakdown of reported victimsAPS serves a higher percentage of adults aged 75-84 (36.7%) and older than 85 (27.3%) compared to <strong>the</strong> o<strong>the</strong>rservice systems. The higher percentage of older adults in APS is reflective of a service system designed to serve<strong>the</strong> most vulnerable adults in <strong>the</strong> community. DAs serve a larger percentage of adults aged 60-64 (30.6%); lawenforcement serves a higher rate of adults aged 65-74 (56.9%).Gender breakdown of reported victimsIn three of <strong>the</strong> four service systems two-thirds (65.8%) to three-fourths (75.9%) of <strong>the</strong> victims are women.District Attorneys’ offices serve more men (59.6%).Gender of abuserWhile all four service systems reported that <strong>the</strong> abuser tended to be male, law enforcement and DAs had <strong>the</strong>most similar abuser profiles. Both systems reported that close to three-fourths of <strong>the</strong> abusers coming into <strong>the</strong>irsystem were male (70.5% and 71.6%, respectively). Community-based agencies reported slightly over three-fifthsof abusers were male (61.5%) and APS reported slightly more than half of abusers were male (52.3%).132 | U n d e r t h e R a d a r : N e w Y o r k S t a t e E l d e r A b u s e P r e v a l e n c e S t u d y