Parking And Transportation Study Final Report ... - Gavilan College
Parking And Transportation Study Final Report ... - Gavilan College
Parking And Transportation Study Final Report ... - Gavilan College
- No tags were found...
You also want an ePaper? Increase the reach of your titles
YUMPU automatically turns print PDFs into web optimized ePapers that Google loves.
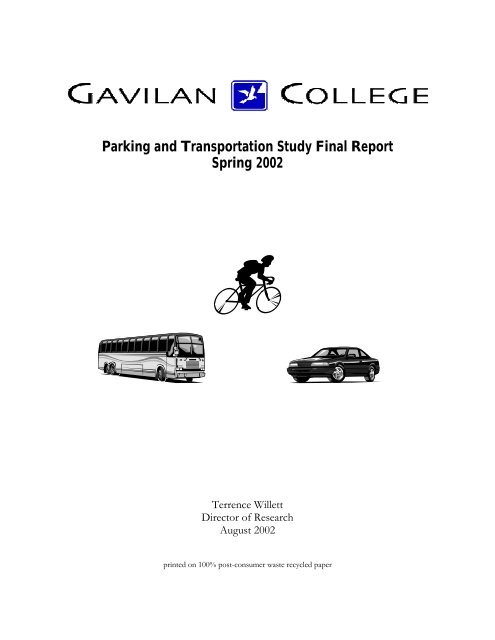
<strong>Parking</strong> and <strong>Transportation</strong> <strong>Study</strong> <strong>Final</strong> <strong>Report</strong>Spring 2002Terrence WillettDirector of ResearchAugust 2002printed on 100% post-consumer waste recycled paper
<strong>Parking</strong> and <strong>Transportation</strong> <strong>Study</strong> <strong>Final</strong> <strong>Report</strong>Spring 2002Terrence WillettDirector of ResearchAugust 2002Summary of Findings• 200 student spaces may meet current beginning of the semester demand• 260 student spaces may meet beginning of the semester demand until 2006• 50 student spaces may meet current mid-semester demand• 65 student spaces may meet mid-semester demand until 2006• Currently there appears to be adequate staff and disabled parking• 85% of trips to the main campus appear to be made by solo drivers• <strong>Parking</strong> demand could be met by more parking spaces, promoting alternative transit, andmanaging enrollment so that no start time comprises over 1000 enrollments at currentparking capacity or about 10% of current total main campus enrollments• Student survey respondents were more likely to be older students with non-transfer goals.• Survey respondents in general do not appear highly satisfied with parking.• Carpooling with a ride matching appears the most attractive alternative with quicker andmore extensive bus service being next most attractive.Recommendations• Provide at least 65 additional parking in an area with minimal environmental impacts(this has been completed with the addition of 147 spaces in the Lot G extension)• Make existing parking more efficient with restriping where appropriate• Institute a carpool partner matching program and a discounted carpool parking permit• Provide a bus pass to each student to enhance bussing convenience• Work with local transit agencies to extend and improve public transit to our sites(discussions and data sharing have begun)• Promote awareness of bicycle routes and safety1
IntroductionIn the past year, <strong>Gavilan</strong>’s on campus enrollment has increased by about 10% and is projected tocontinue increasing by 2.3% per year. This increase has placed additional pressure on parking andtransportation resources at the college. To help maintain access to the campus and improve studentand employee satisfaction, the <strong>Gavilan</strong> <strong>College</strong> community intends to enhance transportationoptions and expand parking resources. This report serves to provide information about parking lotutilization, mode of transportation, and attitudes towards transit options and can be used inconjunction with the parking and traffic flow analysis by Maas Associates.Methods<strong>Gavilan</strong> Research and <strong>Parking</strong> Enforcement personnel collected data on parking lot utilizationusing the attached form. An initial survey and enrollment data (Figure 1) indicated that Wednesdayat 10:45 am appeared to be the most impacted time for parking. This time point became the parkinglot utilization survey point for the remainder of the study period. Student demand was defined asthe number of vehicles parked in the 3 overflow areas (along the Athletic Field, around theOccupational Education building, and the lot near Mesa Road by the North Entrance) minus thenumber of empty student spaces.Ridership by mode of transportation was determined in part by Research and <strong>Parking</strong>Enforcement personnel observing vehicles as they entered the campus during peak hours. TheSanta Clara Valley Transit Authority and Paratransit provided ridership data for public bus service to<strong>Gavilan</strong> <strong>College</strong>. The Census Bureau provided additional ridership information about Santa Claraand San Benito County residents.A survey administered in the 2 nd and 3 rd weeks of the semester assessed worker attitudes aboutalternative transit. The survey was given to a random selection of 40 <strong>Gavilan</strong> workers with 13responses. A mail survey of student transportation attitudes was sent to a random selection of 2002
<strong>Gavilan</strong> students enrolled at the main campus in six or more units. The first mailing of the surveywent out May 15 th , a second went out June 7 th , and a final reminder card went out June 26 th . Twosurvey came back as undeliverable. We received a total of 61 responses for a 31% response rate. Acopy of the student survey is attached at the end of this report.To assess the representativeness of our sample, I compared demographic data of respondents tononrespondents. Demographic variables included age, city of residence, educational goals,education level, employment hours per week, enrollment status, ethnicity, gender, GPA, language,and total units attempted. Only age showed a significant relationship with response status with theaverage age of respondent being 2 years older than nonrespondents (Mann-Whitney U test, Z = -2.464, p = 0.014). This was supported by a classification and regression tree (CART) that used thedemographic variables as predictors of survey response. The CART had an accuracy of 74.5% andsplit first on age then on ethnicity and educational goal as follows:Age 26.125Transfer goalNot Transfer goal33% response rate17% response rate36% response rate72% response rateHowever, a forward stepwise likelihood ratio logistic regression using these variables aspredictors of return resulted in a null model suggesting that none of these variables related toresponse rates.To assess the seriousness of the possible bias, responses were compared between the age groupsdefined by the CART. Older students were more likely to be solo commuters and to cite a complexschedule as a barrier to alternative transit but showed no differences on other responses such asconsidering carpooling as an alternative or attitudes towards parking adequacy.3
While the analysis of representativeness contains some contradictory elements, it is probably safeto assume that some response bias exists. Most likely, responses will underrepresent youngerstudents of Latino and non-White ethnicities and should be considered when interpreting theresults. Data were analyzed with SPSS 10.1.4 and Excel 2000.Results and DiscussionTotal unmet student demand showed a statistically significant linear decline of about 14 spacesdemanded during peak time per week (R 2 = 0.70, p < 0.005). Unmet student demand at thebeginning of the semester was about 200 spaces declining to about 50 spaces by mid-semester andstill further to a surplus of 30 spaces by the end of the semester (Figure 2). Total empty staffparking averaged at about 20 spaces and did not show a significant linear trend over the semester (R 2= 0.11, p = 0.088; Figure 3). There currently appears to be adequate handicapped parking for themoment but this parking should increase in proportion with increases in total parking.Future student parking demand can be expected to change with enrollment. Excluding offcampus members of the police and fire academies, enrollment is projected to grow to around 6,100by Fall 2007 using a linear model (R 2 = 0.82, p = 0.001; Figure 4). If the proportion of unmetstudent demand remains constant and no new parking is provided, we would predict unmet demandto grow to about 260 for the beginning of the semester and about 65 for the mid semester by 2006.The vast majority of vehicles observed between 8 am and 12 pm contained single occupants(Figure 5) with an average ridership of 1.43 people per car when only cars are included or 1.56people per car when all modes of transit are included. Of 1,506 private vehicle observations only 2bicycles were observed. These observations were mirrored by student responses to the mail survey(Figure 6). Mode of transit significantly differed between <strong>Gavilan</strong> students and workers during peakhours and total residents of Santa Clara and San Benito Counties (Figure 7). It may be that residents4
of San Benito County and to some extent, <strong>Gavilan</strong> participants, substitute carpool for public transitdue to the lower availability of busses in the more rural areas of the <strong>Gavilan</strong> District.Of student survey respondents, just over a fifth agreed that there was enough parking at themain campus, just under a quarter agreed that they had no trouble finding parking, and an eighthagreed with both statements (Figure 8, Table 1). This suggests a level of satisfaction with muchopportunity for improvement.Students and workers indicated carpooling as the mode of alternative transit they would mostlikely consider followed by bussing and distance ed/telecommuting (Figure 9). Solo commutersmore likely to say they would not consider any alternatives compared with solo commuters who alsoused alternatives (Chi-square(1) = 7.136, p = 0.008). Inhibitors to alternative transit for studentswere lead by a complicated personal schedule followed by the bus taking too long and being too far(Figure 10). Students who solo commuted were more likely to cite a complicated schedule as abarrier to using alternative transit (G 2 (3) = 14.726, p = 0.002). Inhibitors for workers were primarilya complicated schedule and the bus route being too far from home. Promoters of alternative transitincluded ride match programs and faster, less expensive, and more extensive bus service (Figure 11).Responses to promoters were remarkable for the lack of any responses related to bicycling. Writtencomments were varied and included ideas about expanding parking and bus service and reducingpermit and bus pass fees (Table 2).RecommendationsIt appears that current beginning of the semester demand exists for about 200 more studentparking spaces. To accommodate projected future growth, at least 60 more spaces would be neededby 2007 to meet beginning of the semester demand. The 147 spaces created over the Summershould exceed mid-semester demand for the next 5 years.5
Student parking demand could also be met by a series of strategies such managing enrollment bytime of day, increased use of alternative transit, and creating more parking spaces. For example,current parking demands would probably be met if no start time was allowed to have greater than1000 enrollments at current parking capacity, which is about 10% of total Spring 2002 main campusenrollments. Increased alternative transit use could be accomplished through a ride match programfor carpoolers. Also, providing semester bus passes for every student would increase theconvenience of transit as they would already have a pass in their possession. Pass fees could be paidfor through the registration process and/or grants that promote alternative transit. As the <strong>Gavilan</strong>district covers two transit authority territories, a special arrangement for <strong>Gavilan</strong> bus passes to begood in both Santa Clara and San Benito counties would further enhance the convenience of thetransit pass. Other strategies could include preferred parking for carpoolers, a limited number ofdaily parking passes for full time users of alternative transit, or increased parking fees with a lowincome waiver. It did not appear that bicycling is an option used or considered in any significantfashion. Promoting awareness of bicycle transportation and safety such as through Bike to WorkDay may increase consideration of the bicycle as a transit option for nearby residents. Overall, acombination of afternoon class scheduling, promoting carpooling, bussing, and bicycling, andadding new spaces will probably be needed to meet long term parking demand.6
18%16%14%Enrollment12%10%8%6%4%2%0%6308008208459101010111011351210123513001400150016001730180018301900Start Time of ClassFigure 1. Proportion of main campus enrollments by start time of class.7
200150Student <strong>Parking</strong> Space Demand100500Jan/Feb March April May-50Figure 2. Estimated Median Monthly Unmet Student <strong>Parking</strong> Demand at Peak Hour.8
3025Empty Staff <strong>Parking</strong> Spaces20151050Jan/Feb March April MayFigure 3. Median Monthly Empty Staff <strong>Parking</strong> Spaces at Peak Hour9
700060005000Headcount400030002000Predicted On Campus EnrollmentActual On Campus Enrollment100001992 1994 1996 1998 2000 2002 2004 2006 2008YearFigure 4. Actual and projected enrollments of <strong>Gavilan</strong> students excluding off campusmembers of the police and fire academies (JPA consortium).10
Solo Driver2 person Carpool3 person Carpool4 person Carpool5+ person CarpoolBus/ParatransitMotorcycleBicycle0% 10% 20% 30% 40% 50% 60% 70%Percentage of TripsFigure 5. Private Vehicle Occupancy at <strong>Gavilan</strong> <strong>College</strong> during morning peak hours at the beginning of thesemester.11
Solo Driver2 person Carpool3 person Carpool4 person CarpoolBusMotorcycleBicycleWalkDropped Off0% 10% 20% 30% 40% 50% 60%Percent of ResponsesFigure 6. Primary mode of transit to the <strong>Gavilan</strong> main campus claimed by student survey respondents.ResponsesTransit Mode Count Percent ErrorSolo Driver 45 58% 7%2 person Carpool 16 21% 10%3 person Carpool 2 3% 11%4 person Carpool 1 1% 11%Bus 8 10% 11%Motorcycle 0 0% naBicycle 2 3% 11%Walk 1 1% 11%12
Dropped Off 3 4% 11%Total 78 100%<strong>Gavilan</strong> Survey San Benito County Santa Clara CountyPercent of Vehicle Commutes90%80%70%60%50%40%30%20%10%0%Drive Alone Carpool Public TransitMode of <strong>Transportation</strong>Figure 7. Mode of transit by <strong>Gavilan</strong> <strong>College</strong> students and workers during peak house and in general forresidents of the counties in <strong>Gavilan</strong> <strong>College</strong>’s District.<strong>Gavilan</strong> San Benito Santa ClaraSurvey County CountyDrive Alone 70% 80% 84%Carpool 20% 19% 13%Public Transit 11% 0% 3%Chi-sq 1146.01df 4p
Figure 8. Responses by students about <strong>Gavilan</strong> parking adequacy.14
Table 1. Crosstabluation of student responses about <strong>Gavilan</strong> parking adequacy.I think there isenough parkingat the maincampus of<strong>Gavilan</strong>I usually have trouble finding a parking placeat the main campus of <strong>Gavilan</strong>StronglyDisagree Disagree Neutral AgreeStronglyAgree Total Percent ErrorStrongly Disagree 2 1 2 14 19 34% 11%Disagree 1 3 8 12 21% 12%Neutral 3 6 4 13 23% 12%Agree 2 3 2 2 9 16% 12%Strongly Agree 2 1 3 5% 13%Total 6 7 13 16 14 56Percent 11% 13% 23% 29% 25%Error 13% 13% 12% 11% 12%Spearman's Rho = -0.6715
45%40%35%Percent of Responses30%25%20%15%10%5%0%Carpool Bus Bike Walk DistanceEdNoneFigure 9. Type of alternative transit student respondent would considerResponsesCount Percent ErrorCarpool 27 45% 10%Bus 7 12% 12%Bike 1 2% 13%Walk 1 2% 13%Distance Ed 7 12% 12%None 17 28% 11%Total 60 100%16
I do not use alternatives to driving alone because...My schedule is too complicatedBus takes too longNo bus routes are close to my houseCannot find a carpool partnerBus fare too expensiveI don’t feel safe on a bicycleNot enough bicycle racks0 5 10 15 20 25 30 35 40ResponsesFigure 10. Student responses to alternative transit inhibitors.ResponsesCount Percent ErrorMy schedule is too complicated 36 60% 8%Bus takes too long 19 32% 11%No bus routes are close to my house 14 23% 11%Cannot find a carpool partner 9 15% 12%Bus fare too expensive 4 7% 12%I don’t feel safe on a bicycle 3 5% 13%Not enough bicycle racks 1 2% 13%Total 50 100%17
I would consider using alternatives to driving alone if...If I could find a carpool partner through a ridematch programBus stop was closer to my houseBus was fasterIf I had a free bus passIf I received 10 free day parking permits for theterm if I did not drive alone the rest of the timeIf there were more bicycle racks0 2 4 6 8 10 12 14ResponsesFigure 11. Student responses to promoters of alternative transit use.ResponsesCount Percent ErrorIf I could find a carpool partner through a ridematch program 13 22% 11%Bus stop was closer to my house 12 20% 12%Bus was faster 11 18% 12%If I had a free bus pass 8 13% 12%If I received 10 free day parking permits for theterm if I did not drive alone the rest of the time 4 7% 12%If there were more bicycle racks 0 0% naTotal 48 100%18
Table 2. Written comments by student respondents.1. Beginning of semester has no available parking. When you finally find a space, you are late for class.2. It is unfair and way out of line to give parking tickets to students who park in the staff parkingspaces. Sometimes, that is the only available parking. That really gets on my nerves! >:-|3. It seems that parking is going to need expansion. I also noted that the police cadets share theparking lot so it seems as the students population grows, easier parking access would be aconsideration choosing <strong>Gavilan</strong> versus Morgan Hill and such.4. We already pay for tuition and books. I think parking and busses should be free to us or bussesshould not be so expensive or pay once for a day pass, not twice to come and go.5. You need to make more parking areas for the morning, this is the worst time to find a parking place6. As the school grows it is only common sense to realize the need for more parking7. beginning of semester parking is really bad. As Gilroy grows <strong>Gavilan</strong> is going to have to add moreparking. It is a problem that is going to grow and needs to be fixed. Carpooling can only do somuch.8. El pagode transporte es muy elevado para el salono promeio del area9. have more parking10. I feel <strong>Gavilan</strong> should not five out parking tickets unless there are enough spaces unlike last semesterpeople had to park on a hill in the dirt. People drive around for at least 30 minutes looking for aparking spot and that make's us late for our class.11. I liked the new parking last semester until you closed it. It just needed to be paved.12. Ir todos em autobus13. More bus routes through San Martin14. More parking to the campus so we don't be late for classes15. <strong>Parking</strong> is only troublesome between 10 and noon16. <strong>Parking</strong> is too expensive17. <strong>Parking</strong> should be free18. Permit pass holders should get 1st priority to park. We shouldn't have to compete with contractorswho reserve parking for their crews and cosmetology patrons or with pay as you go (day-hour pass)when lots are jammed we shouldn't be ticketed if we try t19. Re-open the parking lot on the grass20. Semester parking permits are way too expensive especially since they're mostly useless because youcan't ever find a parking spot21. Stop trying to make money off of it. Establish shuttles that run continuously between the maincampus and each of the colleges other sites.22. Take out trees for parking23. The parking spaces are narrow especially when compared to evergreen. Crack down on those thatpark over the line. They take away spaces that would otherwise be available.19
<strong>Gavilan</strong> Community <strong>College</strong> <strong>Parking</strong> and <strong>Transportation</strong> and Computer AccessSurvey Spring 2002<strong>Gavilan</strong> Community <strong>College</strong> seeks your input on improving access to the college. Please fill out andreturn this survey in the envelope provided.1. How do you travel to the <strong>Gavilan</strong> main campus? (mark all that apply)! Drove alone! Carpool with 1 other person! Carpool with 2 other persons! Carpool with 3 other persons! Carpool with 4 or more other persons! Bus! Motorcycle! Bike! Walk/Skate! Did not go to main campus! Other:_________________________________________________________________2. To what degree do you agree with the following statement: “I think there is enough parking atthe main campus of <strong>Gavilan</strong>.”□ strongly agree □ agree □ neutral □ disagree □ strongly disagree3. If you usually drive alone to the <strong>Gavilan</strong> main campus, which of the following alternatives if anywould you consider using either at least some of the time? (mark all that apply)□ Carpool □ Public Bus □ Bicycle □ Walk/Skate □ Distance Ed or Telecommuting □ None4. I do not use alternatives to driving alone because (mark all that apply):□ No bus routes are close to my house□ Bus takes too long□ Bus fare too expensive□ Cannot find a carpool partner□ My schedule is too complicated□ I don’t feel safe on a bicycle□ Not enough bicycle racks□ Not applicable□ Other (write response)More questions on back20
5. I would consider using alternatives if (mark all that apply):□ Bus stop was closer to my house□ Bus was faster□ If I had a free bus pass□ If I received 10 free day parking permits for the term if I did not drive alone the rest of the time□ If I could find a carpool partner through a ride match program□ If there were more bicycle racks□ Not applicable□ Other (write response)6. To what degree do you agree with the following statement: “I usually have trouble finding aparking place at the main campus of <strong>Gavilan</strong>.”□ strongly agree □ agree □ neutral □ disagree □ strongly disagree7. Do you have any other comments or suggestions about parking or transportation?8. Do you have access to a computer? □ Yes □ No □ Don’t Know9. About how often do you use a computer? □ daily □ weekly □ monthly □ yearly □ never10. About how long has it been since you last used a computer? (write in response)____________________11. What do you use a computer for? (mark all that apply)□ email □ web browsing □ writing papers □ graphic art/multimedia □ games □ programming□ other (write in response):12. Would you use the web to register for classes at <strong>Gavilan</strong>? □ Yes □ No □ Don’t Know13. Would you pay registration fees on the web? □ Yes □ No □ Don’t KnowThank you for taking the time to help improve access to <strong>Gavilan</strong> <strong>College</strong>!21


