ArcGIS Zonal Statistics Raster Procedure
ArcGIS Zonal Statistics Raster Procedure
ArcGIS Zonal Statistics Raster Procedure
- No tags were found...

You also want an ePaper? Increase the reach of your titles
YUMPU automatically turns print PDFs into web optimized ePapers that Google loves.
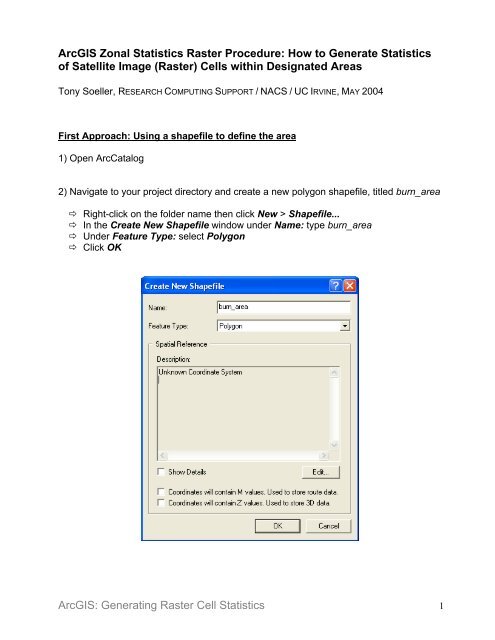
<strong>ArcGIS</strong> <strong>Zonal</strong> <strong>Statistics</strong> <strong>Raster</strong> <strong>Procedure</strong>: How to Generate <strong>Statistics</strong>of Satellite Image (<strong>Raster</strong>) Cells within Designated AreasTony Soeller, RESEARCH COMPUTING SUPPORT / NACS / UC IRVINE, MAY 2004First Approach: Using a shapefile to define the area1) Open ArcCatalog2) Navigate to your project directory and create a new polygon shapefile, titled burn_area Right-click on the folder name then click New > Shapefile... In the Create New Shapefile window under Name: type burn_area Under Feature Type: select Polygon Click OK<strong>ArcGIS</strong>: Generating <strong>Raster</strong> Cell <strong>Statistics</strong> 1
8) Modify the burn_area shapefile symbol in the ARCMAP TOC by selecting the Hollowsymbol with a red boundary Left double-click on the polygon symbol or right-click on the burn_area name Select Properties > Symbology Click to choose the Hollow symbol Click on Outline Color and choose the red box Set Outline Width to 1.00 Click OK9) Start editing the burn_area shapefile Views > Toolbars > Editor (opens the Editor toolbar) Click Editor > Start Editing Set the Target: window to burn_area Set the Task: window to Create New Feature Click the Sketch Tool (it looks like a pencil)10) Digitize new burn area polygons: Using the left mouse button make successive clicks to define the boundariesaround a burned area identified on the satellite image Click F2 to complete each polygon For this exercise, digitize at least two polygons in this manner.11) Modify the polygon if necessary: In the Task: window select Modify Feature Click the Edit Tool (it looks like a black arrowhead on the Editor toolbar) if it is notalready active Click on a polygon to select it Move the mouse pointer upon one of the green vertexes that define the polygonoutline, hold down the left mouse button, then drag the vertex to the desire position<strong>ArcGIS</strong>: Generating <strong>Raster</strong> Cell <strong>Statistics</strong> 3
12) Assign a unique value for the burn_id attribute of each polygon Right-click on burn_area Left-click on Open Attribute Table (the burn_area attribute table opens)<strong>ArcGIS</strong>: Generating <strong>Raster</strong> Cell <strong>Statistics</strong> 4
Click on the cell that is in the first row and under the name burn_id Type 1 in the cell Click on the cell that is in the second row and under the name burn_id Type 2 in the cell Repeat this procedure for each row that represents a polygon while assigning aunique number to the cell Close the burn_area attribute table.13) Save your polygon and attribute edits and stop editing Click Editor > Save Edits Click Editor > Stop Editing14) Activate the Spatial Analyst extension Tools > Extensions > Spatial Analyst (check to activate)15) Open the Spatial Analyst toolbar View > Toolbars > Spatial Analyst<strong>ArcGIS</strong>: Generating <strong>Raster</strong> Cell <strong>Statistics</strong> 5
16) Open the Spatial Analyst Options window and define the Working Directory. This willdefine where new data files will be saved. Spatial Analyst (toolbar) > Options... > General tab > Working Directory<strong>ArcGIS</strong>: Generating <strong>Raster</strong> Cell <strong>Statistics</strong> 6
17) Define the Extent In the Options window click the Extent tab Set the extent to ' Same as Layer "Landsat_A" ‘ or to ' Same as Display ‘ or enterspecific coordinates. If you choose one of the latter two options be sure, in theSnap extent to: window that you select Landsat_A and not just .Otherwise the polygons you define might not conform to the exact edges of desiredcells in the raster, possibly leading to erroneous results.18) Define the Cell Size In the Options window click the Cell Size tab Set the cell size to ' Same as Layer "Landsat_A" '<strong>ArcGIS</strong>: Generating <strong>Raster</strong> Cell <strong>Statistics</strong> 7
19) Compute <strong>Zonal</strong> <strong>Statistics</strong> Click Spatial Analyst > <strong>Zonal</strong> <strong>Statistics</strong>... Under Zone dataset: select burn_area Under Zone field: select burn_id Under Value raster: select Landsat_A Click, to activate, Ignore NoData in calculations Click, to activate, Join output table to zone layer Click, to activate, Chart statistic Select Mean as the statistic Under Output table: navigate to a folder and specify a name for a new dbfformattedfile that will be generated Click OKOnce done the following actions happen:1) a dbf-formatted file is generated that contains summary statistics for the aggregate ofcells defined by each polygon,2) that same file is added to the ARCMAP TOC (to see it listed, click the Source tab atthe bottom of the TOC),3) the statistics values within the dbf file are joined (i.e., temporarily appended) to theburn_area shapefile attribute table, and4) a chart of the mean of the values of all the cells within each polygon is generated anddisplayed.<strong>ArcGIS</strong>: Generating <strong>Raster</strong> Cell <strong>Statistics</strong> 8
Second Approach: Using a raster to define the areaIn this second approach, a raster will be used to define the areas over which statisticsfrom the Landsat_A raster are generated. Essentially this new raster serves to definestudy areas within the Landsat_A raster. Since we don’t have a raster that reflects thestudy area we can generate one, as an example, from the burn_area polygon shapefile.1) Activate the Spatial Analyst toolbar as described in Steps 14 and 15, above.2) Assign the Spatial Analyst Options as described in Steps 16, 17 and 18, above. Payparticular attention to the values used under the Extent tab. If you are not usingLandsat_A specifically to define the Analysis extent (for instance by selecting Same asDisplay in that window) then be certain to select Landsat_A in the Snap extent to:window so that the spatial parameters (i.e., the coordinates of the cells) of the newworking raster are the same as those of the Landsat_A raster.3) Generate a study area raster from the burn_area shapefile Click Spatial Analyst > Convert > Features to <strong>Raster</strong>… Under Input features: select the burn_area shapefile name Under Field: select burn_id Under Output cell size: use the size of the cells within the Landsat_A raster. Thedefault value that appears in this window (here shown as 28.5 meters) is pulledfrom the value that is defined within the Spatial Analyst / Options / Cell Sizewindow. Under Output raster: navigate to a folder and specify a name for a new raster filethat will be generated. For this example, the name burn_raster will be used. Click OK<strong>ArcGIS</strong>: Generating <strong>Raster</strong> Cell <strong>Statistics</strong> 9
ArcMap will proceed to generate a raster with dissociated groups of cells. The value ofthe cells in each group matches the burn_id attribute value of the overlapping polygonwithin the burn_area shapefile. Note that cells outside the areas defined by theburn_area polygons will all have NoData values.That concludes the procedure for generating a working raster.4) Compute <strong>Zonal</strong> <strong>Statistics</strong> Click Spatial Analyst > <strong>Zonal</strong> <strong>Statistics</strong>... Under Zone dataset: select BURN_RASTER Under Zone field: select Value Under Value raster: select Landsat_A Click, to activate, Ignore NoData in calculations Click, to activate, Join output table to zone layer Click, to activate, Chart statistic Select Mean as the statistic Under Output table: navigate to a folder and specify a name for a new dbfformattedfile that will be generated Click OKAs above, a dbf-formatted file will be generated and added to the ArcMap TOC. You willbe presented with a chart showing the mean values of the cells within each raster zoneand a table showing the calculated statistics. As a test, you can compare the statisticsgenerated using the polygon shapefile as the zone dataset with the statistics generatedusing the working raster as the zone dataset. If the two procedures were performedproperly the statistical values produced by each method will be identical.<strong>ArcGIS</strong>: Generating <strong>Raster</strong> Cell <strong>Statistics</strong> 10