The United States Woodpulp Industry - Forest Products Laboratory ...
The United States Woodpulp Industry - Forest Products Laboratory ...
The United States Woodpulp Industry - Forest Products Laboratory ...

Create successful ePaper yourself
Turn your PDF publications into a flip-book with our unique Google optimized e-Paper software.
<strong>United</strong> <strong>States</strong><br />
Department of<br />
Agriculture <strong>The</strong><br />
<strong>Forest</strong> Service<br />
<strong>Woodpulp</strong> <strong>Forest</strong><br />
<strong>Products</strong><br />
<strong>Laboratory</strong><br />
Resource<br />
Bulletin<br />
FPL-RB-18<br />
<strong>United</strong> <strong>States</strong><br />
<strong>Industry</strong>
Abstract<br />
In 1983, 315 woodpulp mills were operating at 254 locations<br />
throughout the <strong>United</strong> <strong>States</strong>. Mill capacity, at nearly<br />
174,000 tons per day (nearly 60 million tons per year), had<br />
almost doubled since 1961. Of this capacity, 66 percent was<br />
in the South, 17 percent in the West, and smaller amounts<br />
in the Northeast and North Central regions. Sulfate pulping<br />
had risen to 71 percent of U.S. capacity, with 76 percent of<br />
the sulfate capacity in the South. Pulpwood requirements<br />
had remained constant at about 1.5 cords of pulpwood per<br />
ton of pulp, but the pulpwood used had changed since 1961<br />
and in 1983 was 38 percent softwood roundwood,<br />
22 percent hardwood roundwood, and 40 percent plant<br />
by-products.<br />
Keywords: <strong>Woodpulp</strong> capacity, woodpulp production,<br />
pulpwood production, pulpwood consumption, pulp mills,<br />
industrial roundwood consumption.<br />
March 1987<br />
McKeever, David B. <strong>The</strong> <strong>United</strong> <strong>States</strong> woodpulp industry. Resour. Bull.<br />
FPL-RB-18. Madison, WI: U.S. Department of Agriculture, <strong>Forest</strong> Service,<br />
<strong>Forest</strong> <strong>Products</strong> <strong>Laboratory</strong>; 1987, 29 p.<br />
A limited number of free copies of this publication are available to the public<br />
from the <strong>Forest</strong> <strong>Products</strong> <strong>Laboratory</strong>, One Gifford Pinchot Drive, Madison, WI<br />
53705-2398. <strong>Laboratory</strong> publications are sent to over 1,000 libraries in the<br />
<strong>United</strong> <strong>States</strong> and elsewhere.<br />
<strong>The</strong> <strong>Laboratory</strong> is maintained in cooperation with the University of Wisconsin.<br />
Highlights<br />
• In 1983, the 315 woodpulp mills operating in the <strong>United</strong><br />
<strong>States</strong> had a combined capacity of 174,000 tons per day,<br />
nearly twice the 1961 capacity.<br />
• In 1983, the largest mill could produce 3,000 tons of<br />
woodpulp per day; as against 2,175 tons in 1961. <strong>The</strong><br />
average mill could produce 552 tons in 1983 as against<br />
256 tons in 1961.<br />
• One and a half cords of pulpwood were required, on the<br />
average, to produce a ton of woodpulp. <strong>The</strong> pulpwood<br />
used was 38 percent softwood roundwood, 22 percent<br />
hardwood roundwood, and 40 percent plant by-products.<br />
<strong>The</strong>se percentages had changed little since the<br />
mid-1970’s.<br />
• <strong>The</strong> South was the region with largest capacity in 1983<br />
(66 percent of U.S. capacity), while sulfate pulp was the<br />
type of mill with largest capacity (70 percent of U.S.<br />
capacity).<br />
• In 1983, 34 percent of all industrial roundwood produced<br />
in the <strong>United</strong> <strong>States</strong> (excluding fuelwood) was used for<br />
pulpwood.<br />
• Foreign trade in woodpulp has never exceeded 10 percent<br />
of domestic production.<br />
• <strong>The</strong> woodpulp industry operated at 91 percent of annual<br />
capacity in 1983, between the record high (96 percent) in<br />
1972 and the record low (82 percent) in 1982.
<strong>The</strong> <strong>United</strong> <strong>States</strong><br />
<strong>Woodpulp</strong> <strong>Industry</strong><br />
David B. McKeever, Research <strong>Forest</strong>er<br />
<strong>Forest</strong> <strong>Products</strong> <strong>Laboratory</strong>, Madison, WI<br />
Introduction<br />
This report provides government and industry researchers<br />
and market analysts a comprehensive review of the<br />
woodpulp industry and brings together in a single source<br />
information not available elsewhere. <strong>The</strong> capacity and<br />
production of the U.S. woodpulp industry in 1983 are<br />
reported by region and woodpulp grade, and trends in<br />
capacity and production are analyzed. <strong>The</strong> estimates of<br />
individual mill capacities for 1961, 1965, 1970, and 1974<br />
(listed in Appendix table A-2) are derived from published<br />
reports (USDA <strong>Forest</strong> Service 1961, 1965; McKeever 1977).<br />
Capacity estimates for 1983 are based on information from a<br />
variety of published sources including industry directories,<br />
corporate annual reports, trade journals, and association<br />
reports. No attempt has been made to identify mills that<br />
were idle for less than a year. Annual woodpulp capacity<br />
and production, foreign trade, apparent domestic woodpulp<br />
consumption, and pulpwood requirements are also<br />
examined.<br />
Over the past six decades, U.S. woodpulp capacity and<br />
production have expanded rapidly. In 1920, 323 mills<br />
produced about 4 million tons of woodpulp; whereas in<br />
1983, 315 mills produced nearly 55 million tons. Average<br />
mill capacity has increased from just under 50 tons per day<br />
to over 550 tons per day.<br />
Changes have affected the relative pulping capacity for<br />
different regions and for different grades of pulp. In 1920,<br />
the Northeast held about 60 percent of all mills and<br />
65 percent of industry capacity. In 1983, the South produced<br />
over 65 percent of the nation’s woodpulp. Much of this<br />
regional redistribution has resulted from the rapid growth in<br />
sulfate pulping capacity, which is ideally suited to timber<br />
resources in the South. Sulfate pulp production was just<br />
5 percent of total production in 1920, nearly 75 percent in<br />
1983.<br />
In 1920, plant by-products made up less than 5 percent of<br />
pulpwood. However, the use for pulpwood of slabs, edgings,<br />
sawdust, and other timber-processing plant residues<br />
increased rapidly during the 1960’s and 1970’s; recently,<br />
plant by-products have supplied about 40 percent of all the<br />
wood pulped. Because most wood residues are now being<br />
used. little further increase is expected in the proportion of<br />
total pulpwood supplied by wood residue.<br />
Pulpmill Capacity<br />
<strong>The</strong> U.S. woodpulp industry remains a major processor of<br />
primary timber with a larger daily capacity 1 than at any time<br />
in its history.<br />
Total U.S. woodpulp capacity increased from 15,000 tons<br />
per day in 1920 to nearly 174,000 tons in 1983 (table 1). Net<br />
additions to capacity have averaged nearly 4 percent per<br />
year. A woodpulp mill is defined as a manufacturing facility<br />
that produces woodpulp at a single location, while a<br />
woodpulp plant has one or more mills operating as a unit at<br />
a single location. <strong>The</strong> number of U.S. mills has fluctuated<br />
since 1920 from a low of 258 mills active, idle, or under<br />
construction in 1950 to a high of 350 active mills in 1961.<br />
Since 1965, the number of active mills has declined from<br />
335 to 315, and the number of plants has declined from 277<br />
in 1961 to 271 in 1974 to 254 in 1983.<br />
Average woodpulp mill capacity has increased steadily from<br />
just under 50 tons in 1920 to over 550 tons per day in 1983<br />
(table 1). Increases have been achieved by additions to<br />
capacity of existing mills, larger average size of new mills,<br />
closing of smaller mills, and changes in the type of<br />
woodpulp produced and in the regional distribution of<br />
pulping capacity. <strong>The</strong> average mill built between 1974 and<br />
1983 had over twice the capacity of the average mill closed<br />
during this period. <strong>The</strong> size of the largest woodpulp mill also<br />
increased. <strong>The</strong> largest mill could produce 2,175 tons of<br />
woodpulp per day in 1961, 3,000 tons per day in 1983.<br />
Economies of scale associated with new pulping<br />
technologies were the chief cause of the steady increase in<br />
mill size.<br />
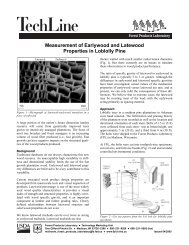
Today, more pulping capacity exists for sulfate (including<br />
soda) pulp than for any other pulp grade (70 percent of total<br />
daily capacity in 1983) (fig. 1). <strong>The</strong> 122 active sulfate mills,<br />
capable of producing 121,000 tons per day, were larger on<br />
the average than other mill types (table A-1), with an<br />
average capacity of nearly 1,000 tons per day. A sulfate mill<br />
was the largest U.S. woodpulp mill in 1983. Mills of the total<br />
groundwood (including refiner and thermomechanical) type<br />
1 Daily capacity is the amount of woodpulp that can be produced under normal<br />
conditions during a 24-hour period with full use of equipment and an adequate<br />
supply of pulpwood and labor.
Table 1—Active U.S. woodpulp mills, selected years 1920-83<br />
Year Plants Mills<br />
Total<br />
Capacity<br />
Average<br />
per mill<br />
No. No. - - - - - - - Tons/day - - - - - -<br />
1920 1<br />
— 323 15,340 47<br />
1930 1<br />
1940<br />
— 308 21,185 69<br />
1<br />
1950<br />
— 259 29,840 115<br />
1<br />
1955<br />
— 258 43,660 169<br />
1<br />
— 323 61,800 191<br />
1961 277 350 89,560 256<br />
1965 272 335 103,405 309<br />
1970 278 336 132,735 395<br />
1974 271 324 145,555 449<br />
1983 254 315 173,855 552<br />
1<br />
lncludes idle mills and mills under construction.<br />
Sources: Lockwood Publishing Co., Inc.<br />
(1966, 1968, 1971, 1973)<br />
McKeever, David B. (1977)<br />
Miller Freeman Publications, Inc. (1983)<br />
U.S. Department of Agriculture, <strong>Forest</strong> Service<br />
(1961, 1965)<br />
Vance Publishing Corp. (1984)<br />
had the second largest combined capacity, at 22,000 tons<br />
per day or 13 percent of total U.S. capacity. No other mill<br />
type accounted for more than 10 percent of total capacity.<br />
All types have experienced steadily increasing average mill<br />
size.<br />
<strong>The</strong> U.S. woodpulp industry has responded rapidly to<br />
changing pulping technologies. This is evidenced by the<br />
trends in mill capacities and numbers of mills diverging for<br />
different grades of pulp (fig. 1, table A-1). Since 1920, some<br />
woodpulp grades have steadily declined in importance<br />
(soda); others have steadily increased in importance<br />
(sulfate), and new grades have been developed<br />
(thermomechanical). Soda mills, once larger and more<br />
numerous than sulfate, have declined in importance to the<br />
extent that soda mill data are now included with sulfate.<br />
Sulfite mills steadily declined in numbers while increasing<br />
total capacity through 1965. Since then, both numbers and<br />
capacity have declined. Much of this decline has resulted<br />
from direct competition from sulfate pulp, which can be<br />
produced more efficiently, and from the high costs of<br />
pollution control associated with the sulfite pulping process<br />
(American Paper Institute 1975, 1979; Guthrie 1972).<br />
Average sulfite mill size, however, is still increasing.<br />
Capacity and numbers of sulfate mills increased rapidly<br />
through 1970. Since then, numbers of mills have stabilized<br />
at approximately 120, while capacity continues to increase.<br />
Many factors contributed to the rapid increase in sulfate<br />
pulping capacity: the ability to use very resinous woods and<br />
many different tree species; higher yields than other<br />
chemical pulping processes; economically retrievable pulping<br />
by-products such as tall oil and turpentine; greater strength<br />
properties than other chemical pulps; and substitutability for<br />
sulfite pulp (Guthrie 1972).<br />
2<br />
<strong>The</strong> capacity of groundwood mills steadily increased.<br />
Although numbers declined through 1974, a large increase<br />
occurred between 1974 and 1983 with the adoption of the<br />
thermomechanical pulping process. <strong>The</strong>rmomechanical pulp,<br />
despite relatively high energy consumption for its production,<br />
is very attractive because of its high yield and substitutability<br />
for more costly chemical pulps (American Paper Institute<br />
1981).<br />
Semichemical (including chemiground and chemimechanical)<br />
mills steadily decreased in numbers, but increased in<br />
capacity from 1961 through 1983 because of the increased<br />
use of hardwood pulpwood for which semichemical pulping<br />
is well suited (Guthrie 1972). Defibrated/exploded pulp mills,<br />
while maintaining fairly constant numbers, nearly doubled<br />
their capacity since 1961.<br />
Individual plant locations and capacities are listed in the<br />
appendix (table A-2). A map (fig. A-1) shows plant locations.<br />
Figure 1—Capacity of different types of woodpulp mills, 1920-83.
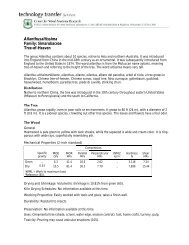
Regional Pulpmill Capacity<br />
Of the four regions (Northeast, North Central, South, and<br />
West, shown in fig. A-1), the South has the largest pulping<br />
capacity, with 147 active mills in 1983. <strong>The</strong>se mills are<br />
capable of producing 114,000 tons per day, nearly two-thirds<br />
of U.S. capacity (fig. 2, table A-3). <strong>The</strong> West is the second<br />
largest regional capacity at 30,000 tons per day, 17 percent<br />
of U.S. capacity. Capacity in the Northeast is 16,000 tons<br />
(9 pct) and in the North Central region is 13,000 tons per<br />
day (8 pct). Southern mills are larger than those in other<br />
regions.<br />
Since 1920, mill capacity has increased in all regions.<br />
Trends in the number of mills, however, vary in different<br />
regions. In the South, the number of mills has increased<br />
from 24 to 147 between 1920 and 1983 (table A-3). In the<br />
West the number of mills increased from 1920 through 1970,<br />
peaking at 75 then dropping to 62 by 1983. <strong>The</strong> Northeast<br />
steadily lost mills, dropping from a high of 197 in 1920 to 48<br />
in 1983. Numbers of North Central mills fluctuated widely,<br />
standing at 58 in 1983.<br />
<strong>The</strong> South is dominant in the woodpulp industry because its<br />
timber resources can support large sulfate pulping mills. <strong>The</strong><br />
southern pines are highly resinous and thus ideally suited to<br />
the sulfate pulping process. Large volumes of both<br />
roundwood pulpwood and sawmill and plywood plant<br />
residues provide the large quantities of relatively inexpensive<br />
pulpwood needed by southern sulfate mills (Guthrie 1972).<br />
In 1983, 76 percent of all sulfate pulp capacity was in the<br />
South, accounting for 80 percent of the South’s total<br />
capacity. Much of the remaining sulfate capacity and over<br />
half the sulfite capacity is located in the West. Western<br />
softwoods such as fir, spruce, and hemlock are well suited<br />
to sulfite pulping because of their low resin content. <strong>The</strong><br />
Northeast and North Central regions tend to produce pulp<br />
grades, such as semichemical, capable of using the<br />
abundant hardwood resource efficiently. Regional<br />
differences also reflect the installation dates and differing<br />
economies of scale between major pulping processes.<br />
Figure 2—Capacity of woodpulp mills in different regions,<br />
and total capacity 1920-83.<br />
3
Annual U.S. Pulpmill Capacity and<br />
Production<br />
Annual U.S. woodpulp mill capacity, that is, capacity per day<br />
multiplied by scheduled numbers of operating days for each<br />
mill, is larger now than ever, and is estimated to have been<br />
60 million tons in 1983 (table 2). Trends in capacity<br />
measured per year and per day are closely parallel. Overall,<br />
growth averaged over 4 percent per year since 1940, slightly<br />
higher than growth in daily capacity. Between 1940 and<br />
1970, capacity increased more than 5 percent per year;<br />
since 1970 on the average, it has increased just 2 percent<br />
par year.<br />
Annual woodpulp production is consistently below annual<br />
capacity. Since 1940, woodpulp production averaged nearly<br />
91 percent of annual capacity, ranging from a high of<br />
96 percent in 1972 to a low of 83 percent in 1975 (table 2).<br />
<strong>The</strong> distribution of annual capacity of each woodpulp grade<br />
is very similar to the distribution of daily capacity. <strong>The</strong><br />
42 million tons of sulfate capacity in 1983 were greater than<br />
Table 2—Annual U.S. industrial roundwood and pulpwood consumption and woodpulp<br />
capacity and production, selected years 1920-83<br />
Industrial roundwood use Pulpwood use <strong>Woodpulp</strong><br />
Year All Pulpwood<br />
products 1<br />
volume (pct)<br />
Per ton<br />
Total of pulp Capacity Production2 Ratio<br />
produced<br />
(C) (P) (P/C)<br />
Million ft 3 , roundwood 1,000 cords Cords - - - - - -1,000 tons - - - - - - Pct<br />
equivalent<br />
1920 7,770 360 (5) 6,114 1.60 —<br />
1930 6,305 395 (6) 7,196 1.55 —<br />
1940 6,975 930 (13) 13,743 1.53 10,421<br />
1950 8,530 1,500 (18) 23,627 1.59 16,167<br />
1955 9.225 2,200 (24) 33,356 1.61 22,407<br />
1960 8,920 2,575 (29) 40,485 1.60 29,536<br />
1965 10,555 3,095 (29) 52,236 1.57 35,758<br />
1970 11,105 3,835 (35) 67,562 1.55 45,863<br />
1971 11,035 3,560 (32) 67,157 1.53 47,516<br />
1972 11,440 3,520 (31) 71,538 1.53 48,732<br />
1973 11,925 3,755 (31) 73,596 1.52 50,673<br />
1974 11,540 4,220 (37) 74,327 1.54 51,296<br />
1975 10,570 3,485 (33) 65,373 1.52 51,927<br />
1976 11,925 3,805 (32) 72,011 1.51 53,047<br />
1977 12,185 3,645 (30) 73,936 1.50 54,348<br />
1978 12,575 3,745 (30) 74,170 1.48 55,214<br />
1979 12,955 4,110 (32) 77,594 1.52 56,136<br />
1980 12,090 4,390 (36) 79,703 1.50 57,714<br />
1981 10,915 4,125 (38) 79,350 1.50 59,331<br />
1982 10,825 3,980 (37) 77,574 1.52 60,133<br />
3 1983 12,395 4,180 (34) 82,386 1.50 60,190<br />
1<br />
Excludes fuelwood production.<br />
2<br />
Includes woodpulp for hard-pressed board<br />
4<br />
3 Preliminary<br />
Sources: Hair, Dwight, and Alice H. Ulrich (1964)<br />
Ulrich, Alice H. (1985)<br />
American Paper Institute (1983b, 1984)<br />
McKeever, David B. (1977)<br />
U.S. Department of Agriculture, <strong>Forest</strong> Service (1961, 1965)<br />
U.S. Department of Commerce, Bureau of the Census (1983)<br />
<strong>United</strong> <strong>States</strong> Pulp Producers Assoc., Inc. (1956, 1961)<br />
for any other pulp grade, accounting for 70 percent of total<br />
annual capacity (table A-4). Groundwood capacity was<br />
second largest at over 6 million tons per year, 11 percent of<br />
total annual capacity. No other pulp grade accounted for<br />
more than 10 percent of total annual capacity.<br />
Different woodpulp grades show differing annual capacity<br />
trends since 1940. Sulfate capacity increased steadily from<br />
just under 5 million tons to over 42 million tons in 1983, an<br />
average increase of nearly 5.3 percent per year (table A-4).<br />
Growth in sulfate capacity is responsible for much of the<br />
growth in total U.S. annual woodpulp capacity. Groundwood<br />
and semichemical pulp capacity also increased on the<br />
average during this 43-year period. Sulfite capacity has<br />
steadily decreased, while dissolving/special alpha and<br />
defibrated/exploded pulp capacity increased through the<br />
1970’s and then decreased.<br />
3,822 —<br />
4,630 —<br />
8,961 86<br />
14,849 92<br />
20,740 93<br />
25,316 86<br />
33,296 93<br />
43,546 95<br />
43,903 92<br />
46,767 96<br />
48,327 95<br />
48,349 94<br />
43,084 83<br />
47,721 90<br />
49,132 90<br />
50,020 91<br />
51,177 91<br />
52,959 92<br />
52,790 89<br />
50,986 85<br />
54,808 91
Pulpwood Consumption and Production<br />
In 1983, more than 82 million cords of pulpwood (roundwood<br />
plus plant by-products) were consumed to produce nearly<br />
55 million tons of woodpulp (table 2). Pulpwood consumption<br />
by the woodpulp industry has increased steadily since 1920<br />
(with the exception of brief recession periods) at about<br />
4 percent per year. <strong>The</strong> quantity of pulpwood required to<br />
produce a ton of woodpulp has remained surprisingly<br />
constant over the past 62 years. On the average, 1.5 cords<br />
of pulpwood are consumed per ton of woodpulp produced.<br />
<strong>The</strong> apparent stability over time in the quantity of pulpwood<br />
required to produce a ton of pulp is partially attributable to<br />
offsetting gains and losses in yields of different grades of<br />
woodpulp produced. Prior to 1970, pulpwood requirements<br />
were slightly higher (1.55-1.60 cords per ton). <strong>The</strong><br />
year-to-year variation in pulpwood consumption per ton of<br />
pulp produced is a result of several factors, including the<br />
amounts of the various pulp grades produced, the mix of<br />
roundwood and residues used, and individual mill production<br />
levels.<br />
Pulpwood requirements vary with the grade of pulp<br />
produced. <strong>The</strong> mechanical pulping processes, such as<br />
groundwood and defibrated/exploded, require on the<br />
average less pulpwood per ton of woodpulp than the<br />
chemical pulping processes such as sulfite. This is because<br />
chemical pulps contain less lignin and hemicellulose fibers;<br />
mechanical pulps contain not only the wood cellulose fibers<br />
but some of the lignin and other noncellulosic constituents<br />
(Kline 1976). Dissolving/special alpha pulps required<br />
2.22 cords of pulpwood to produce a ton of woodpulp in<br />
1983 (table A-5), more than any other grade.<br />
Defibrated/exploded pulp, the most efficient pulping process,<br />
required only 0.84 cords of pulpwood but had lower fiber<br />
quality than other pulp grades. Sulfate pulpwood usage was<br />
intermediate at 1.63 cords per ton. Although pulpwood<br />
requirements vary from year to year, they have remained<br />
fairly constant for each woodpulp grade. In general,<br />
production has grown more for pulp grades with lower<br />
cellulose fiber content (e.g. sulfate, groundwood, and<br />
semichemical) than for those with higher cellulose fiber<br />
content.<br />
Total U.S. pulpwood production in 1983 was nearly<br />
88 million cords (table A-6), of which 82 million cords were<br />
consumed for woodpulp. Of this, 60 percent was roundwood<br />
and 40 percent plant by-products, such as slabs, edgings,<br />
and sawdust. <strong>The</strong> use of plant by-products as a pulpwood<br />
source increased rapidly between 1920 and 1970, from a<br />
negligible 3 percent in 1920 to nearly 30 percent in 1970.<br />
During the 1970’s use increased to a high of 43 percent in<br />
1977 before falling to 40 percent in 1983. Future increases<br />
in the use of plant by-products for woodpulp production are<br />
unlikely without new sources of usable plant by-products.<br />
Whole-tree chips, chips produced in the forest from entire<br />
trees, including bark, branches, limbs and foliage, were first<br />
introduced in the early 1970’s (McGovern 1985). <strong>The</strong>se<br />
chips provide a low-cost fiber source, but do reduce yields<br />
and contain increased levels of contaminants. Whole-tree<br />
chip production currently accounts for about 9 to 10 percent<br />
of total pulpwood production in the Northeast and North<br />
Central regions and about 4 percent in the South.<br />
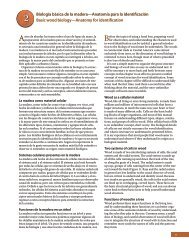
<strong>The</strong> species mix of pulpwood consumed has changed little<br />
in recent years. <strong>The</strong> mix is about 20 percent hardwood<br />
roundwood, 40 percent softwood roundwood, and 40 percent<br />
plant by-products (fig. 3). Plant by-products are about<br />
15 percent hardwood and 85 percent softwood fibers.<br />
Changes in the species mix are likely as new technologies<br />
are developed and adopted. For example, press drying is a<br />
process currently being developed to produce high-strength<br />
kraft linerboard from hardwood pulpwood (Ince 1981). Its<br />
adoption would permit the use of hardwood pulpwood in the<br />
sulfate process.<br />
Domestic pulpwood production as a percentage of total<br />
industrial roundwood production (excluding fuelwood) has<br />
been increasing on the average over the past 63 years.<br />
During the 1960’s and 1970’s, pulpwood accounted for<br />
32 percent of total roundwood production. In 1983, over<br />
4 billion cubic feet (roundwood equivalent) of pulpwood were<br />
produced—34 percent of total roundwood production<br />
(table 2).<br />
Figure 3—Annual U.S. pulpwood production, by type, 1920-83.<br />
5
<strong>Woodpulp</strong> Imports, Exports, and<br />
Apparent Domestic Consumption<br />
Foreign trade in woodpulp is small compared to domestic<br />
production. During the past 20 years, neither imports nor<br />
exports of woodpulp exceeded 10 percent of production. In<br />
1983, woodpulp imports were estimated at 4.1 billion tons,<br />
exports at 3.6 billion tons (table A-7). Since 1960, imports<br />
have averaged 8 percent of total U.S. production, exports<br />
nearly 6 percent. Canada is the major source of woodpulp<br />
imported to the <strong>United</strong> <strong>States</strong> and supplied 95 percent of all<br />
woodpulp imported in 1980 (U.S. Department of Commerce,<br />
Bureau of the Census, 1981):<br />
Country of origin Imports<br />
(1,000 tons) (pct)<br />
Canada 3,853 95<br />
Republic of South Africa 84 2<br />
Brazil 78 2<br />
Finland. Sweden 30 1<br />
Other 6
Literature Cited<br />
American Paper Institute. Paper, paperboard, woodpulp<br />
capacity, fiber consumption 1974-1977. New York:<br />
American Paper Institute; 1975. 25 p.<br />
American Paper Institute. Paper/paperboard, woodpulp<br />
capacity, fiber consumption 1978-1981. New York:<br />
American Paper Institute; 1979. 25 p.<br />
American Paper Institute. Paper, paperboard, woodpulp<br />
capacity, fiber consumption 1980-1983. New York:<br />
American Paper Institute; 1981. 29 p.<br />
American Paper Institute. Paper, paperboard, woodpulp<br />
capacity, fiber consumption 1982-1985. New York:<br />
American Paper Institute; 1983a. 29 p.<br />
American Paper Institute. 1983 statistics of paper,<br />
paperboard, & wood pulp. New York: American Paper<br />
Institute; 1983b. 76 p.<br />
American Paper Institute. Wood pulp and fiber statistics,<br />
1981-1982. 46th ed. Book 1. New York: American Paper<br />
Institute; 1984 84 p.<br />
Guthrie, John A. An economic analysis of the pulp and<br />
paper industry. Pullman, WA: Washington State University<br />
Press; 1972. 235 p.<br />
Hair, Dwight; Ulrich, Alice H. <strong>The</strong> demand and price<br />
situation for forest products—1964. Misc. Publ. No. 983.<br />
Washington, DC: U.S. Department of Agriculture, <strong>Forest</strong><br />
Service; 1964. 50 p.<br />
Ince, Peter J. FPL press drying process-wood savings in<br />
linerboard manufacture. Tappi Journal. 64(4): 107-109;<br />
1981.<br />
Kline, Charles H. & Co., Inc. <strong>The</strong> Kline guide to the paper<br />
and pulp industry. James Rauch, ed. Fairfield, NJ: Charles<br />
H. Kline & Co., Inc.; 1976. 213 p.<br />
Lockwood Publishing Co., Inc. Lockwood’s directory of<br />
the paper and allied trades, 1967. 92nd ed. New York:<br />
Lockwood Publishing Co., Inc.; 1966. 1700 p.<br />
Lockwood Publishing Co., Inc. Lockwood’s directory of<br />
the paper and allied trades, 1969. 94th ed. New York:<br />
Lockwood Publishing Co., Inc.; 1968. 1700 p.<br />
Lockwood Publishing Co., Inc. Lockwood’s directory of<br />
the paper and allied trades, 1971/2. 96th ed. New York:<br />
Lockwood Publishing Co., Inc.; 1971. 832 p.<br />
Lockwood Publishing Co., Inc. Lockwood’s directory of<br />
the paper and allied trades, 1974. 98th ed. New York:<br />
Lockwood Publishing Co., Inc.; 1973. 840 p.<br />
McGovern, J. N. Changes in U.S. papermaking fibers:<br />
1690-1985. <strong>Forest</strong>ry Res. Note No. 262. Madison, WI:<br />
University of Wisconsin-Madison, Department of <strong>Forest</strong>ry;<br />
1985. 12 p.<br />
McKeever, David B. <strong>Woodpulp</strong> mills in the <strong>United</strong> <strong>States</strong><br />
in 1974. Resour. Bull. FPL-l. Madison, WI: U.S. Department<br />
of Agriculture, <strong>Forest</strong> Service, <strong>Forest</strong> <strong>Products</strong><br />
<strong>Laboratory</strong>; 1977. 36 p.<br />
Miller Freeman Publications, Inc. 1984 Post’s pulp &<br />
paper directory. San Francisco: Miller Freeman<br />
Publications, Inc.; 1983. 762 p.<br />
Ulrich, Alice H. U.S. timber production trade, consumption,<br />
and price statistics, 1950-84. Misc. Publ. No. 1450.<br />
Washington, DC: U.S. Department of Agriculture, <strong>Forest</strong><br />
Service; 1985. 84 p.<br />
U.S. Department of Agriculture, <strong>Forest</strong> Service.<br />
<strong>Woodpulp</strong> mills in the <strong>United</strong> <strong>States</strong> by state and type of<br />
product. Washington, DC: U.S. Department of Agriculture,<br />
<strong>Forest</strong> Service; 1961. 23 p.<br />
U.S. Department of Agriculture, <strong>Forest</strong> Service.<br />
<strong>Woodpulp</strong> mills in the <strong>United</strong> <strong>States</strong> and Canada, 1965.<br />
Washington, DC: U.S. Department of Agriculture, <strong>Forest</strong><br />
Service: 1965. 20 p.<br />
U.S. Department of Commerce, Bureau of the<br />
Census. U.S. imports for consumption and general<br />
imports. TSUSA commodity by country of origin.<br />
FT246/Annual 1980. Washington, DC: U.S. Department<br />
of Commerce, Bureau of the Census; 1981. 623 p.<br />
U.S. Department of Commerce, Bureau of the<br />
Census. Pulp, paper, and board. Current Ind. Reps. Ser.<br />
MA-26A (annual). Washington, DC: U.S. Department of<br />
Commerce, Bureau of the Census; 1983. 10 p.<br />
<strong>United</strong> <strong>States</strong> Pulp Producers Association, Inc. Wood<br />
pulp statistics. 21st ed. New York: <strong>United</strong> <strong>States</strong> Pulp<br />
Producers Assoc., Inc.; 1956. 241 p.<br />
<strong>United</strong> <strong>States</strong> Pulp Producers Association, Inc. Wood<br />
pulp statistics. 26th ed. New York: <strong>United</strong> <strong>States</strong> Pulp<br />
Producers Assoc., Inc.; 1961. 255 p.<br />
Vance Publishing Corp. Lockwood’s directory of the<br />
paper and allied trades, 1983. 108th ed. New York: Vance<br />
Publishing Corp., Inc.; 1984. 912 p.<br />
7
Appendix<br />
<strong>The</strong> following statistical data for selected years, have been brought<br />
together to exhibit details of the growth and change taking place in<br />
the woodpulp industry in the <strong>United</strong> <strong>States</strong> between 1920 and 1993:<br />
Table A-1—Number and capacity of active U.S. woodpulp mills of<br />
each type in selected years.<br />
Table A-2—Capacity of individual active U.S. woodpulp plants in<br />
selected years, in 1983 listed by mill type.<br />
Table A-3—Number and capacity of active U.S. woodpulp mills in<br />
each region in selected years.<br />
Table A-4—Annual U.S. woodpulp mill capacity, woodpulp<br />
production and production as a percentage of capacity for different<br />
grades of pulp in selected years.<br />
Table A-b-Annual U.S. woodpulp production, pulpwood<br />
consumption and consumption per unit of production, for different<br />
grades of pulp in selected years.<br />
Table A-6—Annual U.S. production of pulpwood of different types in<br />
selected years.<br />
Table A-7—Annual U.S. woodpulp production, imports, exports, and<br />
apparent domestic consumption in selected years.<br />
Figure A-1—Shows the location, daily capacity and type of<br />
woodpulp plants in different regions of the <strong>United</strong> <strong>States</strong> in 1983.<br />
8
Table A-1—Number and capacity of active U.S. woodpulp mills of each type in selected years<br />
Defibrated/Exploded<br />
Semichemical 3<br />
Groundwood 2<br />
Sulfate 1<br />
Capacity<br />
Number<br />
Total Average<br />
Capacity<br />
Total Average<br />
Capacity<br />
Number<br />
Number<br />
Average<br />
Total<br />
Capacity<br />
Total Average<br />
Number<br />
Sulfite<br />
Capacity<br />
Total Average<br />
Year<br />
Number<br />
1<br />
lncludes soda pulp mills.<br />
2<br />
Includes chemiground mills, 1920-55, and stone ground, refiner, and thermomechanical mills, 1961-83.<br />
3 Includes chemiground and chemimechanical pulp mills, 1961-83.<br />
4 Includes idle mills and mills under construction.<br />
5 Includes defibrated/exploded and chemimechanical pulp mills.<br />
6 Included in semichemical.<br />
Sources: Lockwood Publishing Co., Inc. (1966, 1971, 1968, 1973)<br />
McKeever, David B. (1977)<br />
Miller Freeman Publications, Inc. (1983)<br />
U.S. Department of Agriculture, <strong>Forest</strong> Service (1961, 1966)<br />
Vance Publishing Corp. (1984)
Table A-2—Capacity of individual active U.S. woodpulp plants in 1961,1965,1970, and 1974, and, by type, in 1983<br />
1983<br />
Defibrated/<br />
exploded<br />
Plant name Plant location 1961 1965 1970 1974 Groundwood 2<br />
Total Sulfite Sulfate<br />
Semi-<br />
1<br />
Stone Refiner chemical3<br />
Plant<br />
number<br />
Northeast<br />
Connecticut<br />
1 Tilo Co., inc. Stratford<br />
Total capacity<br />
Total mills<br />
Total plants<br />
Maine<br />
2 Boise Cascade Corp. Rumford<br />
3 James River Corp. Old Town<br />
4 Eastern Fine Paper, Inc. Brewer<br />
5 Georgia-Pacific Corp. Woodland<br />
6 Great Northern Paper Co. East Millinocket<br />
7 Great Northern Paper Co. Millinocket<br />
8 Hearst Corp. Brunswick<br />
9 International Paper Co. Chisholm<br />
10 International Paper Co. Jay<br />
11 International Paper Co. Livermore Falls<br />
12 International Paper Co. Riley<br />
13 Keyes Fibre Co. Shawmut<br />
14 Lily-Tulip Inc. Old Town<br />
15 Lincoln Pulp & Paper Co., Inc. Lincoln<br />
16 Madison Paper Industries Inc. Madison<br />
17 Scott Paper Co. Hinckley<br />
18 Scott Paper Co. Madison<br />
19 Scott Paper Co. Winslow<br />
20 Statler Tissue Corp. Augusta<br />
21 St. Regis Paper Co. Bucksport<br />
22 S.D. Warren Co. Westbrook<br />
23 <strong>United</strong> <strong>States</strong> Gypsum Co. Lisbon Falls<br />
Total capacity<br />
Total mills<br />
Total plants<br />
Maryland<br />
24 Barrett Paper Corp., Ltd. Childs<br />
25 Congoleum Corp. Finksburg<br />
26 Westvaco Corp. Luke<br />
Total capacity<br />
Total mills<br />
Total plants<br />
Massachusetts<br />
27 Oxford Paper Co., Inc. Lawrence<br />
Total capacity<br />
Total mills<br />
Total plants
Defibrated/<br />
exploded<br />
Table A-2—Capacity of individual active U.S. woodpulp plants in 1961, 1965, 1970, and 1974, and, by type, in 1983—Continued<br />
1983<br />
Plant<br />
number<br />
Plant name Plant location 1961 1965 1970 1974<br />
Total Sulfite Sulfate 1 Groundwood2 Semi-<br />
Stone Refiner chemical3<br />
Northeast-Continued<br />
New Hampshire<br />
28 Franconia Paper Corp. Lincoln<br />
29 Franconia Paper Corp. Plymouth<br />
30 Groveton Papers Co. Groveton<br />
31 James River Corp. Berlin<br />
Total capacity<br />
Total mills<br />
Total plants<br />
New Jersey<br />
32 Celotex Corp. Perth Amboy<br />
33 Flintkote Co. Little Ferry<br />
34 GAF Corp. Gloucester City<br />
35 Johns-Manville Corp. Manville<br />
36 Western Electric Co. Kearny<br />
Total capacity<br />
Total mills<br />
Total plants<br />
New York<br />
37 Adirondack Fibre Corp. Glens Falls<br />
38 American Wood Board Co. Schuylerville<br />
39 Armstrong Cork Co. Fulton<br />
40 Boise Cascade Corp. Beaver Falls<br />
41 Celotex Corp. Deposit<br />
42 Certain Teed Corp. Niagara Falls<br />
43 Cogar Inc. Lyons Falls<br />
44 Crown Zellerbach Corp. Carthage<br />
45 Finch, Pruyn & Co., Inc. Glens Falls<br />
46 Flintkote Co. Lockport<br />
47 Georgia-Pacific Corp. Lyons Falls<br />
48 Georgia-Pacific Corp. Plattsburgh<br />
49 Georgia-Pacific Corp. Willsboro<br />
50 Harrisville Paper Corp. Harrisville<br />
51 Imperial Wallpaper Mill, Inc. Plattsburgh<br />
52 International Paper Co. Corinth<br />
53 International Paper Co. North Tonawanda<br />
54 International Paper Co. Palmer<br />
55 International Paper Co. Ticonderoga<br />
56 Island Paper Co. Carthage<br />
57 Nekoosa Edwards Paper<br />
Co., Inc. Potsdam<br />
58 Nitec Paper Corp. Niagara Falls<br />
59 Packaging Corp. of America Plattsburgh<br />
60 Rushmore Paper Mills Inc. Natural Dam<br />
61 Sagamore Pulp Corp. Fort Edward
Table A-2—Capacity of individual active U.S. woodpulp plants in 1961, 1965, 1970, and 1974, and, by type, in 1983—Continued<br />
1983<br />
Defibrated/<br />
exploded<br />
Semi-<br />
Stone Refiner chemical3<br />
1 Groundwood2<br />
Plant name Plant location 1961 1965 1970 1974<br />
Plant<br />
number<br />
Total Suifite Sulfate<br />
Northeast-Continued<br />
New York—Continued<br />
62 Sealright-Oswego Falls Corp. Fulton<br />
63 Stevens & Thompson Paper Co. Greenwich<br />
64 St. Lawrence Pulp & Paper Corp. Norfolk<br />
65 St. Lawrence Pulp & Paper Corp. Ogdensburg<br />
66 St. Regis Paper Co. Deferiet<br />
67 Tagons Papers Inc. Mechanicyille<br />
68 Thomas Galante and Sons Inc. Warrensburg<br />
Total capacity<br />
Total mills<br />
Total plants<br />
Pennsylvania<br />
69 Appleton Papers Inc. Roaring Spring<br />
70 Celotex Corp. Philadelphia<br />
71 Celotex Corp. Sunbury<br />
72 CertainTeed Corp. York<br />
73 Hammermill Papers Group Erie<br />
74 International Paper Co. York Haven<br />
75 Masonite Corp. Towanda<br />
76 Hammermill Papers Group Lock Haven<br />
77 Penntech Papers Inc. Johnsonburg<br />
78 Proctor & Gamble Paper<br />
<strong>Products</strong> Mehoopay<br />
79 P.H. Glatfelter Co. Spring Grove<br />
80 Ruberoid Co. Erie<br />
81 Westvaco Corp. Tyrone<br />
82 Westvaco Corp. Williamsburg<br />
Total capacity<br />
Total mills<br />
Total plants<br />
Rhode Island<br />
83 Bird & Son Inc. Phillipsdale<br />
Total capacity<br />
Total mills<br />
Total plants<br />
Vermont<br />
84 Gilman Paper Co. Gilman<br />
85 Ryegate Paper Co. East Ryegate<br />
86 Boise Cascade Corp. Sheldon Spring<br />
Total capacity<br />
Total mills<br />
Total plants<br />
Total capacity, Northeast<br />
Total mills, Northeast<br />
Total plants, Northeast
Semi-<br />
Defibrated/<br />
chemical3<br />
exploded<br />
Table A-2—Capacity of individual active U.S. woodpulp plants in 1961, 1965, 1970, and 1974, and, by type, in 1983—Continued<br />
1983<br />
Plant<br />
number<br />
Plant name Plant location 1961 1965 1970 1974<br />
Total Sulfite Sulfate 1<br />
Groundwood2<br />
Stone Refiner<br />
North Central<br />
Illinois<br />
87 Allied Chemical Corp. Peoria<br />
88 Alton Box Board Co. Alton<br />
89 Bird & Son Inc. Chicago<br />
90 Celotex Corp. Peoria<br />
91 Celotex Corp. Wilmington<br />
92 CertainTeed Corp. East St. Louis<br />
93 GAF Corp. Joliet<br />
94 Genstar Building Material Co. Mount Carmel<br />
95 Globe Roofing <strong>Products</strong> Co. Chicago<br />
96 Johns-Manville <strong>Products</strong> Corp. Waukegan<br />
Total capacity<br />
Total mills<br />
Total plants<br />
Indiana<br />
97 Container Corp. of America Carthage<br />
98 Weston Paper & Mfg. Co. Terre Haute<br />
Total capacity<br />
Total mills<br />
Total plants<br />
Iowa<br />
99 Celotex Corp. Dubuque<br />
100 Consolidated Packaging Corp. Fort Madison<br />
101 <strong>United</strong> <strong>States</strong> Gypsum Co. Fort Dodge<br />
Total capacity<br />
Total mills<br />
Total plants<br />
Michigan<br />
102 Abitibi-Price Corp. Alpena<br />
103 American Fibrit Inc. Battle Creek<br />
104 Celotex Corp. L'Anse<br />
105 Champion Packaging Ontonagon<br />
106 Charmin Paper <strong>Products</strong> Co. Cheboygan<br />
107 Kimberly-Clark Corp. Munising<br />
108 Manistique Papers Inc. Manistique<br />
109 Mead Corp. Escanaba<br />
110 Mead Corp. Groos<br />
111 Menasha Corp. Otsego<br />
112 Packaging Corp. of America Filer City<br />
113 Scott Paper Co. Detroit<br />
114 Scott Paper Co. Menominee<br />
115 S.D. Warren Co. Muskegon<br />
116 Watervliet Paper Co. Watervliet<br />
Total capacity<br />
Total mills<br />
Total plants
Table A-2—Capacity of individual active U.S. woodpulp plants In 1961, 1965, 1970, and 1974, and, by type, In 1983—Continued<br />
1983<br />
Semi-<br />
Defi-<br />
brated/<br />
chemical3<br />
exploded<br />
Groundwood2<br />
Plant name Plant location 1961 1965 1970 1974<br />
Total Sulfite Sulfate 1<br />
Plant<br />
number<br />
Stone Refiner<br />
North Central—Continued<br />
Minnesota<br />
117 Blandin Paper Co. Grand Rapids<br />
118 Boise Cascade Corp. Int’l Falls<br />
119 CertainTeed Corp. Shakopee<br />
120 Champion Packaging St. Paul<br />
121 Conwed Corp. Cloquet<br />
122 Hennepin Paper Co. Little Falls<br />
123 Minnesota & Ontario Paper CO. Int’l Falls<br />
124 Potlatch Corp. Cloquet<br />
125 St. Regis Paper Co. Sartell<br />
126 Superwood Corp. Bemidji<br />
127 Superwood Corp. Duluth<br />
Total capacity<br />
Total mills<br />
Total plants<br />
Missouri<br />
128 GAF Corp. Kansas City<br />
129 Huebert Fiberboard Inc. Boonville<br />
Total capacity<br />
Total mills<br />
Total plants<br />
Ohio<br />
130 Bird & Son, Inc. Franklin<br />
131 Celotex Corp. Cincinnati<br />
132 CertainTeed Corp. Avery<br />
133 Container Corp. of America Circleville<br />
134 Georgia-Pacific Corp. Franklin<br />
135 Mead Corp. Chillicothe<br />
136 Stone Container Corp. Coshocton<br />
Total capacity<br />
Total mills<br />
Total plants<br />
Wisconsin<br />
137 Appleton Papers Inc. Combined Locks<br />
138 Badger Paper Mills Inc. Peshtigo<br />
139 Charmin Paper <strong>Products</strong> CO. Little Rapids<br />
140 Consolidated Papers Inc. Appleton<br />
141 Consolidated Papers Inc. Biron<br />
142 Consolidated Papers Inc. Stevens Point<br />
143 Consolidated Papers Inc. Wisconsin Rapids<br />
144 Flambeau Paper Corp. Park Falls<br />
145 Fort Howard Paper Co. Green Bay
Table A-2—Capacity of individual active U.S. woodpulp plants in 1961, 1965, 1970, and 1974, and, by type, In 1983—Continued<br />
1983<br />
Groundwood2 Semi-<br />
Defi-<br />
3 brated/<br />
Stone Refiner<br />
chemical<br />
exploded<br />
Plant name Plant location 1961 1965 1970 1974<br />
Plant<br />
number<br />
Total Sulfite Sulfate 1<br />
North Central-Continued<br />
Wisconsin-Continued<br />
146 Genstar Building Material Co. Cornell<br />
147 Green Bay Packaging Inc. Green Bay<br />
148 James River-Dixie/Northern Green Bay<br />
149 Midtec Paper Corp. Kimberly<br />
150 Mosinee Paper Corp. Mosinee<br />
151 Nekoosa Papers Inc. Nekoosa<br />
152 Nekoosa Papers Inc. Port Edwards<br />
153 Niagara of Wisconsin Paper Niagara<br />
Corp.<br />
154 Owens-Illinois Inc. Tomahawk<br />
155 Pope & Talbot Inc. Eau Claire<br />
156 Pope & Talbot Inc. Eau Claire<br />
157 Proctor & Gamble Paper Co. Green Bay<br />
158 Rhinelander Paper Co. Rhinelander<br />
159 Scott Paper Co. Marinette<br />
160 Scott Paper Co. Oconto Falls<br />
161 Superior Fibre <strong>Products</strong> Inc. Superior<br />
162 Superwood Corp. Phillips<br />
163 Thilmany Pulp & Paper Co. Kaukauna<br />
164 Tomahawk Power & Pulp Co., Tomahawk<br />
Inc.<br />
165 Wausau Paper Mills Co. Brokaw<br />
166 Weyerhaeuser Co. Rothschild<br />
Total capacity<br />
Total mills<br />
Total plants<br />
Total capacity, North Central<br />
Total millls, North Central<br />
Total plants, North Central<br />
South<br />
Alabama<br />
167 Alabama Kraft Co. Mahrt<br />
168 Alabama River Pulp Co. Claiborne<br />
169 Allied Paper Inc. Jackson<br />
170 Champion Papers Courtland<br />
171 Container Corp. of America Brewton<br />
172 GAF Corp. Mobile<br />
173 Gulf <strong>States</strong> Paper Corp. Demopolis<br />
174 Gulf <strong>States</strong> Paper Corp. Tuscaloosa<br />
175 Hammermill Papers Group Selma<br />
176 International Paper Co. Mobile<br />
177 James River-Dixie/Northern Pennington
Defibrated/<br />
exploded<br />
Table A-2—Capacity of individual active U.S. woodpulp plants In 1961, 1965, 1970, and 1974, and, by type, in 1983—Continued<br />
1983<br />
Plant<br />
number<br />
Plant name Plant location 1961 1965 1970 1974<br />
Total Sulfite Sulfate 1 Groundwood2<br />
Semi-<br />
Stone Refiner chemical3<br />
South—Continued<br />
Alabama—Continued<br />
178 Kimberly-Clark Corp. Coosa Pines<br />
179 MacMillan Bloedel Inc. Pine Hill<br />
180 Mead Corp. Stevens<br />
181 National Gypsum Co. Mobile<br />
182 Scott Paper Co. Mobile<br />
183 Union Camp Corp. Montgomery<br />
Total capacity<br />
Total mills<br />
Total plants<br />
Arkansas<br />
184 Arkansas Kraft Corp. Morrilton<br />
185 Georgia-Pacific Corp. Crossett<br />
186 International Paper Co. Camden<br />
187 International Paper Co. Pine Bluff<br />
188 Nekoosa Papers Inc. Ashdown<br />
189 Potlatch Corp. McGehee<br />
190 Superwood Corp. North Little Rock<br />
191 Weyerhaeuser Co. Pine Bluff<br />
Total capacity<br />
Total mills<br />
Total plants<br />
Florida<br />
192 Alton Packaging Corp. Jacksonville<br />
193 Armstrong Cork Co. Pensacola<br />
194 Buckeye Cellulose Corp. Foley<br />
195 Container Corp. of America Fernandina Beach<br />
196 Georgia-Pacific Corp. Palatka<br />
197 Goodson’s Mfg Corp. Blountstown<br />
198 ITT Rayonier Inc. Fernandina Beach<br />
199 Southwest <strong>Forest</strong> Industries Inc. Panama City<br />
200 St. Joe Paper Co. Port St. Joe<br />
201 St. Regis Paper Co. Cantonment<br />
202 Jacksonville Kraft Paper Co. Jacksonville<br />
203 St. Regis Paper Co. Pensacola<br />
Total capacity<br />
Total mills<br />
Total plants<br />
Georgia<br />
204 Armstrong World Industries Inc. Macon<br />
205 Augusta Newsprint Co. Augusta<br />
206 Brunswick Pulp & Paper co. Brunswick
Semi- Defibrated/<br />
chemical3<br />
exploded<br />
Table A-2—Capacity of individual active U.S. woodpulp plants In 1961, 1965, 1970, and 1974, and, by type, in 1983—Continued<br />
1983<br />
Plant<br />
number<br />
Plant name Plant location 1961 1965 1970 1974<br />
Total Sulfite Sulfate 1 Groundwood2<br />
Stone Refiner<br />
South-Continued<br />
Georgia-Continued<br />
207 Buckeye Cellulose Corp. Oglethorpe<br />
208 CertainTeed Corp. Savannah<br />
209 Continental <strong>Forest</strong> Industries Augusta<br />
210 GAF Corp. Savannah<br />
211 Georgia Kraft Co. Krannert<br />
212 Georgia Kraft Co. Macon<br />
213 Georgia Kraft Co. Rome<br />
214 Gilman Paper Co. St. Marys<br />
215 Great Southern Paper Co. Cedar Springs<br />
218 Interstate Paper Corp. Riceboro<br />
217 ITT Rayonier Inc. Jesup<br />
218 Owens-Illinois Inc. Valdosta<br />
219 Southeast Paper Mfg. Co. Dublin<br />
220 Stone Container Corp. Port Wentworth<br />
221 Union Camp Corp. Savannah<br />
Total capacity<br />
Total mills<br />
Total plants<br />
Kentucky<br />
222 Westvacc Corp. Wickliffe<br />
223 Willamette Industries Inc. Hawesville<br />
Total capacity<br />
Total mills<br />
Total plants<br />
Louisiana<br />
224 Bird & Son Inc. Shreveport<br />
225 Boise Southern Co. Deridder<br />
226 Boise Southern Co. Elizabeth<br />
227 Crown Zellerbach Corp. Bogalusa<br />
228 Crown Zellerbach Corp. St. Francisville<br />
229 Georgia-Pacific Corp. Port Hudson<br />
230 International Paper Co. Bastrop<br />
231 International Paper Co. Mansfield<br />
232 International Paper Co. Pineville<br />
233 International Paper Co. Springhill<br />
234 Masonite Corp. New Orleans<br />
235 Manville <strong>Forest</strong> <strong>Products</strong> Corp. West Monroe<br />
236 St. Francisville Paper Co. St. Francisville<br />
237 Stone Container Corp. Hodge<br />
238 Willamette Industries Inc. Campti<br />
Total capacity<br />
Total mills<br />
Total plants
Table A-2—Capacity of individual active U.S. woodpulp plants in 1961, 1965, 1970, and 1974, and, by type, In 1983—Continued<br />
1983<br />
Defi-<br />
Plant name Plant location 1961 1965 1970 1974<br />
3 brated/<br />
Plant<br />
number<br />
exploded<br />
Total Sulfite Sulfate 1 Groundwood2 Semichemical<br />
Stone Refiner<br />
South-Continued<br />
Mississippi<br />
239 Atlas Roofing Mfg. Co., Inc. Meridian<br />
240 Owens Corning Fiberglass Corp. Meridian<br />
241 International Paper Co. Moss Point<br />
242 International Paper Co. Natchez<br />
243 International Paper Co. Vicksburg<br />
244 Johns-Manville <strong>Products</strong> Corp. Natchez<br />
245 Kroehler Mfg. Co. of Miss. Inc. Meridian<br />
246 Leaf River <strong>Forest</strong> <strong>Products</strong> Inc. New Augusta<br />
247 Lumberton Pulp Co. Lumberton<br />
248 Masonite Corp. Laurel<br />
249 St. Regis Corp. Monticello<br />
250 <strong>United</strong> <strong>States</strong> Gypsum Co. Greenville<br />
251 Weyerhaeuser Co. Columbus<br />
Total capacity<br />
Total mills<br />
Total plants<br />
North Carolina<br />
252 Abitibi-Price Corp. Roaring River<br />
253 Celotex Corp. Goldsboro<br />
254 Champion Papers Canton<br />
255 Champion Packaging<br />
Roanoke Rapids<br />
256 Federal Paper Board Co. Riegelwood<br />
257 Georgia-Pacific Corp. Conway<br />
258 Mead Corp. Sylva<br />
259 Weyerhaeuser Co. Moncure<br />
260 Weyerhaeuser Co. New Bern<br />
261 Weyerhaeuser Co. Plymouth<br />
Total capacity<br />
Total mills<br />
Total plants<br />
Oklahoma<br />
262 Georgia-Pacific Corp. Pryor<br />
263 Weyerhaeuser Co. Broken Bow<br />
264 Weyerhaueser Co. Valliant<br />
Total capacity<br />
Total mills<br />
Total plants<br />
South Carolina<br />
265 Bowaters Carolina Corp. Catawba<br />
266 Catawba Newsprint Co. Catawba<br />
267 Celotex Corp. Sellers
Table A-2—Capacity of individual active U.S. woodpulp plants in 1961, 1965, 1970, and 1974, and, by type, In 1983—Continued<br />
1983<br />
Groundwood2<br />
Defi-<br />
Semi-<br />
3 brated/<br />
Stone Refiner<br />
chemical<br />
exploded<br />
Plant name Plant location 1961 1965 1970 1974<br />
Plant<br />
number<br />
Total Sulfite Sulfate 1<br />
South-Continued<br />
South Carolina-Continued<br />
268 Champion Building <strong>Products</strong> Catawba<br />
269 International Paper Co. Georgetown<br />
270 Sonoco <strong>Products</strong> Co. Hartsville<br />
271 Stone Container Corp. Florence<br />
272 Union Camp Corp. Eastover<br />
273 Westvaco Corp. Charleston<br />
Total capacity<br />
Total mills<br />
Total plants<br />
Tennessee<br />
274 Bowater Southern Paper Corp. Calhoun<br />
275 Celotex Corp. Paris<br />
276 Harriman Paperboard Corp. Harriman<br />
277 Inland Container Corp. New Johnsonville<br />
278 Celotex Corp. Memphis<br />
279 Mead Corp. Kingsport<br />
280 National Fibrit Springfield<br />
281 Tamko Asphalt Prods. of Tenn. Knoxville<br />
282 Tamko Asphalt Prods. of Tenn. Knoxville<br />
283 Tenn. River Pulp & Paper Co. Counce<br />
Total capacity<br />
Total mills<br />
Total plants<br />
Texas<br />
284 Celotex Corp. Houston<br />
285 Champion Papers Pasadena<br />
286 GAF Corp. Dallas<br />
287 International Paper Corp. Texarkana<br />
288 Owens-Illinois Inc. Orange<br />
289 St. Regis Paper Co. Houston<br />
290 St. Regis Paper Co. Lufkin<br />
291 Temple-Eastex Inc. Diboll<br />
292 Temple-Eastex Inc. Silsbee<br />
Total capacity<br />
Total mills<br />
Total plants<br />
Virginia<br />
293 Bear Island Paper Co. Ashland<br />
294 Chesapeake Corp. of Virginia West Point<br />
295 Stone Container Corp. Hopewell<br />
296 Georgia-Pacific Corp. Jarratt<br />
297 James River Pulp Corp. Columbia
Semi-<br />
Defibrated/<br />
chemical3<br />
exploded<br />
Table A-2—Capacity of individual active U.S. woodpulp plants In 1961, 1965, 1970, and 1974, and, by type, in 1983—Continued<br />
1983<br />
Plant<br />
number<br />
Plant name Plant location 1961 1965 1970 1974<br />
Total Sulfite Sulfate 1 Groundwood2<br />
Stone Refiner<br />
South-Continued<br />
Virginia-Continued<br />
298 Mead Corp. Lynchburg<br />
299 Owens-Illinois Inc. Big Island<br />
300 Union Camp Corp. Franklin<br />
301 <strong>United</strong> <strong>States</strong> Gypsum Co. Danville<br />
302 Virginia Fibre Corp. Riverville<br />
303 Westvaco Corp. Covington<br />
Total capacity<br />
Total mills<br />
Total plants<br />
Total capacity, South<br />
Total mills, South<br />
Total plants, South<br />
West<br />
Alaska<br />
304 Alaska Lumber & Pulp Co., Inc. Sitka<br />
305 Louisiana-Pacific Corp. Ketchikan<br />
Total capacity<br />
Total mills<br />
Total plants<br />
Arizona<br />
306 Ponderosa Paper <strong>Products</strong> Inc. Flagstaff<br />
307 Southwest <strong>Forest</strong> Industries Inc. Snowflake<br />
Total capacity<br />
Total mills<br />
Total plants<br />
California<br />
308 CertainTeed Corp. Richmond<br />
309 Genstar Building Material Co. Vernon<br />
310 Johns-Manville <strong>Products</strong> Corp. Pittsburg<br />
311 Louisiana-Pacific Corp. Antioch<br />
312 Louisiana-Pacific Corp. Rocklin<br />
313 Louisiana-Pacific Corp. Samoa<br />
314 Masonite Corp. Ukiah<br />
315 Packaging Corp. of America Red Bluff<br />
316 Simpson Paper Co. Anderson<br />
317 <strong>United</strong> <strong>States</strong> Gypsum Co. South Gate<br />
318 Simpson Paper Co. Fairhaven<br />
Total capacity<br />
Total mills<br />
Total plants
Defibrated/<br />
exploded<br />
Table A-2—Capacity of individual active U.S. woodpulp plants In 1961, 1965, 1970, and 1974, and, by type, in 1983—Continued<br />
1983<br />
Plant<br />
number<br />
Plant name Plant location 1961 1965 1970 1974<br />
Total Sulfite Sulfate 1 Groundwood2<br />
Semi-<br />
Stone Refiner chemical3<br />
West—Continued<br />
Colorado<br />
319 Packaging Corp. of America Denver<br />
Total capacity<br />
Total mills<br />
Total plants<br />
Idaho<br />
320 Potlatch Corp. Lewiston<br />
Total capacity<br />
Total mills<br />
Total plants<br />
Montana<br />
321 Champion Packaging Missoula<br />
Total capacity<br />
Total mills<br />
Total plants<br />
New Mexico<br />
322 Dura Roofing Manufacturers Albuquerque<br />
Total capacity<br />
Total mills<br />
Total plants<br />
Oregon<br />
323 Boise Cascade Corp. Salem<br />
324 Boise Cascade Corp. St. Helens<br />
325 Champion Building <strong>Products</strong> Dee<br />
326 Champion Building <strong>Products</strong> Lebanon<br />
327 Coos Head Timber Co. Coos Bay<br />
328 Crown Zellerbach Corp. Clatskanie<br />
329 Crown Zellerbach Corp. Lebanon<br />
330 Crown Zellerbach Corp. West Linn<br />
331 Evans <strong>Products</strong> CO. Corvallis<br />
332 <strong>Forest</strong> Fiber <strong>Products</strong> Co. <strong>Forest</strong> Grove<br />
333 Georgia-Pacific Corp. Coos Bay<br />
334 Georgia-Pacific Corp. Toledo<br />
335 International Paper Co. Gardiner<br />
336 James River-Dixie/Northern Halsey<br />
337 Owens-Corning Fiberglas Corp. St. Helens<br />
338 Publishers Paper Co. Newberg<br />
339 Publishers Paper Co. Oregon City
DefiSemibrated/<br />
chemical3<br />
exploded<br />
Table A-2—Capacity of individual active U.S. woodpulp plants in 1961, 1965, 1970, and 1974, and, by type, in 1983—Continued<br />
1983<br />
Plant name Plant location 1961 1965 1970 1974<br />
number<br />
Total Sulfite Sulfate 1<br />
Plant<br />
Groundwood<br />
Stone Refiner 2<br />
West-Continued<br />
Oregon-Continued<br />
340 <strong>United</strong> <strong>States</strong> Gypsum Co. Pilot Rock<br />
341 Weyerhaeuser Co. Klamath Falls<br />
342 Weyerhaeuser Co. Springfield<br />
343 Weyerhaeuser West Coast Inc. North Bend<br />
344 Willamette Industries Inc. Albany<br />
Total capacity<br />
Total mills<br />
Total plants<br />
Washington<br />
345 Boise Cascade Co. Steilacoom<br />
346 Boise Cascade Corp. Vancouver<br />
347 Boise Cascade Corp. Wallula<br />
348 Crown Zellerbach Corp. Camas<br />
349 Crown Zellerbach Corp. Port Angeles<br />
350 Crown Zellerbach Corp. Port Townsend<br />
351 Fibreboard Corp. Port Angeles<br />
352 Georgia-Pacific Corp. Bellingham<br />
353 Inland Empire Paper Co. Millwood<br />
354 International Paper Co. Longview<br />
355 ITT Rayonier Inc. Hoquiam<br />
356 ITT Rayonier Inc. Shelton<br />
357 ITT Rayonier Inc. Port Angeles<br />
358 Keyes Fibre Co. Wenatchee<br />
359 Longview Fibre Co. Longview<br />
360 North Pacific Paper Corp. Longview<br />
361 Publishers <strong>Forest</strong> <strong>Products</strong> Co. Anacortes<br />
362 Scott Paper Co. Anacortes<br />
363 Scott Paper Co. Everett<br />
364 Simpson Lee Paper Co. Everett<br />
365 Simpson Timber Co. Shelton<br />
366 St. Regis Paper Co. Tacoma<br />
367 Washington Pulp & Timber Co. Longview<br />
368 West Tacoma Newsprint Co. West Tacoma<br />
369 Weyerhaeuser Co. Cosmopolis<br />
370 Weyerhaeuser Co. Everett<br />
371 Weyerhaeuser Co. Longview
Table A-2—Capacity of individual active U.S. woodpulp plants in 1961, 1965, 1970, and 1974, and, by type, in 1983—Continued<br />
1983<br />
Plant<br />
Plant name Plant location 1961 1965 1970 1974<br />
Groundwood2<br />
Definumber<br />
1 Semi-<br />
Total Sulfite Sulfate brated/<br />
Stone Refiner chemical3<br />
exploded<br />
Washington-Continued<br />
Total capacity<br />
Total mills<br />
Total plants<br />
Total capacity, West<br />
Total mills, West<br />
Total plants, West<br />
Total capacity, <strong>United</strong> <strong>States</strong><br />
Total mills, <strong>United</strong> <strong>States</strong><br />
Total plants. <strong>United</strong> <strong>States</strong><br />
1 Sulfate includes soda pulp mills.<br />
mills.<br />
pulp<br />
thermomechanical<br />
includes<br />
groundwood<br />
2 Refiner<br />
3 Semichemical includes chemiground and chemimechanical pulp mills.<br />
4 Excludes capacity of idle mill(s) at this location.<br />
5 Excludes capacity of planned or under construction mill(s) at this location.<br />
6 Mill idle, excluded from totals.<br />
7 Mill planned or under construction, excluded from totals.<br />
Sources: Lockwood Publishing Co., Inc. (1966, 1971, 1968, 1973)<br />
McKeever, David B. (1977)<br />
Miller Freeman Publications, Inc. (1983)<br />
U.S. Department of Agriculture (1961, 1966)<br />
Vance Publishing Corp. (1994)
Table A-3—Number and capacity of active U.S. woodpulp mills in each region in selected years<br />
Northeast North Central South West<br />
Year Capacity Capacity Capacity Capacity<br />
Number Number Number Number<br />
Total Average Total Average Total Average Total Average<br />
‘Includes idle mills, and mills under construction.<br />
Sources: Lockwood Publishing Co., Inc. (1966, 1971, 1968, 1973)<br />
McKeever, David B. (1977)<br />
Miller Freeman Publications, Inc. (1983)<br />
U.S. Department of Agriculture, <strong>Forest</strong> Service (1961, 1965)<br />
Vance Publishing Corp. (1984)
Defibrated/exploded<br />
(P/C)<br />
3<br />
Groundwood Semichemical<br />
2<br />
Sulfate 1<br />
Table A-4—Annual U.S. woodpulp mill capacity, woodpulp production, and production as a percentage of capacity for different grades of pulp in selected<br />
years<br />
Dissolving/special alpha<br />
Sulfite<br />
Year Capacity Production Ratio Capacity Production Ratio Capacity Production Ratio Capacity Production Ratio Capacity Production Ratio Capacity Production Ratio<br />
(C) (P) (P/C) (C) (P) (P/C) (C) (P) (P/C) (C) (P) (P/C) (C) (P) (P/C) (C) (P)<br />
1 lncludes soda pulp.<br />
2 Includes thermomechanical pulp.<br />
3 lncludes screenings and estimates of hard pressed board mill capacity.<br />
4 Included in sulfite.<br />
dissolving/special alpha pulp.<br />
5 lncludes<br />
pulp.<br />
defibrated/exploded<br />
6 lncludes<br />
groundwood.<br />
in<br />
7 Included<br />
Sources: American Paper Institute (1983, 1984, 1984b)<br />
McKeever, David B. (1977)<br />
U.S. Department of Agriculture, <strong>Forest</strong> Service (1961, 1965)<br />
U.S. Department of Commerce, Bureau of the Census (1983, 1985)<br />
<strong>United</strong> <strong>States</strong> Pulp Producers Assoc., Inc. (1956, 1961)
Table A-5—Annual U.S. woodpulp production, pulpwood consumption, and consumption per unit of production for different<br />
grades of pulp in selected years<br />
Pulpwood Pulpwood Pulpwood<br />
consumption<br />
consumption<br />
consumption<br />
Year<br />
1<br />
2<br />
3<br />
4<br />
5<br />
6<br />
7<br />
8<br />
woodpulp<br />
woodpulp<br />
woodpulp<br />
production Per ton production Per ton production Per ton<br />
Total of pulp Total of pulp Total of pulp<br />
produced produced produced<br />
Note: Numbers in parentheses are included with other pulp types as indicated. Sources: American Paper Institute (1983, 1984, 1984b)<br />
Includes soda pulp for the years 1950-80.<br />
McKeever, David B. (1977)<br />
U.S. Department of Agriculture, <strong>Forest</strong> Service<br />
lncludes soda pulp for the years 1981-83.<br />
(1961, 1965)<br />
lncluded in sulfate. U.S. Department of Commerce, Bureau of<br />
Includes dissolving/special alpha pulp. the Census (1983,1985)<br />
Includes thermomechanical pulp.<br />
<strong>United</strong> <strong>States</strong> Pulp Producers Assoc., Inc. (1956, 1961)<br />
lncludes screenings.<br />
Includes semichemical, defibrated/exploded, and screening pulps.<br />
lncluded in groundwood.<br />
26
Table A-6.—Annual U.S. production of pulpwood of different types in selected years<br />
Total Roundwood<br />
Year<br />
Plant<br />
pulpwood<br />
by-products<br />
production Total Softwood Hardwood<br />
1 Preliminary.<br />
Table A-7—Annual U.S. woodpulp production, imports, exports,<br />
and apparent domestic consumption, selected years<br />
1920-83<br />
Domestic<br />
Apparent<br />
Year<br />
imports Exports<br />
production<br />
domestic<br />
1 Production + imports - exports.<br />
2 Preliminary.<br />
Sources: Ulrich, Alice H. (1985)<br />
<strong>United</strong> <strong>States</strong> Pulp Producers Assoc., Inc. (1961)<br />
consumption 1<br />
U.S. GOVERNMENT PRINTING OFFICE:1987-742-044/40013<br />
Sources: Hair, Dwight and Ulrich, Alice H. (1964)<br />
Ulrich, Alice H. (1985)<br />
27
Figure A-1—Location, daily capacity and type of woodpulp plants in<br />
different regions of the <strong>United</strong> <strong>States</strong> in 1983.<br />
28
2.0-2/87