test in Lac du Bonnet granite - Civil Engineering - University of Toronto
test in Lac du Bonnet granite - Civil Engineering - University of Toronto
test in Lac du Bonnet granite - Civil Engineering - University of Toronto
- No tags were found...

You also want an ePaper? Increase the reach of your titles
YUMPU automatically turns print PDFs into web optimized ePapers that Google loves.
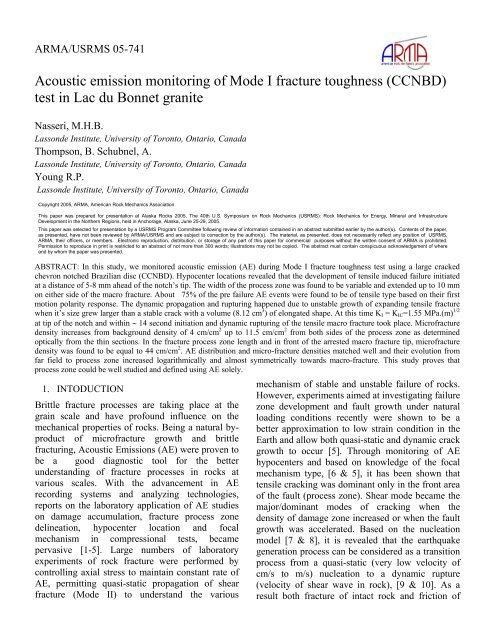
CCNBD <strong>of</strong> <strong>Lac</strong> <strong>du</strong> <strong>Bonnet</strong> <strong>granite</strong>. The rock sample(diameter=20 cm, thickness=5.1cm) is fromCanada's Underground Research Laboratory wherethe concept <strong>of</strong> deep radioactive waste disposal isbe<strong>in</strong>g studied. This CCNBD <strong>test</strong> was designed tomeasure the fracture toughness at the tip <strong>of</strong> a “V”-shaped notch as well as the AE response to the<strong>in</strong>itiation and propagation <strong>of</strong> tensile fractur<strong>in</strong>g, (Fig.1).Fig. 1. The CCNBD specimen <strong>of</strong> <strong>Lac</strong> <strong>du</strong> <strong>Bonnet</strong> <strong>granite</strong> <strong>in</strong> aMTS load<strong>in</strong>g frame with 20 trans<strong>du</strong>cers attached to it for 3DAE coverage.Ultrasonic data was recorded on 16 channels,sampled at 10 MHz. Each triggered event consists<strong>of</strong> 4096 sample po<strong>in</strong>ts, equat<strong>in</strong>g to a 0.2 ms timeperiod. The hardware has the potential to capture 20AE events per second and experiencesapproximately 50 ms <strong>of</strong> record<strong>in</strong>g downtime afterevery event, when the AE data is written to the PC.The Giga RAM Recorder was designed <strong>in</strong> responseto this downtime limitation. Ultrasonic waveformsare recorded cont<strong>in</strong>uously onto the 40 GB RAM,which when full, beg<strong>in</strong>s to overwrite the oldest data.Therefore the RAM always conta<strong>in</strong>s the previous268.4 seconds <strong>of</strong> ultrasonic waveforms, which canbe saved for later download at any time. Therecorded ultrasonic signals passed through external20 dB pre-amplifiers (PAC model 1220A). Threechannels i.e. 11, 13 and 15 were amplified at 40 dB<strong>in</strong> order to be able to record higher amplitude events<strong>du</strong>r<strong>in</strong>g the <strong>test</strong>. (see conceptual diagram, figure 2).Four transmitters were dedicated as active sourcesfor velocity surveys and excited us<strong>in</strong>g aPanametrics 5072PR transmitter box. An ESG<strong>in</strong>terface box switched between the fourtransmitters. The signal to noise ratio was improvedby stack<strong>in</strong>g. In this study we are not report<strong>in</strong>g onthe velocity survey results obta<strong>in</strong>ed <strong>du</strong>r<strong>in</strong>g load<strong>in</strong>g<strong>of</strong> specimen.The displacement, force and time base <strong>of</strong> theexperiment were recorded with MTS TesStars<strong>of</strong>tware us<strong>in</strong>g another PC. Both the PCs weresynchronized through a GPS system.2.2. Sample preparation for fracture toughness<strong>test</strong>A special large fixture was designed and fabricatedat the workshop <strong>of</strong> department <strong>of</strong> civil eng<strong>in</strong>eer<strong>in</strong>g,<strong>University</strong> <strong>of</strong> <strong>Toronto</strong> which helped to ensure thatthe chevron notches are exactly <strong>in</strong> the centre <strong>of</strong> thedisc and the geometrical dimensions conform to thegiven tolerance. A circular diamond saw was usedto cut the required notch. <strong>Lac</strong> <strong>du</strong> <strong>Bonnet</strong> <strong>granite</strong>showed strong anisotropy once wave velocitieswere measured along various directions beforemach<strong>in</strong><strong>in</strong>g the notches <strong>in</strong> the specimen. Figure 3shows the direction <strong>of</strong> measured wave velocitiesprior to notch and the results are tabulated <strong>in</strong> thetable <strong>of</strong> the same figure. The wave velocitymeasured along AA’ l<strong>in</strong>e be<strong>in</strong>g around 5290 m/swas found to be the fas<strong>test</strong> direction and EE’ wasfound to be 4550 m/s. Wave velocity measurementsus<strong>in</strong>g puls<strong>in</strong>g method and lead break method wasused for sensor location calibration prior to <strong>test</strong><strong>in</strong>g.Transversally isotropic model with P- wave velocity<strong>of</strong> 4800 m/s <strong>in</strong> the notch direction and anisotropyratio <strong>of</strong> 0.75 was set for slow direction, <strong>in</strong> responseto velocity measured perpendicular to the notchorientation. Tak<strong>in</strong>g <strong>in</strong>to account the sensor thatprovide the best 3D coverage around notch A, thelocation error was found to be around 3 mm. Thegeometry <strong>of</strong> CCNBD is illustrated <strong>in</strong> Figure 4 and<strong>in</strong> table 1. ISRM suggested method [19], was usedto prepare a large size (diameter=20 cm,thickness=5.1 cm) cracked chevron notchedBrazilian disc. The advantage <strong>of</strong> this method is thecore axis can be oriented to any direction withrespect to any anisotropy features such as planes <strong>of</strong>weakness or preferred micro-fractures. The fracturetoughness (K IC ) <strong>of</strong> the specimen shall be calculatedby the follow<strong>in</strong>g formula:
Ultrasonic WaveformsPre-AmpsDiscreteTriggeredDataGiga Recorder20 AE eventsPer secondPCSampleCont<strong>in</strong>uousDataRecord1 x 260SecondFig. 2. Conceptual diagram <strong>of</strong> experimental set up used to record ultrasonic data, (active source for velocity surveys not shown).Scan L<strong>in</strong>eA-AB-BC-CD-DE-EF-FH-HG-GA -AVelocitym/s529051705190470045504640499050705300BAGCHDFE E ’F ’D ’H ’C ’G ’B ’A ’Y = µ e(2)*. α1m<strong>in</strong>.υwhere µ and ν are constants determ<strong>in</strong>ed by α 0 , α Bonly us<strong>in</strong>g a separate table.Y*m<strong>in</strong>= Critical dimension less <strong>in</strong>tensity valueP max =maximum load at failureAll the dimensions <strong>of</strong> the geometry should beconverted <strong>in</strong>to dimensionless parameter withrespect to the specimen radius R and diameter D asshown <strong>in</strong> table 1.Fig.3 Anisotropic wave velocity measured <strong>in</strong> <strong>Lac</strong> <strong>du</strong> <strong>Bonnet</strong><strong>granite</strong>.Pmax *K IC= Ym<strong>in</strong>(1)whereBRTable 1. CCNBD geometrical dimensions <strong>in</strong> this <strong>test</strong>DescriptionsDiameter D (mm)Thickness B (mm)Initial cracklength a o (mm)F<strong>in</strong>al crack lengtha 1 (mm)Saw diameter D s(mm),Y*m<strong>in</strong>(dimensionless)Valuesmm194.851.1016.6756.08147.40.76Dimensionlessexpressionα B =B/R = 0.52α 0 =a o /R= 0.17α 1 =a 1 /R=5.75α S =D s /D= 0.75Fig. 4. The CCNBD specimen geometry with recommended<strong>test</strong> fixture.
2.3 Microstructural InvestigationMicrocrack observational techniques <strong>in</strong>clude 1) dyepenetration prior to th<strong>in</strong> section preparation, 2)radiography and X-ray, 3) SEM and 4) TEM, [20].In recent years development <strong>of</strong> computer aidedimage analysis programs has greatly facilitatedmicrostructural characterization through analysis <strong>of</strong>digital images obta<strong>in</strong>ed from the th<strong>in</strong> sections, [1,21, & 22]. These techniques are based on directmeasurements <strong>of</strong> crack length, orientation, gra<strong>in</strong>size and shape measurements from th<strong>in</strong> sections.These methods provide easier handl<strong>in</strong>g <strong>of</strong> largeramount <strong>of</strong> data collected and therefore provide amore representative assessment <strong>of</strong> microstructuralproperties. Six large th<strong>in</strong> sections (7cmx5cm)perpendicular to the fault trace were prepared fromeach notch. About 70 digital images taken fromeach th<strong>in</strong> section were tiled together. In this studyonly the result <strong>of</strong> one th<strong>in</strong> section from each zone(notch A, notch B and far field) is shown.Micr<strong>of</strong>racture density and mean orientation weremeasured from notch A and B and compared withfar-field micr<strong>of</strong>racture densities obta<strong>in</strong>ed from th<strong>in</strong>sections prepared from the edge and far from theload<strong>in</strong>g area. Microstructural properties such asmicr<strong>of</strong>racture densities, orientation, micr<strong>of</strong>racturelength and width were measured to evaluate thedimension <strong>of</strong> the process zone.3. EXPERIMENTAL RESULTIn this paper the AE data for only one <strong>of</strong> the notch<strong>in</strong> CCNBD, i.e. notch A (the one <strong>in</strong> contact withmov<strong>in</strong>g platen) is analyzed to present hypocenterlocation and focal mechanism based on first pulsemotions polarities. In all about 2500 events werestored <strong>in</strong> the Giga recorder which was first autoprocessed for their temporal and special analysis. Inorder to m<strong>in</strong>imize the hypocenter errors only six toeight trans<strong>du</strong>cers which were found to have the best3D coverage around notch “A” were used tomanually locate about 350 events <strong>du</strong>r<strong>in</strong>g pre to postfailure time period. However micr<strong>of</strong>racture analysis<strong>in</strong>volves both the notches. With the sudden drop <strong>of</strong>the load at failure the <strong>test</strong> was term<strong>in</strong>ated and as aresult fracture propagation was seized <strong>in</strong> somesection close to the edge <strong>of</strong> notch B, as confermentlater by th<strong>in</strong> section studies. This provided a rareopportunity to study the fracture process zonelength <strong>in</strong> front <strong>of</strong> the tip <strong>of</strong> the propagat<strong>in</strong>g macr<strong>of</strong>racture.3.1. Hypocenter distribution and fracture growthFigure 5(a) reveals the variation <strong>of</strong> all the AE hitsper second and force versus time <strong>of</strong> load<strong>in</strong>g for theCCNBD <strong>of</strong> <strong>Lac</strong> <strong>du</strong> <strong>Bonnet</strong> <strong>granite</strong> recorded fromboth notches. Stress <strong>in</strong>tensity factor at the criticalload lead<strong>in</strong>g to the failure was measured us<strong>in</strong>gISRM suggested method [19], is shown <strong>in</strong> thefigure. Cumulative detected number <strong>of</strong> AE eventsand load versus time is shown <strong>in</strong> 5 (b). Loaddisplacement graph is shown <strong>in</strong> figure 5(c) wheremaximum displacement at peak strength wasrecorded to be 0.28 mm.A close up w<strong>in</strong>dow <strong>of</strong> various stages <strong>of</strong> failurebased on maximum AE heat/s recorded at differentstations around the notches is demonstrated <strong>in</strong>figure 5(d). The evolution <strong>of</strong> AE events and theirlocations with time <strong>du</strong>r<strong>in</strong>g tensile fracture <strong>in</strong>itiationand propagation at various phases <strong>in</strong> notch A isdemonstrated <strong>in</strong> Fig.7.3.2. Fault growth stages3.2.1. Stage A:Except few isolated events were located <strong>in</strong> thebeg<strong>in</strong>n<strong>in</strong>g <strong>of</strong> the <strong>test</strong>, but the first noticeable eventsat this stage is related to a l<strong>in</strong>ear and progressivemicr<strong>of</strong>racture <strong>in</strong>itiat<strong>in</strong>g at a distance <strong>of</strong> about 5mmahead <strong>of</strong> the tip <strong>of</strong> the notch extend<strong>in</strong>g up to alength <strong>of</strong> 14 mm. This corresponds to an area <strong>of</strong>about 50 mm 2 (10.5 mm x 4.7 mm) <strong>of</strong> rectangularshape. This period starts from time 553 th secondsand cont<strong>in</strong>ues till the end <strong>of</strong> 562th seconds(15:41:30 to 15: 41:39), as shown <strong>in</strong> figures 5(d)and 6 (Stage A). The load rises at the displacementrate <strong>of</strong> 0.0005 mm/s to 32.02 KN and stress<strong>in</strong>tensity factor (K I ) measured at the tip <strong>of</strong> the “Vshaped”notch reaches up to 1.48 MPa.m 1/2 which is95% <strong>of</strong> the sample’s fracture toughness. At this load0.267 mm <strong>of</strong> displacement (<strong>in</strong>built MTS load<strong>in</strong>gmach<strong>in</strong>e’s LVDT) is atta<strong>in</strong>ed which is also 95% <strong>of</strong>ultimate displacement before failure. Total number<strong>of</strong> AE events located manually around the tip andthe plane conta<strong>in</strong><strong>in</strong>g the notch is about 13 events.3.2.2. Stage B:This period extended from 562 th second to 563 thsecond where load <strong>in</strong>crease to 32.32 KN anddisplacement measured is <strong>of</strong> the order <strong>of</strong> 0.278 mm.Calculated KI at this load was found to be 1.52
(a)(b)(C)(d)Fig. 5. (a) Applied load and AE hits/second versus time, fracture toughness value for critical stress <strong>in</strong>tensity factor is marked <strong>in</strong> thefigure. (b) Applied load and cumulative AE versus time, (c) Variation <strong>of</strong> load with displacement for CCNBD at failure and (d) Aclose up w<strong>in</strong>dow <strong>of</strong> Load and AE hits (sensed at various locations ) versus time for fracture <strong>in</strong>itiation and dynamic failureMPa.m 1/2 (97.7% <strong>of</strong> critical stress <strong>in</strong>tensity factor).Total <strong>of</strong> 40 localized AE events were located <strong>in</strong> thisperiod mark<strong>in</strong>g almost same rectangular shapedarea advanc<strong>in</strong>g about another 5 mm outwardstowards the load<strong>in</strong>g edge <strong>of</strong> the specimen (Fig. 6,stage B). From AE density map it can be <strong>in</strong>ferredthat AE concentration <strong>in</strong>creases at a distance <strong>of</strong> 10mm from the fracture tip extend<strong>in</strong>g for 12 mml<strong>in</strong>early outwards towards the region where thenotch ends at the base <strong>of</strong> the wedge. Still fracture isgrow<strong>in</strong>g quasi-statically at this stage and rema<strong>in</strong>sstable.3.2.3. Stage C:This period extended for four seconds start<strong>in</strong>g from563 th to 567 th second when load is <strong>in</strong>creased to amaximum level <strong>of</strong> 32.72 KN and stress <strong>in</strong>tensityfactor, K I atta<strong>in</strong>s highest value <strong>of</strong> 1.55 MPa.m 1/2becom<strong>in</strong>g equal to the fracture toughness, K IC <strong>of</strong><strong>Lac</strong> <strong>du</strong> <strong>Bonnet</strong> <strong>granite</strong>. Highest displacement <strong>of</strong>0.28 mm is experienced at this failure po<strong>in</strong>t. As it isclear from the spatial occurrence <strong>of</strong> 93 AE eventsand its calculated density <strong>in</strong> figure 6 stage C, whenfracture propagates laterally <strong>in</strong> all directionsunstably. Figure 6 illustrates various stages <strong>of</strong>temporal and spatial fracture evolution along twoplanes <strong>of</strong> XZ and XY i.e. parallel and perpendicularto fracture propagation directions respectively. Thefracture propagates unstably and dynamically themoment the stress <strong>in</strong>tensity factor, K I reaches K ICand the length <strong>of</strong> the grow<strong>in</strong>g fracture and the area<strong>in</strong>volved exceeds its stable conditions. It is evidentfrom the added widely distributed numerous AEevents at this stage that micr<strong>of</strong>racture <strong>in</strong>teractionand coalescence was facilitat<strong>in</strong>g unstable growth <strong>of</strong>the fracture ma<strong>in</strong>ly under tensile mode.3.2.4. Stage D:This stage is characterized by a sudden drop <strong>of</strong> loadas quasi-statically stable fracture propagation leadsto unstable dynamic fracture propagation. The loaddrops from 32.72 to 21.6 KN <strong>in</strong> a period <strong>of</strong> timebetween 568th second to 570 th second i.e. from time15:41:43 to 15:41:45. At this stage71 AE events arerecorded from similar areas to previous stage asrevealed by AE density couture map. This stage canbe considered as the beg<strong>in</strong>n<strong>in</strong>g <strong>of</strong> the post failurezone as well. Generally it is sited that AE
hypocenter distribution reflects directly thedistribution <strong>of</strong> crack<strong>in</strong>g <strong>in</strong> rock under stress. In thisstudy AE density maps (Fig. 6) are used to study thefracture <strong>in</strong>itiation and propagation from the tip <strong>of</strong> anotch <strong>in</strong> its own plane with a process zone <strong>of</strong><strong>in</strong>tense crack<strong>in</strong>g. The time <strong>in</strong>terval between earlyappearance <strong>of</strong> AE close to the notch tip and furtherprogression <strong>of</strong> fracture front and later on f<strong>in</strong>alfractur<strong>in</strong>g was approximately 14 seconds. Migration<strong>of</strong> the front <strong>of</strong> rapidly <strong>in</strong>creas<strong>in</strong>g crack<strong>in</strong>g along thefailure plane prior to the dynamic rupture can beconsidered as quasi-static rupture velocity [5 & 6].us<strong>in</strong>g similar approach it was found that fracturenucleation <strong>in</strong> front <strong>of</strong> the notch grew to 2.8 cm/sand reached approximately a volume <strong>of</strong> 6.5 cm 2 x1.25 cm = 8.12 cm 3 quasi-statically before itpropagate dynamically <strong>in</strong> stage B. At this levelstress <strong>in</strong>tensity factor became 97.7% <strong>of</strong> its criticalvalue. In stage C fracture front extends dynamicallyat much faster rate laterally and towards the edge <strong>of</strong>the specimen. It is also noticed from figure 5(d)that the maximum AE activities are recorded atcouple <strong>of</strong> channels <strong>in</strong> middle <strong>of</strong> stage C, <strong>in</strong>dicatedas well by AE density map from entire failure plane(XZ) where the fault reached the edge <strong>of</strong> thesample, yet the dynamic rupture happens <strong>in</strong> themiddle <strong>of</strong> stage D, about 2 second latter. It isevident from the AE density couture pattern that<strong>du</strong>r<strong>in</strong>g this time <strong>in</strong>terval, <strong>in</strong>tense crack<strong>in</strong>g tookplace from the area where triangular wedge shapednotch ends. Rupture <strong>of</strong> larger volume <strong>of</strong> rock i.e.21.3 cm 2 x 1.2 cm = 26 cm 3 , (process zonecalculated from the AE distribution andmicr<strong>of</strong>racture density <strong>of</strong> the larger rectangular zone)takes place at stages C and D.3.2.4. Stage E:Stage E start<strong>in</strong>g after the ma<strong>in</strong> rupture <strong>of</strong> the notchA and marks the beg<strong>in</strong>n<strong>in</strong>g <strong>of</strong> the post failureactivity. This stage starts m<strong>in</strong>ute shear failure as thefailed surfaces slide past each other. Figure 6 (stageD), shows the spatial distribution <strong>of</strong> the AE eventsand its density map from this stage. Cluster<strong>in</strong>g <strong>of</strong>the AE events happens to be from the same areawhere maximum fractur<strong>in</strong>g was experienced <strong>in</strong>previous stage. Figure 6 (stages A), shows thecumulative AE events and its density maprepresent<strong>in</strong>g all the events from the beg<strong>in</strong>n<strong>in</strong>g <strong>of</strong> the<strong>test</strong> till the end <strong>of</strong> the stage E. The highest densityloci were found to cover an area <strong>of</strong> 19.3mm X 13.18mm at a distance <strong>of</strong> 18 mm from the fracture tip.5. FOCAL MECHANISMFor manually located 220 AE events occurr<strong>in</strong>g up tothe end <strong>of</strong> stage D, i.e. before receiv<strong>in</strong>g post failureevents, focal mechanism based on first motionpolarity was calculated [4]. Us<strong>in</strong>g similar methodAE events manually located (135 events) from stageE i.e. post failure events have been calculate to f<strong>in</strong>dout if these two sets <strong>of</strong> events could bediscrim<strong>in</strong>ated based on their focal mechanism. Thepolarity value <strong>of</strong> a s<strong>in</strong>gle event is calculated by:K1iPol = ∑ sign(A1)(3)Ki=1where K is number <strong>of</strong> channels used for hypocenterdeterm<strong>in</strong>ation. In this analysis based on pencil leadbreak and artificial pulses used for sensor positioncalibration, compressional pulses are characterizedwith positive polarity. Analysis <strong>of</strong> pre failure events(220 events) revealed that 75% <strong>of</strong> the total events(159 events) are <strong>of</strong> tensile type as their polarityvaried <strong>in</strong> the range <strong>of</strong> 0.25< Pol ≤1. 15% <strong>of</strong> the totalevents were found to be <strong>of</strong> shear type with theirpolarity vary<strong>in</strong>g <strong>in</strong> the range <strong>of</strong> 0.25≤ Pol≤-0.25.The rest (10%) had their polarity <strong>in</strong> the range <strong>of</strong> -0.25 ≤ Pol ≤ -1, believed to be <strong>of</strong> implosion type.On the contrary first motion polarity analysis <strong>of</strong> thepost failure events (134 events) reveals the fact that40% <strong>of</strong> the events are <strong>of</strong> shear type versus only 39%<strong>of</strong> tensile type. 15% prove to be <strong>of</strong> implosion type.6. PROCESS ZONE AND FAR FIELDMICROFRACTURE ANALYSISThe fracture process zone (FPZ) <strong>in</strong> rocks is def<strong>in</strong>edas the region affected by microcrack<strong>in</strong>g andfrictional slip surround<strong>in</strong>g the visible crack tippropagat<strong>in</strong>g under stress, [13 & 16]. The width <strong>of</strong>FPZ is def<strong>in</strong>ed as the longest distance betweenvisible cracks on either side <strong>of</strong> the macro-fractureand/or fault and it’s length is def<strong>in</strong>ed as the lengthbetween the fault tip and the crack with the grea<strong>test</strong>distance <strong>in</strong> front <strong>of</strong> the fault tip.
YZXXStage A: 15:41:30 to 15:41 39, 13 eventsStage B: 15:41:39 to 15:41: 41, 40 eventsStage C: 15:41:40 to 15:41: 43, 93 eventsStage D: 15:41:43 to 15:41 45, 71 events(a)Stage E: 15:41:45 to 15:42 08, 135 eventsAE densityStage A to D, 15:40:35 to 15:41:45, 220 events10 mmLocation magnitudeFig 6. Hypocenter locations <strong>of</strong> 350 AE (dots) and their density maps shown <strong>du</strong>r<strong>in</strong>g various stages <strong>of</strong> brittle fractur<strong>in</strong>g as stress<strong>in</strong>tensity factor KI reaches its critical value <strong>of</strong> fracture toughness at the tip <strong>of</strong> notch A <strong>in</strong> <strong>Lac</strong> <strong>du</strong> <strong>Bonnet</strong> <strong>granite</strong>.
6.1. Micro-structural data form Notch A:Figure 7 shows the mapped macro-fracturedeveloped <strong>in</strong> front <strong>of</strong> the notch with smallerfractures close to it and away from it. Grey <strong>Lac</strong> <strong>du</strong><strong>Bonnet</strong> <strong>granite</strong> is relatively large a gra<strong>in</strong> <strong>granite</strong>with gra<strong>in</strong> size <strong>of</strong> 1-10 mm. The width <strong>of</strong> thefracture process zone optically evaluated form theth<strong>in</strong> section was found to be around 20-25 mm andthe orig<strong>in</strong>al length <strong>of</strong> the macro-fracture is 85 mm.Cumulative AE events (Stages A_E <strong>in</strong> Fig. 6) aresuperimposed on this th<strong>in</strong> section wheremicr<strong>of</strong>racture and macro fractures have beenmapped. It was not possible to observe the length <strong>of</strong>the fracture process zone as the macro fracture <strong>in</strong>this notch has reached the edge <strong>of</strong> the specimenalong its plane <strong>of</strong> propagation. But the length <strong>of</strong>FPZ based on AE event location density map wasfound to be around 8 mm from the tip <strong>of</strong> the notch(state A <strong>in</strong> Fig.6). Mov<strong>in</strong>g towards the macr<strong>of</strong>racture,micr<strong>of</strong>racture density <strong>in</strong>creases from abackground value <strong>of</strong> 4.7 cm/cm 2 up to 10.7 cm/cm 2<strong>in</strong> the red box on either side <strong>of</strong> macro-fracture. Themicr<strong>of</strong>racture density comparison and theirorientations (rose diagram) measured from differentarea is shown <strong>in</strong> figure 8. The orientation anddensity analysis <strong>of</strong> microcracks were carried outsystematically parallel to the direction <strong>of</strong> macr<strong>of</strong>ractureat <strong>in</strong>crements <strong>of</strong> 2.5 mm width mov<strong>in</strong>goutward from the micro-fracture trace towards theouter edge <strong>of</strong> the th<strong>in</strong> section. In figure 8 the spatialanalysis <strong>of</strong> micr<strong>of</strong>racture density and orientation isillustrated. Far field micro-fracture orientation ismarked by several maxima <strong>in</strong> various orientationswhereas micr<strong>of</strong>ractures with<strong>in</strong> the process zonedemonstrate a s<strong>in</strong>gle maximum parallel to themacro fracture direction.6.2. Micro- structural data from notch BThe background fracture density be<strong>in</strong>g around 4cm/cm 2 <strong>in</strong>creases to 11 cm/cm 2 <strong>in</strong> the process zone.Fracture propagation was seized <strong>in</strong> some sectionclose to the edge <strong>of</strong> notch B as the <strong>test</strong> wasterm<strong>in</strong>ated after sudden drop <strong>of</strong> load from 34 KN to20 KN. This provided a rare opportunity to studythe fracture process zone length <strong>in</strong> front <strong>of</strong> the tip <strong>of</strong>the arrested macro-fracture (Fig. 9). In the fractureprocess zone length, micr<strong>of</strong>racture density wasfound to be equal to 44 cm/cm 2 which is <strong>in</strong>agreement with former process zone length fracturedensity studies [1]. Substantial <strong>in</strong>crease <strong>of</strong> themicr<strong>of</strong>racture density observed at the tip <strong>of</strong> anarrested macro fracture is expla<strong>in</strong>ed [23]. Theymentioned that dissipation <strong>of</strong> fracture energy nearthe tip <strong>of</strong> a crack com<strong>in</strong>g to end makes local stressesnear <strong>in</strong>homogeneities (<strong>in</strong> this case such as preexist<strong>in</strong>g micro fractures <strong>in</strong> quartz) more important.As a result the crack beg<strong>in</strong>s to ramify, thus creat<strong>in</strong>ga fractal structures that consumes larger energy andeventually gets arrested. Micr<strong>of</strong>racture orientationanalysis <strong>of</strong> the FPZ and FPZL <strong>in</strong> notch B <strong>in</strong>dicatesdouble maxima with one maximum parallel to ma<strong>in</strong>fracture and the other one orientated at an angle <strong>of</strong>25 degrees form it. Far field micro-fractureorientation analysis is marked by several maximaoriented at various orientations.7. MICROFRACTUE DENSITIES COMPAREDTO AE DATAFigure 10 shows the micr<strong>of</strong>racture density and AEnumber plotted versus the distance to the macr<strong>of</strong>racture trace. This plot is prepared based on similar<strong>in</strong>cremental distribution <strong>of</strong> micr<strong>of</strong>racture densityand AE number as a function <strong>of</strong> distance from themacro fracture trace l<strong>in</strong>e. Logarithmic trend <strong>of</strong><strong>in</strong>crease <strong>in</strong> densities <strong>of</strong> micro-fracture and AEevents conf<strong>in</strong>ed to the immediate surround<strong>in</strong>gs <strong>of</strong>the macro-facture is evident form the figure. Thenumber <strong>of</strong> AE drops <strong>of</strong>f with distance to zero level<strong>in</strong> the background micro-fracture.8. DISCUSSIONAcoustic emission localization and micr<strong>of</strong>racturedensity analysis has been commonly used as adiagnostic tool for characterization <strong>of</strong> fractureprocess zone <strong>in</strong> geomaterials. AE hypocenters areused to <strong>in</strong>vestigate spontaneous fracture nucleationand its quasi-static growth from a notch tip underMode- I <strong>in</strong> CCNBD specimen <strong>of</strong> <strong>granite</strong> underconstant stress load<strong>in</strong>g. AE density contour mapsillustrate the temporal and spatial correlation <strong>of</strong>event clusters <strong>du</strong>r<strong>in</strong>g the quasi-static growth undertension even up to dynamic fracture propagation,(Fig.6 stage A-D). AE technique was found viablemethod for estimat<strong>in</strong>g the length <strong>of</strong> FPZ <strong>in</strong> <strong>test</strong>sperformed under Mode-1 [16, 17 & 18] and Mode-II [1, 3 & 4] <strong>in</strong> various geomaterials. Earlier <strong>test</strong>performed under Mode I <strong>in</strong>dicated that the <strong>in</strong>tr<strong>in</strong>sicprocess zone developed near failure and had adist<strong>in</strong>ct size for a particular rock type which’s widthappeared to be a martial property related to gra<strong>in</strong>size [15 & 16].Based on AE density contour map, we observed thatFPZ length ahead <strong>of</strong> a notch <strong>in</strong> <strong>Lac</strong> <strong>du</strong> <strong>Bonnet</strong><strong>granite</strong> is about 5-8 mm and its width varies along
Fig.8. AE (red, green and orange, 355 dots) events superimposed over micro and macro fractures traced from th<strong>in</strong> sectionprepared from notch A.Fig.9 Micr<strong>of</strong>racture density and orientation (rose diagram) measured <strong>in</strong> process zone and farfield area <strong>in</strong> a <strong>in</strong> notch A. Theextended red box shown the width <strong>of</strong> the FPZ and AE events are superimposed to show the width <strong>of</strong> the process zone..the macro fracture up to a maximum <strong>of</strong> 20 mmacross. We as well noticed that fracture nucleation<strong>in</strong> front <strong>of</strong> the notch grew with the speed <strong>of</strong> 2.8 cm/sand reached approximately a volume <strong>of</strong> 6.5 cm 2 x1.25 cm = 8.12 cm 3 quasi-statically before itpropagate dynamically <strong>in</strong> stage B. This study showsthat the FPZ width based on the micr<strong>of</strong>racturedensity analysis and distribution <strong>of</strong> AE isapproximately the same and <strong>in</strong>creasessymmetrically and logarithmically as a function <strong>of</strong>distance towards the macro-fracture (Fig 10).Micr<strong>of</strong>racture density analysis from the <strong>test</strong>sperformed under Mode II <strong>in</strong> rocks [1, 4 & 24] and<strong>in</strong> nature from major faults, [13 & 14] <strong>in</strong>dicate anasymmetrical logarithmic <strong>in</strong>crease towards the faulttrace.
Fig.10 Micr<strong>of</strong>racture density and orientation (rose diagram) measured <strong>in</strong> process zone and farfield area <strong>in</strong> a seized fracture <strong>in</strong>notch B. The extended red box shown the width <strong>of</strong> the FPZ and smaller red box <strong>in</strong> front <strong>of</strong> the fracture conta<strong>in</strong>s the muchmicro-fracture density <strong>in</strong> FPZL.9. CONCLUSIONNumber <strong>of</strong> AE140120100806040200AE EventsMicr<strong>of</strong>racture d<strong>in</strong>sity-17.5 -15 -12.5 -10 -7.5 -5 -2.5 0 2.5 5 7.5 10 12.5 15 17.5Distance from fault trace <strong>in</strong> notch A, mmFigure 10 - Process zone- related micro-fracture density (leftord<strong>in</strong>ate) and AE number distribution (right ord<strong>in</strong>ate)perpendicular to the trace <strong>of</strong> ma<strong>in</strong> tensile fracture <strong>in</strong>notch A.Micro-fracture orientation analyses <strong>of</strong> shearfractures also reveal that the compressionalmicrocracks exhibit a smaller angle with respect t<strong>of</strong>ault propagation direction and larger angle <strong>of</strong>dilational microcracks with fault planes. Suchphenomenon is not observed <strong>in</strong> this study ma<strong>in</strong>ly<strong>du</strong>e to the fact that the ma<strong>in</strong> mechanism <strong>of</strong> fracturepropagation is tensile stresses under Mode I.121110987654Micr<strong>of</strong>racture density, cm/cm 2Detailed microstructural analysis us<strong>in</strong>g AE andpetrographical techniques were performed onexperimentally <strong>in</strong><strong>du</strong>ced fractures that propagateddom<strong>in</strong>antly under tensile Mode. AE techniques canbe used to del<strong>in</strong>eate the dimensions <strong>of</strong> the fractureprocess zone <strong>in</strong> front <strong>of</strong> a “V-shaped” notch <strong>in</strong>CCNBD specimen. Unlike what is usuallyobserved <strong>in</strong> shear fracture <strong>test</strong>s, AE distribution andmicr<strong>of</strong>racture densities are shown to be <strong>in</strong> closeagreement to one another and <strong>in</strong>creaselogarithmically and symmetrically towards themacro-fracture.Focal mechanism analysis (based on first motionpolarity method), <strong>of</strong> pre failure events reveals thatabout 75% <strong>of</strong> events are <strong>of</strong> tensile type, 15% are <strong>of</strong>shear and 10% belong to implosion type. On thecontrary 40% <strong>of</strong> the events <strong>in</strong> post failure region are<strong>of</strong> shear type, 39% <strong>of</strong> tensile type and 16% werefound to be <strong>of</strong> implosion type.Based on AE density contour and focal mechanismanalysis a tensile fracture <strong>in</strong>itiated at a distance <strong>of</strong>5-8 mm ahead <strong>of</strong> the notch A and propagated withthe velocity <strong>of</strong> 2.8 cm/s quasi-statically. Thedynamic propagation and ruptur<strong>in</strong>g happened <strong>du</strong>e to
unstable growth <strong>of</strong> expand<strong>in</strong>g tensile fracture whenit’s size grow to a volume <strong>of</strong> elongated shape (8.12cm 3 ). At this time K I = K IC =1.55 MPa. (m) 1/2 at tip<strong>of</strong> the notch. With<strong>in</strong> ∼ 14 second <strong>in</strong>itiation anddynamic ruptur<strong>in</strong>g <strong>of</strong> the tensile macro fracture tookplace.Acknowledgment:The authors wish to acknowledge the contribution<strong>of</strong> Dr. David Coll<strong>in</strong>s <strong>in</strong> us<strong>in</strong>g INSITE s<strong>of</strong>tware<strong>du</strong>r<strong>in</strong>g the analysis <strong>of</strong> the data and many otherhelpful discussions.References:1. Moor, D.E. and Lockner, D.A. 1995. The role <strong>of</strong> micr<strong>of</strong>ractur<strong>in</strong>g<strong>in</strong> shear-fracture propagation <strong>in</strong> <strong>granite</strong>. J.Structural Geology. 17: 96-114.2. Lockner, D.E., Byerlee, J.D., Kuksenko, V.,Ponomarev, A. and Sidor<strong>in</strong>, A. 1991. Quasi-static faultgrowth and shear fracture energy <strong>in</strong> <strong>granite</strong>, Nature.350:39-42.3. Zang, A. Wagner, C., Stanchits, S., Dresen, G.,Andresen R., and Haidekker, M.A. 1998. Sourceanalysis <strong>of</strong> acoustic emissions <strong>in</strong> Aue <strong>granite</strong> core<strong>du</strong>nder symmetric and asymmetric compressive loads. J.Geophys. Res. 135: 1113-1130.4. Zang, A. and Wagner, F.C., 2000. Fracture processzone <strong>in</strong> <strong>granite</strong>. J. Geophys. Res. 105:23651-23661.5. Lei, X, Kusunose, K., Rao, M.V.M.S., Nishizawa, O.,and Satoh, T. 2000. Quasi-static fault growth andcrack<strong>in</strong>g <strong>in</strong> homogeneous brittle rock under triaxialcompressive us<strong>in</strong>g acoustic emission monitor<strong>in</strong>g. J.Geophys. Res. 105: 6127-6139.6. Lei, X, Nishizawa, O., Kusunose, K., and Satoh, T.1992. Fractal structure <strong>of</strong> the hypocenter distributionand focal mechanism solutions <strong>of</strong> AE <strong>in</strong> two <strong>granite</strong>s <strong>of</strong>different gra<strong>in</strong> size. J.Phys. Earth, 40: 617-634.7. Dieterich, J.h. 1992. Earthquake nucleation on faultswith rate and state-dependent friction. Techtonophysics.211:115-134.8. Ohnaka, M. and Kuwahara, Y. 1990. Characteristicfeatures <strong>of</strong> local breakdown near crack tip <strong>in</strong> thetransition zone from nucleation to dynamic rupture<strong>du</strong>r<strong>in</strong>g stick-slip shear failure. Techtonophysics. 175:197-220.9. Ohnaka, M. 1996. Nonuniformity <strong>of</strong> the constitutivelaw parameters for shear rupture and quasi-staticnucleation to dynamic rupture: A physical model <strong>of</strong>earthquake generation process. Proc. Natl. Acad. Sci.U.S.A. 93: 3795-3802.10. Kato, N., Yammamoto, H. and Hirasava, T. 1992.Stra<strong>in</strong>-rate effect on frictional strength and the slipnucleation process. Techtonophysics. 211:269-282.11. Lockner, D. E. 1996. Brittle fracture as an analog toearthquakes: can acoustic emission be used to develop aviable prediction strategy, J. Acous. Emission, 14:88-101.12. Scholz, C.H., Dawers, N.H., Yu, J.-Z. and Anders,M.H. 1993. Fault growth and fault scal<strong>in</strong>g laws:Prelim<strong>in</strong>ary results, J. Geophys. Res. 98:21952-21961.13. Vermilye, J.M. and Scholz, C.H. 1999. Faultpropagation and segmentation: <strong>in</strong>sight from themicrostructural exam<strong>in</strong>ation <strong>of</strong> a small fault. J.Structural Geology. 21: 1623-1636.14. Wilson, J.E. Chester, J.S. and Chester, F.M. 2003.Micr<strong>of</strong>racture analysis <strong>of</strong> fault growth and wearprocesses, Punchbowl fault, Sand Andreas system,California. J. Structural Geology. 25: 1855-1873.15. Zietlow, W.K., and Labuz, J.F. 1998. Measurement <strong>of</strong>the <strong>in</strong>tr<strong>in</strong>sic process zone <strong>in</strong> rock us<strong>in</strong>g acousticemission. Int. J. R. Mech. M<strong>in</strong>. Sci. 3: 291-299.16. Labuz, J.F. Shaw, S.P. Dowd<strong>in</strong>g, C.H. 1987.Thefracture process zone <strong>in</strong> <strong>granite</strong>: Evidence and effect,Int. J. R. Mech. M<strong>in</strong>. Sci&Geomech. Abstr.24: 235-246.17. Mihashi, H. and Nomura, N. 1996. Correlation betweencharacteristics <strong>of</strong> fracture process zone and tensions<strong>of</strong>ten<strong>in</strong>gproperties <strong>of</strong> concrete. Nuclear Eng<strong>in</strong>eer<strong>in</strong>gand Design, 165:359-376.18. Koji, O and Hidehumi, D. 2000. Fracture process zone<strong>in</strong> concrete tension specimen, Eng<strong>in</strong>eer<strong>in</strong>g FractureMechanics, 65: 111-13119. ISRM Test<strong>in</strong>g Commission, Suggested method fordeterm<strong>in</strong><strong>in</strong>g Mode I fracture toughness us<strong>in</strong>g crackedchevron notched Brazilian disc (CCNBD) specimens.1995. Int. J. Mech. M<strong>in</strong>. Sci. 7 Geomech. Abstr. 1: 57-64.20. Kranz, R.L. 1983. The role <strong>of</strong> micro-crack<strong>in</strong>g <strong>in</strong> shearfracture propagation <strong>in</strong> <strong>granite</strong>. Techtonophysics, 267:91:119.21. Nasseri, M.H.B. Mohanty, B. Prasad, U. 20002.Investigation <strong>of</strong> micro-structural properties <strong>of</strong> selectedrocks and their effect on fracture toughness. NARMS,<strong>Toronto</strong>, Canada2: 961-968.22. Nasseri, M.H.B. Mohanty, Rob<strong>in</strong>, P.-Y.F. 2005.Characterization <strong>of</strong> microstructures and fracturetoughness <strong>in</strong> five granitic rocks. Int. J. Mech. M<strong>in</strong>. Sci.7 Geomech. Abstr. In Press.23. Chelidze, T. Reuschle, T and Gueguen, Y. 1994. Atheoretical <strong>in</strong>vestigation <strong>of</strong> the fracture energy <strong>of</strong>heterogeneous brittle materials. J. Phys.: Condens.Matter, 6:1857-1868.24. Janssen, C. Wagner, F.C. Zang, A and Dresen, G. 2001.Fracture process zone <strong>in</strong> <strong>granite</strong>: a microstructuralanalysis. Int. J. Earth Sciences, 90:46-59