National Market Cow and Bull Beef Quality Audit - Dairy Cattle Edition
National Market Cow and Bull Beef Quality Audit - Dairy Cattle Edition
National Market Cow and Bull Beef Quality Audit - Dairy Cattle Edition
- No tags were found...

Create successful ePaper yourself
Turn your PDF publications into a flip-book with our unique Google optimized e-Paper software.
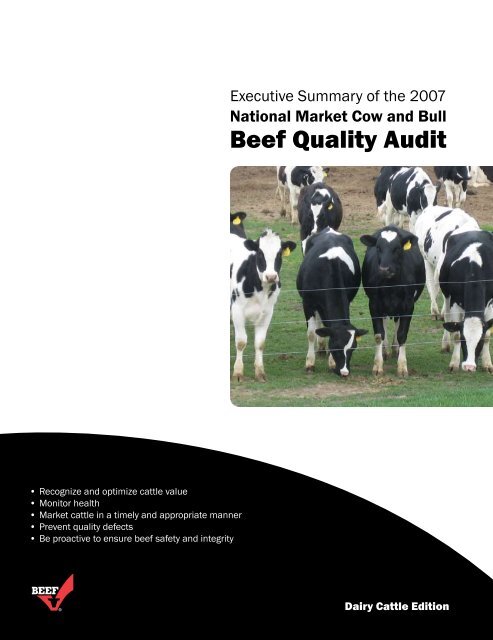
Executive Summary of the 2007<strong>National</strong> <strong>Market</strong> <strong>Cow</strong> <strong>and</strong> <strong>Bull</strong><strong>Beef</strong> <strong>Quality</strong> <strong>Audit</strong>• Recognize <strong>and</strong> optimize cattle value• Monitor health• <strong>Market</strong> cattle in a timely <strong>and</strong> appropriate manner• Prevent quality defects• Be proactive to ensure beef safety <strong>and</strong> integrity<strong>Dairy</strong> <strong>Cattle</strong> <strong>Edition</strong>
Executive Summary of the 2007<strong>National</strong> <strong>Market</strong> <strong>Cow</strong> <strong>and</strong> <strong>Bull</strong><strong>Beef</strong> <strong>Quality</strong> <strong>Audit</strong>Conducted byTexas A&M UniversityNorth Dakota State UniversityCalifornia Polytechnic State UniversityPennsylvania State UniversityUniversity of GeorgiaUniversity of FloridaWest Texas A&M University®For more information contact:<strong>National</strong> <strong>Cattle</strong>men’s <strong>Beef</strong> Association<strong>Beef</strong> <strong>Quality</strong> Assurance Program9110 East Nichols Avenue, Suite 300Centennial, CO 80112303.694.0305December 20072 <strong>National</strong> <strong>Market</strong> <strong>Cow</strong> <strong>and</strong> <strong>Bull</strong> <strong>Beef</strong> <strong>Quality</strong> <strong>Audit</strong>
Do the right thing.Ultimately, this is a roadmap to optimize beef quality.This document summarizes an industry-wide researcheffort that is unique to all of U.S. agriculture.In these pages, we talk openly about the challenges<strong>and</strong> opportunities our industry faces. We discuss ourweaknesses. And, we explore where we’ve been <strong>and</strong>where we’ve made progress.We share ideas on how we can work together – in ourown way, on our own farms – to improve beef quality<strong>and</strong> the stewardship of cattle.Since the first beef quality audits were conducted inthe early 1990s, cattle producers like you have movedaggressively to make beef better.You recognize quality matters.You underst<strong>and</strong> the necessity of food safety tounderpinning beef dem<strong>and</strong>.You realize beef production doesn’t end when a cowor a bull leaves your farm, that it’s really a first, criticalstep in a complicated journey to the dinner plates ofAmerica.You also recognize how consumers have changed inrecent years.They worry more than ever before about antibiotics <strong>and</strong>disease.They want to know their steaks or hamburgers areproduced safely <strong>and</strong> humanely.They scrutinize abuse or mish<strong>and</strong>ling of livestock likenever before.At the same time, they trust us, <strong>and</strong> they demonstratethis trust by keeping beef at the center of the plate.They continue to prefer beef’s flavor to all otherproducts in the marketplace today, <strong>and</strong> they’ll continueto support our livelihood as long as they know we’redoing a good job.But it’s something we can never take for granted.About 250 million Americans will eat beef – the beefyou helped produce – this week.And, beef produced from cows <strong>and</strong> bulls has becomean increasingly important food item in America’skitchens <strong>and</strong> restaurants.It’s no longer just fast food hamburgers. It’s roasts,steaks, fajitas <strong>and</strong> an endless array of innovative,flavorful <strong>and</strong> value-added food items that are availableat just about every restaurant, grocery store <strong>and</strong> eateryin America.“<strong>Beef</strong> producers must stop thinking of market cows<strong>and</strong> bulls as culls <strong>and</strong> start managing, monitoring, <strong>and</strong>marketing them as the important food source they are,”says Dr. Bill Henning of Pennsylvania State University.“Improved production of cull cows <strong>and</strong> bulls will helpkeep up with the American consumer’s love affair withbeef.”And ultimately, that’s what the 2007 <strong>National</strong> <strong>Market</strong><strong>Cow</strong> <strong>and</strong> <strong>Bull</strong> <strong>Beef</strong> <strong>Quality</strong> <strong>Audit</strong> is all about. It providesa review of where we’ve been, a snapshot of wherewe are today, <strong>and</strong> a roadmap for where we can betomorrow.<strong>Dairy</strong> <strong>Cattle</strong> <strong>Edition</strong> 3
Point ofImprovementReduce the use ofelectric prods <strong>and</strong> otheraggressive driving aidswhen moving cattle.BackgroundIn 1994, the industry conducted its first audit todevelop strategies <strong>and</strong> tactics for improving quality<strong>and</strong> minimizing economic losses.The audit determined the industry fell short inensuring the quality of its product in a number ofimportant areas. These included:Producers did not harvest cows <strong>and</strong> bulls ina timely fashion, waiting instead until the physicalcondition of the cattle had deteriorated, resulting innumerous problems down the production line:<strong>Beef</strong> <strong>and</strong> dairy cows had inadequate muscling atharvest.Too many market cows were disabled prior toharvest.Too many market cattle <strong>and</strong> carcasses werecondemned.Too many carcasses had excessive bruises.The audit concluded these problems could havebeen reclaimed if producers managed, monitored,<strong>and</strong> marketed their herds more closely to promotevalue in their cows <strong>and</strong> bulls <strong>and</strong> improve the qualityof beef.In 1999, a second audit determined that theindustry had made significant strides in reducingcondemnations, the frequency of disabled cattle,bruising, damage caused bybr<strong>and</strong>ing, injection-site lesions<strong>and</strong> the overall condition ofcattle, but concluded much morework needed to be done to makebeef better <strong>and</strong> beef producersmore competitive.The 2007 <strong>Audit</strong>Researchers carried out the 2007 <strong>National</strong><strong>Market</strong> <strong>Cow</strong> <strong>and</strong> <strong>Bull</strong> <strong>Beef</strong> <strong>Quality</strong> <strong>Audit</strong> betweenDecember 2006 <strong>and</strong> September 2007.Their goal was to compare results to the 1994<strong>and</strong> 1999 audits, determine how far the industryhas come in addressing previously identified qualityproblems, what areas are still below grade, <strong>and</strong>future challenges.The audit was comprised of four phases:During Phase I, researchers conducted auditsin packing plants to identify quality defects in cows<strong>and</strong> bulls in receiving areas <strong>and</strong> holding pens, <strong>and</strong> intheir carcasses on harvest floors <strong>and</strong> in chill coolers.They also audited packing plants for fabrication <strong>and</strong>traceability.The packing plant phase of the audit was theresult of the work of over 70 auditors, includingfaculty, staff <strong>and</strong> graduate students, as well asstate beef council personnel <strong>and</strong> other membersof the industry working in collaboration with sevenuniversities.The audit took place in 23 packing plants in11 states. Collectively, these plants harvest morethan 15,000 head per day. The audit surveyedapproximately 5,500 live animals, 5,000 carcassesduring harvest, <strong>and</strong> 3,000 carcasses in the coolers.In Phase II, interviews consisting of freeresponse <strong>and</strong> aided questionnaires were conductedwith two interviewees at each plant – one packer<strong>and</strong> one Food Safety Inspection Service (FSIS)employee. The purpose of the interviews was todetermine improvements <strong>and</strong> declines in the qualityof cattle since the 1999 audit.In Phase III, the audits consisted of interviewswith eight end users, looking specifically at subprimaldefects, top sirloin center cuts, caps, <strong>and</strong> bottomround flats. They also looked for injection-site lesions<strong>and</strong> other defects that would cause devaluation.In Phase IV, researchers, producers, retailers,restaurateurs, packers, processors <strong>and</strong> governmentrepresentatives met for a two-day workshop todiscuss strategies <strong>and</strong> tactics to ensure continuedquality <strong>and</strong> animal-h<strong>and</strong>ling improvements.4 <strong>National</strong> <strong>Market</strong> <strong>Cow</strong> <strong>and</strong> <strong>Bull</strong> <strong>Beef</strong> <strong>Quality</strong> <strong>Audit</strong>
Phase I – Packing Plant <strong>Audit</strong>sDuring this phase, auditors monitored six areasat 23 packing plants: receiving, holding pens, harvestfloors, coolers, <strong>and</strong> fabrication rooms. The auditorsalso looked at the traceability of the cattle beingprocessed by these plants.Receiving <strong>Audit</strong>sKey points:<strong>Audit</strong>ors evaluated approximately 5,500 liveanimals <strong>and</strong> 10 % of trucks during this phase.Substantial reductions in the incidence of downercattle.All truck <strong>and</strong> trailer loads met AMI guidelines forspacing.Use of electric prods has diminished but continuesto be a cattle-h<strong>and</strong>ling problem that needsimprovement.<strong>Cattle</strong> slipping while being unloaded is low butexceeds AMI guidelines <strong>and</strong> is still a problem thatneeds to be addressed.<strong>Cattle</strong> need to be separated by gender to avoidinjuries.<strong>Dairy</strong> cattle traveled shorter distances than beefcattle.Overall, cattle loads averaged 34.7 square feetper animal <strong>and</strong> 24 animals per load. <strong>Dairy</strong> cattle loadsaveraged 36 square feet per animal <strong>and</strong> 15 head perload.Travel – Among overall load numbers, less than 1% ofthe cattle traveled more than 28 hours.Average travel for all cattle was 6 hours <strong>and</strong> 283miles.<strong>Dairy</strong> cattle were trucked an average of 3 hours<strong>and</strong> 125 miles.The minimum distance traveled by cattle overallwas 1 mile.The minimum traveled for dairy cattle was 5 miles.The maximum distance traveled for all cattle was1250 miles, while the maximum distance for dairycattle was 602 miles.Trailers – 64% of all loads <strong>and</strong> 37% of dairyloads arrived on tractor trailers, while 36% of allloads <strong>and</strong> 63% of dairy loads came in on gooseneck/bumper trailers. 17% of dairy loads traveling in tractortrailerscontained cattle in the doghouse (the rearcompartment of potbelly trailers), compared to 16% ofoverall loads.Load sorting -- 65% of all loads <strong>and</strong> 90% of dairyloads were single gender. 35% of all loads <strong>and</strong> 10% ofdairy loads were multi-gender. 67% of all multi-genderloads were not sorted by gender. 50% of multi-genderdairy loads were not sorted by gender.<strong>Cattle</strong> unloading -- 65% of all cattle loads had nocattle slip, 70% had no more than 3% cattle slip, <strong>and</strong>30% had more than 3% cattle slip. 71% of dairy loadshad no cattle slip, 71% had no more than 3% of cattleslip, <strong>and</strong> 29% had more than 3% of cattle slip.Dead/moribund cattle – A total of 0.24% loadshad moribund cattle <strong>and</strong> 0.04% had dead cattle. <strong>Dairy</strong>cattle loads contained 1.04% moribund <strong>and</strong> 0% deadcattle.Electric prod usage for unloading – Electricprods were used on 22% of all loads <strong>and</strong> 15% of dairycattle loads.13% of all cattle loads saw electric prods used onmore than 25% of the animals unloaded.10% of dairy loads saw electric prods used onmore than 25% of the animals unloaded.Other driving aids used while unloading –14% of all cattle loads experienced the aggressiveuse of driving aids other thanelectric prods. Aggressive useis defined as making contactwith the animal with drivingaids such as sticks, paddles,<strong>and</strong> whips. 5% of dairy loadsexperienced the aggressiveuse of body parts as drivingaids.Electric prod usagewhile moving cattle to therestrainer – 83% of all plants used electric prods formoving cattle to the restrainer. 65% used electric prodson more than 25% of the cattle as they were moved.Other driving aids used when moving cattleto the restrainer -- 39% of plants audited showed theaggressive use of driving aids, (aids other than electricprods), when moving cattle to the restrainer. Employeefatigue resulted in an increase in aggressive h<strong>and</strong>lingas the day progressed.Point ofImprovementImprove footing so cattledon’t slip <strong>and</strong> injurethemselves.<strong>Dairy</strong> <strong>Cattle</strong> <strong>Edition</strong> 5
Point ofImprovementWhen transporting cattle,separate them by genderto avoid injury or bruisingto livestock.Holding Pen <strong>Audit</strong>s, Part 1Key points:Fewer cattle had mud/manure problems than in1999.More cattle were polled than in 1999.Fewer cattle had br<strong>and</strong>s than in 1999.92% of the cattle had some form of identification.Majority of dairy cattle were Holstein.Fewer abscesses in dairy cattle than in 1999.<strong>Dairy</strong> cows had the most visible defectscompared to other gender/cattle types.Visible defects – 69% of all cattle had novisible defects. 63% of dairy cows <strong>and</strong> 80% of dairybulls had no visible defects.Abscesses <strong>and</strong> lumpy jaw – 0.39% of cattlehad abscesses of the jaw/tooth compared with 1% ofall cattle in the 1999 audit.1% of all cattle surveyed had abscesses of theknee/hock, down from 2% in 1999.At 2% for dairy cows <strong>and</strong>4% for dairy bulls, knee/hockabscesses were down from the1999 figures of 6% for dairy cows<strong>and</strong> 5% of dairy bulls. Hook/pinabscesses occurred in 1999 at arate of 1% for all cattle surveyed.In 2007, 1% of all cattle, 1% ofdairy cows, <strong>and</strong> 2% of dairy bullshad hook/pin abscesses. 0.59%of all cattle, 0.15% of dairy cows,<strong>and</strong> 1.09% of dairy bulls had lumpy jaw in 2007,compared to 0.59% of all cattle, 1% of dairy cows,<strong>and</strong> 0% of dairy bulls in 1999.Udder defects – 83.9% of all cows audited hadno udder defects, while 76% of all dairy cows werefree of udder defects.Reproductive defects – <strong>Cow</strong>s surveyed hada 0.23% incidence of vaginal prolapses <strong>and</strong> 0.31%incidence of retained placentas. 4.08% of bulls hadbroken penises.Hide colors – 93% of dairy cows <strong>and</strong> 90% ofdairy bulls were Holstein.Identification types – 68% of all cattlesurveyed had back tags. 60% of all cattle, 66%of dairy cows, <strong>and</strong> 44% of dairy bulls had visualidentification tags. Metal clips were used to identify45% of all cattle, 37% of dairy cows, <strong>and</strong> 16% ofdairy bulls. 8% of all cattle, 8% of dairy cows, <strong>and</strong>20% of dairy bulls had no identification.Mud/manure -- 57% of all cattle had someamount of mud/manure with 51% of mud/manurelocated on the legs.All cattle improved from only 6% with no mud/manure in 1999 to 43% with no mud/manure in2007.Br<strong>and</strong>s -- 76% of all cattle surveyed during the2007 audit had no br<strong>and</strong>, an improvement from1999’s 54%.Horns -- There was an increase in thepercentage of polled animals since the 1999 audit,from 77% to 83%.Frequency Distribution of Udder Defects in <strong>Cow</strong>s10090807060504030201007690No Udder Defects<strong>Dairy</strong> <strong>Cow</strong>s<strong>Beef</strong> <strong>Cow</strong>s2411Udder Defects Present6 <strong>National</strong> <strong>Market</strong> <strong>Cow</strong> <strong>and</strong> <strong>Bull</strong> <strong>Beef</strong> <strong>Quality</strong> <strong>Audit</strong>
Holding Pen <strong>Audit</strong>s – Part 2Key points:97% of the cattle had no evidence of cancer eye, animprovement over 1999 <strong>and</strong> 1994.<strong>Dairy</strong> cattle had more knots in the neck <strong>and</strong>shoulder than in beef cows, with more observedin the shoulder than the neck, an indication thatproducers need to observe labeling instructions forinjectable animal-health products.There was a higher incidence of lame dairy cows in2007 than in 1999 <strong>and</strong> 1994.Fewer cattle had light muscle scores than in 1999.More dairy cows were in leaner condition than in1999.Cancer eye -- 97% of all cattle had no evidence ofcancer eye. Cancer eye has been on a downward trendsince 1994, dropping from an incident rate of 8.5% in1994 to 4% in 1999 100<strong>and</strong> 3% in 2007.Visible knots – 92.1% of all cattle surveyed1994901999had no visible knots. When visible knots were present8020072.6% were in the neck, 4.6% in the shoulder, 0.2% inthe top butt, <strong>and</strong> 0.50% 7069in the 70 round. 85.8% of dairycows <strong>and</strong> 91.1% of dairy bulls had no sign 6160of knotsin the neck <strong>and</strong> shoulder. 4.3% of dairy cows <strong>and</strong> 511.5% of dairy bulls 50 had knots in the neck area. 8.8%of dairy cows <strong>and</strong> 6.7% 40 of dairy bulls had shoulderknots. The incidence of knots in the round area in dairy30cows decreased from 4.2% in 1999 to 0.7% in 2007.Incidence of knots 20 in the shoulder area of dairy cowsrose sharply from 0.6% 10 in 1999 to 8.8% in 2007.Frequency Distribution of <strong>Cattle</strong> withNo Evidence of Lameness Across all <strong>Audit</strong>s1009080706050403020100<strong>Dairy</strong> <strong>Cow</strong>s are More Lame than in 199969 70Frequency Distribution of <strong>Cattle</strong> withNo Evidence of Lameness Across all <strong>Audit</strong>s07761<strong>Dairy</strong> <strong>Cow</strong>s are More Lame than in 19995119941999200777767871All <strong>Cattle</strong> <strong>Dairy</strong> <strong>Cow</strong>s <strong>Dairy</strong> <strong>Bull</strong>s“The higher incidence of shoulder knots indicatesa need for continued education,” says Texas A&M’sDr. Jeff Savell. “These knots are likely the result ofintramuscular injections of animal health productsinstead of the recommended subcutaneous injectionsin the neck area.”Lameness – 70% of all cattle, 51% of dairy cows,<strong>and</strong> 78% of dairy bulls showed no sign of lameness.4% of all cattle received scores of 4 <strong>and</strong> 5, qualifyingthese animals as very disabled.At 49%, more dairy cows were lame in 2007 thanthe 39% in the 1999 audit <strong>and</strong> the 23% in the 1994audit.<strong>Dairy</strong> bull figures were slightly improved. In 200722% of dairy bulls were lame, compared to 29% in1999 <strong>and</strong> 24% in 1994.Muscling – 21% of all cattle audited wereinadequately muscled. There were fewer light-muscleddairy cows in 2007 than in 1999. In the 1999 audit72% of dairy cows came in with a muscle score of 1 or2. In 2007 that number fell to 35%,78 Body condition score – <strong>Dairy</strong> cattle were scoredfrom 71 1, severely emaciated, to 5,76All <strong>Cattle</strong> <strong>Dairy</strong> <strong>Cow</strong>s <strong>Dairy</strong> <strong>Bull</strong>sseverely over conditioned.63% of dairy cattle hadbody condition scores of 2.5<strong>and</strong> lower.100Point ofImprovementAdminister animal-healthproducts in the neck, <strong>and</strong>do so subcutaneouslywhen the label allows.<strong>Dairy</strong> <strong>Cattle</strong> <strong>Edition</strong> 790807060504030201006Frequency Distribution of Body ConditionScores for <strong>Dairy</strong> <strong>Cattle</strong>Approximately 63% of <strong>Dairy</strong> <strong>Cow</strong>s are BCS 2.5 <strong>and</strong> Lower2<strong>Dairy</strong> <strong>Cow</strong>s<strong>Dairy</strong> <strong>Bull</strong>s162Frequency Distribution of Body Condition1952210211 1.5 2 2.5 3 3.5 4 4.5 52311236252813
Point ofImprovementFollow theguidelines for animalcare <strong>and</strong> h<strong>and</strong>ling.Harvest Floor <strong>Audit</strong>Key points:Fewer cows had bruises than in 1994 <strong>and</strong> 1999.Overall 94% of the cattle had no evidence ofinjection sites.<strong>Dairy</strong> cattle had more visible injection-siteblemishes than beef cows (11% versus 2%).Fewer arthritic joints than in 1999.No buckshot/bird shot was observed during the2007 audit, an improvement over 1999.More heads <strong>and</strong> livers were condemned than in1999.Fewer cows were pregnant at harvest than in1999.Dentition – 11.2% of allcattle <strong>and</strong> 5.7% of dairy cows had8 extremely worn adult incisors(classified as gummers). 58% ofall bulls <strong>and</strong> cows had 8 adultincisors. <strong>Dairy</strong> cattle came in at63% with 8 adult incisors.Bruises – The 2007 auditfound fewer carcasses withbruises than in the 1994 <strong>and</strong>1999 audits. The highest incidence of bruisingin dairy cow carcasses was in the round at 14%,followed by 10% FPB, 6% loin, 3% rib, <strong>and</strong> 2% chuck.<strong>Dairy</strong> bull carcass bruising figures were 19% round,7% FPB, 8% loin, 0% rib <strong>and</strong> 3% chuck.Injection-site lesions – Overall, 94% ofcarcasses showed no evidence of injection sitelesions. 89% of dairy cow carcasses had no lesions<strong>and</strong> 99% of dairy bulls had no lesions, but dairycows had more injection-site lesions than any othergender/cattle types. 2% of all carcasses had minorinjection site lesions that resulted in trims of lessthan one pound per bruise site. 3% of dairy cows<strong>and</strong> 1% of dairy bulls had minor lesions. 4% of dairycows had medium injections site lesions, (betweenthe size of a golf ball <strong>and</strong> a softball), 3% hadmajor lesions (larger than a softball <strong>and</strong> requiringsubstantial trim per bruise site), <strong>and</strong> 2% had extremelesions (resulting in a trim area nearly the size of anentire primal).Arthritic joints – 89% of all carcasses in 1999had no arthritic joints removed. This figure wasimproved to 94% of carcasses in 2007. 93% of dairycow carcasses <strong>and</strong> 92% of dairy bull carcasses hadno arthritic joints removed. 2% of dairy cows <strong>and</strong> 3%of dairy bulls had 2 arthritic joints removed.Buckshot/grubs -- 100% of carcasses auditedin 2007 were buckshot-free. 99.95% of carcasseswere free of grubs.Offal condemnation -- More offal wascondemned in 2007 than in 1999. 31% of liverswere condemned in 1994, 24% in 1999, <strong>and</strong> 45%in 2007. Of the 45% of rejected livers, 14% wereabscessed, 7% were contaminated, 6% had flukes,5% had T-lang, <strong>and</strong> 14% were rejected for “other”reasons.Whole carcass condemnations -- In 2007,when carcasses/animals were condemned, 0.3%were condemned antemortem <strong>and</strong> 0.8% werecondemned postmortem. No carcasses werecondemned due to bruises in 2007.Pregnancy - 11% of all cows were pregnant atharvest in 2007, down from 12% in 1999, <strong>and</strong> 28%in 1994. <strong>Dairy</strong> cows had an 11% pregnancy rate.Bruising Severity Frequency Distribution%All <strong>Cattle</strong>1999 - 11.8% No Bruises2007 - 36.6% No Bruises80706050403020100<strong>Cow</strong>s207754524237 373112122 5None Minor Medium Major Extreme311994199922 200780706050403020100<strong>Bull</strong>s6447472544322017 207127199419992007None Minor Medium Major Extreme188 <strong>National</strong> <strong>Market</strong> <strong>Cow</strong> <strong>and</strong> <strong>Bull</strong> <strong>Beef</strong> <strong>Quality</strong> <strong>Audit</strong>
Cooler <strong>Audit</strong>sKey points:<strong>Cow</strong> <strong>and</strong> bull carcasses were heavier than in 1999.<strong>Cow</strong> <strong>and</strong> bull carcasses had a lower fat thicknessthan in 1999.Majority of cows had a muscle score of 1 or 2.More cow carcasses had the more desirable fat colorscores of 1 <strong>and</strong> 2 than in the previous two audits.Carcass weight – <strong>Cow</strong> <strong>and</strong> bull carcasses wereheavier in 2007 than in 1999. In 1999, cow carcassesaveraged 540.5 lbs. <strong>and</strong> bull carcasses averaged858.5 lbs.In 2007, dairy cow carcasses averaged 648.8pounds <strong>and</strong> dairy bull carcasses averaged 927.9pounds21% of all carcasses were less than 500 lbs. <strong>and</strong>7% of all carcasses were too heavy (more than 1,000lbs.) compared to the 46% that were too light <strong>and</strong> the27% that were too heavy in 1999. 19% of dairy cowcarcasses were too light, <strong>and</strong> 4% were too heavy. 2% ofdairy bull carcasses were too light, <strong>and</strong> 36% were tooheavy.Fat thickness - Fat thickness for all carcassesaveraged 0.22 inches in 2007, lower than the 0.37inches measured in 1999.Ribeye area – Ribeye area averaged 10-squareinches. Ribeye area/cwt. of carcass averaged 1.54.Marbling – 3% of carcasses were devoid ofmarbling.Lean maturity – 27% of all carcasses werescored as C maturity for lean. 24% of dairy cowcarcasses <strong>and</strong> 71% of dairy bull carcasses wereclassified as C lean maturity. In 1999 33% of cowcarcasses were D lean maturity.Skeletal maturity – 16% of all carcasses, 14% ofdairy cow carcasses, <strong>and</strong> 15% of dairy bull carcasseswere D maturity. In 1999 cow carcasses averaged E -<strong>and</strong> bull carcasses averaged D o.Overall maturity – 39% of all carcasses, 44% ofdairy cow carcasses, <strong>and</strong> 29% of dairy bull carcasseswere graded as D overall maturity.<strong>Quality</strong> grade -- 44% of all carcasses gradedutility. 29% of all carcasses <strong>and</strong> 20% of dairy cowcarcasses graded as cutters. 8% of all carcasses <strong>and</strong>4% of dairy cow carcasses graded as canners. 0.2% ofthe carcasses audited graded prime.Muscling scores - The majority of dairy cowcarcasses had a muscle score of 1 or 2, with anaverage for all cattle of 2.06. In1999 cow carcasses averagedPoint ofImprovement1.6 <strong>and</strong> bulls averaged 3.5.Fat scores -- Morecarcasses audited in 2007had fat color scores of 1 <strong>and</strong>2 (whiter color). The 2007average score was 2.7. Theaverage fat color score in 1999was 3.8 for cow carcasses <strong>and</strong>2.5 for bull carcasses.Yield grade -- The average yield grade was 2.6in this year’s audit. <strong>Cow</strong> carcasses in the 1999 auditaveraged a 2.4 yield grade.<strong>Market</strong> your cattle beforethey become too thin ortoo lame for transport.<strong>Dairy</strong> <strong>Cattle</strong> <strong>Edition</strong> 9
Point ofImprovementMaintain record-keepingsystems to verify your“Best’ managementpractices <strong>and</strong> reduceor eliminate potentialfor liability surroundingissues of food safety.Fabrication <strong>Audit</strong> –Key point:A significant portion of beef cuts from cow <strong>and</strong>bull carcasses are used as whole muscle cuts<strong>and</strong> lean strips of meat.The round, sirloin <strong>and</strong> chuck from cows <strong>and</strong> bullsare being sold as lean trim for primal-specificground beef programs.Average percentage of products produced-- The 2007 audit found on average,during one full production day,11% of the products producedwere forequarter cuts, 28% werehindquarter cuts, 1% were FPB, <strong>and</strong>58% were trim. With the exceptionof tenderloins, most hindquartersubprimals were 100% lean <strong>and</strong>likely used for grinding.Subprimals -- Of plants thatsubmitted information aboutfabricating subprimal cuts fromprimal regions of cow <strong>and</strong> bullcarcasses, 100% fabricated rib cuts,100% fabricated loin, 85.7% round,85.7% flank, 57.1% chuck, <strong>and</strong> 21.6%brisket.Plant production by product – The 2007audit noted an increase in the production costs ofmost cuts since 1999.Table X% of Plants that Produce Each ItemProduct 1999 % 2007 %Ribeye 74 100Tenderloin 79 100Knuckle 37 86Flank 74 86Inside Round 42 79Strip Loin 68 71Top Sirloin Butt 5 71Chuck Tender 16 57Eye of Round 42 57Bottom Round 37 50Chuck Roll 16 28.6Bottom Sirloin Flap 21 28.6Brisket 21 21Shortloin 32 14Clod 16 14Tri-Tip 11 14Traceability audits – 2% of carcasses wereselected r<strong>and</strong>omly to determine whether the animalcould be traced back to the ranch/farm.Plant information such as back tags, bangs tags,<strong>and</strong> owner information were used for this process.Auction barns, USDA offices, <strong>and</strong> actual owners werecontacted to identify the point of origin for eachanimal.64% of all cattle <strong>and</strong> 56% of dairy cattle weretraced back to their original owner. 19% of all cattle<strong>and</strong> 22% of dairy cattle were traced back to theauction barn. 13% of all cattle <strong>and</strong> 16% of all dairycattle were traced back to the cattle dealer/trader.5% of all cattle <strong>and</strong> 7% of all dairy cattle could not betraced back past the packing plant.10 <strong>National</strong> <strong>Market</strong> <strong>Cow</strong> <strong>and</strong> <strong>Bull</strong> <strong>Beef</strong> <strong>Quality</strong> <strong>Audit</strong>
Phase II – The InterviewsInterviews were conducted with one packer <strong>and</strong>one Food Safety <strong>and</strong> Inspection Service employee ateach packing plant. The interviews consisted of freeresponse <strong>and</strong> aided questionnaires <strong>and</strong> were used todetermine improvements <strong>and</strong> declines in the quality ofcattle since the 1999 audit.Packing plant <strong>and</strong> FSIS representativesinterviewed, acknowledged that the downer ruleinstituted by the United States Department ofAgriculture’s Food Safety <strong>and</strong> Inspection Service hasled to several improvements in beef cattle quality.Packing plant representatives noted a decrease inthe number of downer, dead <strong>and</strong> moribund cattle, <strong>and</strong>fewer instances of inadequate space on trailers <strong>and</strong>incorrect loading of cattle.FSIS representatives also noticed fewer downer,dead <strong>and</strong> moribund cattle, <strong>and</strong> fewer instances ofinadequate space on trailers. Their observationsindicated fewer animals arriving suffering fromadvanced lameness <strong>and</strong> extreme emaciation.Top quality challenges,1999 versus 20071999 2007BruisesFood safetyAntibiotic residues Animal welfare/h<strong>and</strong>lingBirdshot/buckshotPoor condition/nutritionArthritic jointsAntibiotic residuesYieldBruisesCondition/leannessCondemnation rateHide damageLameness/soundnessCondemnation rate/downersInjection-site prevalenceTop 5 improvements over 1999Herd management techniquesAnimal welfare <strong>and</strong> h<strong>and</strong>lingHide damageInjection-site locationBruisesPoint ofImprovementRecognize <strong>and</strong>optimize the valueof your market cows<strong>and</strong> bulls. <strong>Cow</strong>s <strong>and</strong>bulls comprise asignificant portion ofyour farm or ranch’sincome – so theyneed to be managed<strong>and</strong> marketed in waysthat add value – notsubtract from it.<strong>Dairy</strong> <strong>Cattle</strong> <strong>Edition</strong> 11
Point ofImprovementEnsure the safety of yourproduct. <strong>Cow</strong>s <strong>and</strong> bullsmust be free of chemical,pathogenic <strong>and</strong> physicalhazards when you shipthem for harvest.Phase III – End User <strong>Audit</strong>s –A total of eight end-user audits were conducted.These audits consisted of interviews <strong>and</strong> lookingfor quality defects in subprimal cuts as they werebeing further processed. <strong>Audit</strong>ors looked at topsirloin center-cuts, <strong>and</strong> caps, <strong>and</strong> bottom round flats.They looked for any injection site lesions as well asother defects that cause devaluation.Top 5 cow <strong>and</strong> bull quality challenges accordingto end users as determined during theinterview process –Product uniformityProduct qualityBuck shot<strong>Cattle</strong> availabilityInjection sitesTop 5 improvements incow/bull subprimals – Endusers said that overall injectionrelateddefects (beef <strong>and</strong> dairycarcasses) have improved since1999, including a reductionin the incidence of needles,abscesses, injection site lesions,<strong>and</strong> bruising. They also noted thatthere were fewer incidences ofbuckshot.Declines in cow/bullsubprimals since 1999 – Endusers noted growing concerns overmeat from subprimals that is too light or too dark incolor. Coloration problems were mainly a concern forsteaks cut from top butts.Top sirloin cap defects – When examining thesubprimals as they were being further processed,end-user auditors found that 9.4% of top sirloincaps had injection site blemishes. 90.0% of dairytop sirloin caps had no defects. 8.0% had minordefects, 0.1% had severe defects, <strong>and</strong> 0.2% werecondemned.Top sirloin center cut defects – 95.8% of allcenter cuts had no defects. 3.8% of center cuts hadinjection-site blemishes.Bottom round defects – 67.0% of all bottomrounds had no defects. 10.4 % had active lesions,15.5 % had woody calluses, 3.6% had fibrous scars,1.0% had bruises, <strong>and</strong> 2.7% were dark cutters. In1999, 57.5% of dairy flats had defects, compared to59.1% in 2007. 25.3% had minor defects, 1.3% hadsevere defects, <strong>and</strong> 0.1% were condemned.Conclusions – The Strategy WorkshopRepresentatives of all industry sectorsmet at a strategy workshop to discuss findingsof the audit, <strong>and</strong> to develop industry-widerecommendations for the improvement of qualitydefects in cows <strong>and</strong> bulls.Overall, participants agreed, the dairy cattleindustry has made significant quality gains since thelast audit.There has been significant improvement in thereduction of downer cattle.All trailer <strong>and</strong> truck loads met the American MeatInstitute guidelines for spacing.Less than 1% of the cattle traveled for more than28 hours.Fewer cattle had mud/manure problems than in1999.More cattle were polled than in 1999.“The reduction in the incidence of horns is apositive development because horns can causesubstantial bruising to other animals in pens <strong>and</strong> ontrucks,” says Lynn Delmore, California PolytechnicState University. “Horns can also result in headcondemnations during postmortem inspectionsbecause they have to be removed to allow the hide tobe removed properly. This exposes the sinus cavity tohair <strong>and</strong> other foreign materials that violate the zerotolerance st<strong>and</strong>ards.”More cattle had no br<strong>and</strong>s than in 1999. Thepresence of br<strong>and</strong>s causes devaluation of hides,particularly if the br<strong>and</strong> is located on the ribs.92% of the cattle in the 2007 audit had ID(predominantly back tags), so traceability wasimproved.The majority of dairy cattle were Holsteins.97% of the cattle had no evidence of cancer eye(an improvement over 1999 <strong>and</strong> 1994).More dairy <strong>and</strong> beef cows were in leanercondition.Fewer cattle had inadequate muscle scores.Fewer cattle had bruises than in 1994 <strong>and</strong> 1999.This is a positive trend because bruises requiretrimming in varying degrees depending on theseverity of the bruise.Overall 94% of the cattle had no evidence ofinjection-site blemishes, but 11% of dairy cowshad visible injection-site blemishes.Fewer cattle had arthritic joints than in 1999.This is a very positive trend because packersare required to remove all tissue associated witharthritic stifle joints. Fewer arthritic joints equalless trim loss.12 <strong>National</strong> <strong>Market</strong> <strong>Cow</strong> <strong>and</strong> <strong>Bull</strong> <strong>Beef</strong> <strong>Quality</strong> <strong>Audit</strong>
No buckshot or birdshot was observed during theaudit, although it is still a packer concern.Fewer cows were pregnant at harvest than in 1999.<strong>Cow</strong>s <strong>and</strong> bulls were heavier than in 1999.<strong>Cow</strong>s <strong>and</strong> bulls had a lower fat thickness than in1999.Majority of cows had a muscle score of 1 or 2.More cows had desirable fat color scores of 1 <strong>and</strong>2 (whiter color) than in 1999 or 1994.Initiatives for Improvement:1) The cattle industry needs to reduce the use ofelectric prods <strong>and</strong> provide training in low stresscattle management in order to minimize theaggressive use of driving aids when movingcattle off of trailers <strong>and</strong> when moving cattle to arestrainer or knock box.65% of the plants used the electric prod on morethan 25% of the animals.2) Improvements are needed to lessen the incidenceof cattle slipping when unloading.3) Continued improvement is needed in separatingcattle by gender.4) More knots in the shoulder than in the neckindicates a need for continued education about theproper way to administer animal-health products;most of these products need to be administeredsubcutaneously rather than intramuscularly whenboth routes are approved. Because the NCBAencourages producers to administer products inthe neck, knots in this region are not counted asquality defects.5) More heads <strong>and</strong> livers were condemned.6) All producers should realize that the animal careguidelines adopted by the <strong>National</strong> <strong>Cattle</strong>men’s<strong>Beef</strong> Association apply to the h<strong>and</strong>ling <strong>and</strong> care ofall cull animals.Culling<strong>Dairy</strong> producers should market cull cattle in atimely <strong>and</strong> appropriate manner, long before their cattlebecome too thin or too lame for transport.Culling dates for dairy cattle are often set dueto production level. Culling can be dependent on acertain time in the lactation cycle. <strong>Dairy</strong> producerswho use the <strong>Dairy</strong> Records Management System(DRMS) observe the condition of their cattle at calving,first breeding, just past mid-lactation, <strong>and</strong> at dry-off.<strong>Dairy</strong> producers should use those opportunities tocoordinate culling with better management practices tomaximize the quality of cull animals.<strong>Dairy</strong> producers should conduct frequentobservation of their cattle to prevent loss of bodycondition to the point where the animal is emaciated.Sudden changes in body condition are an alert tohealth problems such as twistedstomachs, parasites, <strong>and</strong>respiratory infections.<strong>Dairy</strong> producers needto be aware of the liabilityconnected with selling animalsthat have been exposedto drugs, insecticides <strong>and</strong>wormers <strong>and</strong> set marketdates that allow for therecommended withdrawaltime, so that any violativeresidue dissipates before theanimal is marketed.<strong>Market</strong> dairy cattle witha body condition score below2.5 should be considered fora reconditioning program toincrease muscle <strong>and</strong> fat depositionprior to marketing. When marketed, these cattle needto possess sufficient soundness for transport <strong>and</strong> sale.Point ofImprovementContinuously monitorherd health. It’s in yourbest interest to observethe health of your cowherd, <strong>and</strong> to ensure youmarket cows <strong>and</strong> bullsbefore they become toocompromised to make thetrip to town.<strong>Dairy</strong> <strong>Cattle</strong> <strong>Edition</strong> 13
Point ofImprovementPrevent quality defects.Things like bruises,injection-site lesions,improperly placedbr<strong>and</strong>s, dark cutters,or cattle that are toothin or too fat, haveinadequate musclingcaused by emaciation– are preventable.Transport <strong>and</strong> h<strong>and</strong>ling of animalsAll persons involved in the h<strong>and</strong>ling <strong>and</strong>transport of beef <strong>and</strong> dairy animals should follow theguidelines defined in the Master <strong>Cattle</strong> Transporterprogram.Judicious use of driving aids such as electricprods (electric prods) is always recommended.Truckers should receive more training.Risk management <strong>and</strong> informationmanagement<strong>Dairy</strong> producers should maintain recordkeepingsystems to verify their Best Management Practices(BMP). Production records should document theuse of animal health products as well as the animalhusb<strong>and</strong>ry practices that have beenemployed prior to the animals beingmarketed.The result will be a decreasein liability for issues that may occurafter harvest. And, integration ofexisting ID systems will improvetraceability of the product, such asthe integration of tag numbers <strong>and</strong>visual animalID tags.Four Primary DirectivesParticipants at the StrategyWorkshop also developedfour primary directives for theimprovement of cow <strong>and</strong> bull beef.These include:1.) Be proactive to ensure the safety <strong>and</strong>integrity of your productConsumer confidence is one of the mostimportant issues facing today’s beef industry.<strong>Market</strong> cows <strong>and</strong> bulls must be free of chemical<strong>and</strong> physical hazards when they are shipped forharvest. Additionally, both dairy <strong>and</strong> beef producersmust do their part to reduce the incidence ofpathogens in the beef supply. Producers, by theirefforts alone, cannot eliminate the occurrence ofpathogens in the beef supply. However, they canplay an important role in reducing the incidence ofpathogenic organisms in or on beef by maintainingbiosecurity <strong>and</strong> cleanliness of animal facilities <strong>and</strong> bykeeping market cows <strong>and</strong> bulls as clean as possible.Injectable pharmaceuticals must beadministered using recommended guidelinesregarding location <strong>and</strong> route of administration,dosage <strong>and</strong> specified withdrawal time to ensurecattle are free of antibiotic <strong>and</strong> other violativeresidues. Following proper industry guidelines alsowill minimize the occurrence of injection-site lesionsin whole muscle products entering the beef trade.Producers cannot risk leaving broken needlesin the muscle tissue of cattle that ultimately willenter the human food supply <strong>and</strong> must develop aprotocol for removing needles should they break-offinto the muscle tissue when treating/vaccinatingcattle. Producers also must be aware of the growingconcern regarding adulteration of beef productswith birdshot <strong>and</strong> buckshot. Use of shotguns togather cattle must be prohibited. Moreover, efforts ofcattlemen to identify sources of birdshot/buckshotby hunters <strong>and</strong> others should be intensified.2.) Closely monitor herd health <strong>and</strong> market cullcattle timely <strong>and</strong> appropriatelyDiseases <strong>and</strong> injuries are common in maturecattle <strong>and</strong> cannot always be prevented or corrected.In such cases, producers must intervene promptly<strong>and</strong> appropriately to prevent suffering of afflictedanimals <strong>and</strong> to maintain product quality <strong>and</strong> safety.Producers should closely monitor their herdsfor serious conditions such as cancer eye, arthritis<strong>and</strong> severe structural problems or injuries, lumpjaw, advanced abscesses, chronic illness <strong>and</strong>emaciation. Euthanasia should be considered fordisposing of “downers” or cattle with advanced orterminal disease conditions. Euthanasia may bemore responsible <strong>and</strong> humane than transporting anafflicted animal to a processing plant in an effort touse it for human consumption.Producers can reduce marketing lossesassociated with advanced stages of cancer eye byearly detection <strong>and</strong> correction of the problem. Longterm,cattlemen should consider genetic strategies(such as EPD development or marker-assistedselection) for reducing the occurrence of cancer eyein breeds that are most susceptible to the problem.Finally, the incidence of severe cases of cancer eyewould decrease if producers would refuse to sell,<strong>and</strong> packers would refuse to buy, cattle that haveadvanced cancer eye lesions.<strong>Market</strong>ing losses associated with arthritis<strong>and</strong> the considerable carcass trim loss that resultsfrom removal of arthritic joints also can be reducedby early detection <strong>and</strong> intervention. Other actionsthat producers may consider include training of allpersonnel to avoid causing injuries to cattle, selection14 <strong>National</strong> <strong>Market</strong> <strong>Cow</strong> <strong>and</strong> <strong>Bull</strong> <strong>Beef</strong> <strong>Quality</strong> <strong>Audit</strong>
for structural correctness, <strong>and</strong> improvement of flooring<strong>and</strong> housing in production facilities (particularly dairies)to reduce the incidence <strong>and</strong> severity of arthritic joints.3.) Use appropriate management <strong>and</strong> h<strong>and</strong>lingpractices to prevent quality defectsA number of quality defects – such as bruises,injection-site lesions, improperly placed br<strong>and</strong>s,dark cutters, cattle that are too thin or too fat, <strong>and</strong>inadequate muscling caused by emaciation – aremanageable <strong>and</strong> can be prevented.Producers should implement a quality assuranceprogram <strong>and</strong> use “best” management <strong>and</strong> h<strong>and</strong>lingpractices to reduce the incidence of such qualitydefects.Bruising of market cows <strong>and</strong> bulls represents asignificant source of marketing losses to producers.Producers can reduce the incidence of bruises by notovercrowding cattle in alleyways, chutes <strong>and</strong> trailers;minimizing the use of prods <strong>and</strong> whips; selectingagainst wild or temperamental cattle; training peopleat all points in the marketing chain with respect toproper cattle h<strong>and</strong>ling techniques; eliminating horns;moving cattle slowly to <strong>and</strong> from pens; properlydesigning <strong>and</strong> maintaining facilities; <strong>and</strong> improvingtransportation methods.4.) Recognize <strong>and</strong> optimize the value of yourmarket cows <strong>and</strong> bullsIn 1999, returns from the sale of market cows <strong>and</strong>bulls represented approximately 16% of total returns tothe average beef cow/calf operation <strong>and</strong> about 4% oftotal returns for the average dairy operation.<strong>Cattle</strong>-Fax reported a $36.19/cow profit in 1999.However, without proceeds from the sale of marketcows, the average commercial cow-calf producer wouldhave lost $22.35 per cow in 1999.The perception of many beef <strong>and</strong> dairy producersis that market cows <strong>and</strong> bulls are simply culls ratherthan an important food source. However, beef frommarket cows <strong>and</strong> bulls are widely used in the retail <strong>and</strong>food service sectors in a variety of product forms – notjust as ground beef.It is important that producers begin to view theirmarket cows <strong>and</strong> bulls as valuable contributors tothe beef supply. During the Strategy Workshop, Dr.Bill Mies of Elanco encouraged producers to have thesame mindset when selling market cows <strong>and</strong> bulls thatthey have when they are trading for a new pickup truck.“Most people will clean up an old pickup truck toadd value to it before trading it in on a newer model,”says Mies. “The same is not true for most producerswhen selling cows <strong>and</strong> bulls.”Producers should identify opportunities to addvalue to their market cows <strong>and</strong> bulls.For example, it may be possible to feed cows for ashort period prior to marketing to increase weight <strong>and</strong>improve body condition <strong>and</strong> carcass characteristics.This brief feeding period may also help identifyobviously ill cattle that should be rendered.Moreover, small operators may be able to exp<strong>and</strong>marketing opportunities by pooling cattle resources<strong>and</strong> forming cooperative marketing agreements.Livestock auction markets can play an integral role inthe development of exp<strong>and</strong>ed marketing opportunitiesfor producers.To facilitate implementation of the four directives,participants in the 1999 Strategy Workshop developeda <strong>Quality</strong> Assurance <strong>Market</strong>ing code of Ethics for useby cattlemen, dairymen, <strong>and</strong> packers when it comes tomarketing cows <strong>and</strong> bulls.QUALITY ASSURANCEMARKETING CODE OF ETHICS1. I will only participate in marketing cattle that:Do not pose a known public health threatHave cleared proper withdrawal timesDo not have a terminal condition (including advancedlymphosarcoma, septicemia, etc.)Are not disabledAre not severely emaciatedDo not have uterine/vaginal prolapses with visiblefetal membraneDo not have advanced eye lesionsDo not have advanced Lumpy Jaw2. Furthermore, I will:Do everything possible to humanely gather, h<strong>and</strong>le <strong>and</strong>transport cattle in accordance with accepted animalhusb<strong>and</strong>ry practices.3. Finally, I will:Humanely euthanize cattle when necessary to preventsuffering <strong>and</strong> to protect public health.If producers fail to adopt a proactive positionconcerning product quality <strong>and</strong> integrity, the availabilityof antimicrobials <strong>and</strong> the approval of new animalhealthproducts could be jeopardized, higher costsassociated with residue monitoring systems couldbe incurred, the number of market outlets coulddecrease, <strong>and</strong> the beef industry could be forced tocomply with an unwieldy <strong>and</strong> expensive nationalanimal identification system designed <strong>and</strong> m<strong>and</strong>atedby regulatory agencies.<strong>Dairy</strong> <strong>Cattle</strong> <strong>Edition</strong> 15
<strong>National</strong> <strong>Cattle</strong>men’s <strong>Beef</strong> Association9110 East Nichols Avenue, Suite 300Centennial, Colorado 80112303.694.0305