A novel Data Envelopment Analysis model for ... - IngentaConnect
A novel Data Envelopment Analysis model for ... - IngentaConnect
A novel Data Envelopment Analysis model for ... - IngentaConnect
- No tags were found...

Create successful ePaper yourself
Turn your PDF publications into a flip-book with our unique Google optimized e-Paper software.
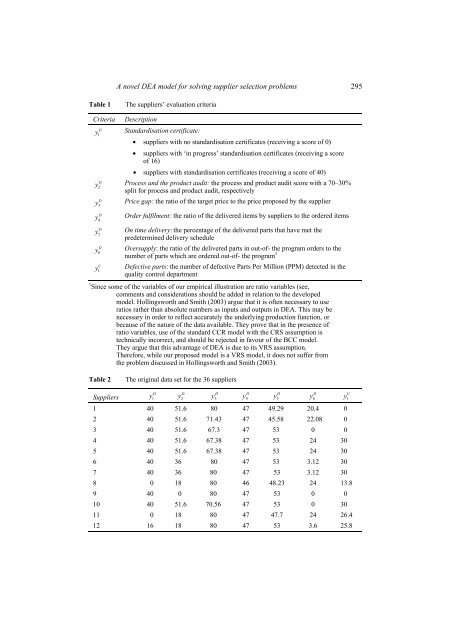
A <strong>novel</strong> DEA <strong>model</strong> <strong>for</strong> solving supplier selection problems 295Table 1The suppliers’ evaluation criteriaCriteriaDescriptionDy Standardisation certificate:1• suppliers with no standardisation certificates (receiving a score of 0)• suppliers with ‘in progress’ standardisation certificates (receiving a scoreof 16)• suppliers with standardisation certificates (receiving a score of 40)Dy Process and the product audit: the process and product audit score with a 70–30%2split <strong>for</strong> process and product audit, respectivelyDy Price gap: the ratio of the target price to the price proposed by the supplier3Dy Order fulfilment: the ratio of the delivered items by suppliers to the ordered items4Dy On time delivery: the percentage of the delivered parts that have met the5predetermined delivery scheduleDy Oversupply: the ratio of the delivered parts in out-of- the program orders to the6number of parts which are ordered out-of- the program 1Uy1Defective parts: the number of defective Parts Per Million (PPM) detected in thequality control department1 Since some of the variables of our empirical illustration are ratio variables (see,comments and considerations should be added in relation to the developed<strong>model</strong>. Hollingsworth and Smith (2003) argue that it is often necessary to useratios rather than absolute numbers as inputs and outputs in DEA. This may benecessary in order to reflect accurately the underlying production function, orbecause of the nature of the data available. They prove that in the presence ofratio variables, use of the standard CCR <strong>model</strong> with the CRS assumption istechnically incorrect, and should be rejected in favour of the BCC <strong>model</strong>.They argue that this advantage of DEA is due to its VRS assumption.There<strong>for</strong>e, while our proposed <strong>model</strong> is a VRS <strong>model</strong>, it does not suffer fromthe problem discussed in Hollingsworth and Smith (2003).Table 2The original data set <strong>for</strong> the 36 suppliersSuppliersDDDDDDUy1y2y3y4y5y6y11 40 51.6 80 47 49.29 20.4 02 40 51.6 71.43 47 45.58 22.08 03 40 51.6 67.3 47 53 0 04 40 51.6 67.38 47 53 24 305 40 51.6 67.38 47 53 24 306 40 36 80 47 53 3.12 307 40 36 80 47 53 3.12 308 0 18 80 46 48.23 24 13.89 40 0 80 47 53 0 010 40 51.6 70.56 47 53 0 3011 0 18 80 47 47.7 24 26.412 16 18 80 47 53 3.6 25.8