2012 Full Year Results Press Release - UBA Plc
2012 Full Year Results Press Release - UBA Plc
2012 Full Year Results Press Release - UBA Plc
- No tags were found...

Create successful ePaper yourself
Turn your PDF publications into a flip-book with our unique Google optimized e-Paper software.
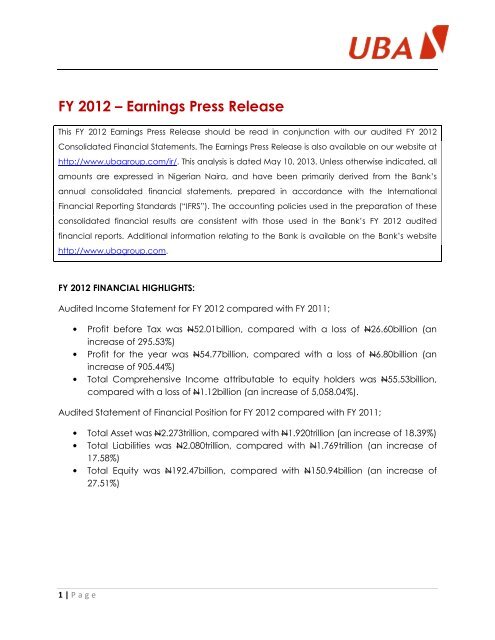
FY <strong>2012</strong> – Earnings <strong>Press</strong> <strong>Release</strong>This FY <strong>2012</strong> Earnings <strong>Press</strong> <strong>Release</strong> should be read in conjunction with our audited FY <strong>2012</strong>Consolidated Financial Statements. The Earnings <strong>Press</strong> <strong>Release</strong> is also available on our website athttp://www.ubagroup.com/ir/. This analysis is dated May 10, 2013. Unless otherwise indicated, allamounts are expressed in Nigerian Naira, and have been primarily derived from the Bank’sannual consolidated financial statements, prepared in accordance with the InternationalFinancial Reporting Standards (“IFRS”). The accounting policies used in the preparation of theseconsolidated financial results are consistent with those used in the Bank’s FY <strong>2012</strong> auditedfinancial reports. Additional information relating to the Bank is available on the Bank’s websitehttp://www.ubagroup.com.FY <strong>2012</strong> FINANCIAL HIGHLIGHTS:Audited Income Statement for FY <strong>2012</strong> compared with FY 2011;• Profit before Tax was N52.01billion, compared with a loss of N26.60billion (anincrease of 295.53%)• Profit for the year was N54.77billion, compared with a loss of N6.80billion (anincrease of 905.44%)• Total Comprehensive Income attributable to equity holders was N55.53billion,compared with a loss of N1.12billion (an increase of 5,058.04%).Audited Statement of Financial Position for FY <strong>2012</strong> compared with FY 2011;• Total Asset was N2.273trillion, compared with N1.920trillion (an increase of 18.39%)• Total Liabilities was N2.080trillion, compared with N1.769trillion (an increase of17.58%)• Total Equity was N192.47billion, compared with N150.94billion (an increase of27.51%)1 | P a g e
FY <strong>2012</strong> (ITEMS OF NOTE)• Comparing FY <strong>2012</strong> with FY 2011, there was a 34.45% increase in gross earnings;representing approximately N56.40billion additional revenue. The bank was ableto keep its total operating expense lower by 3.31% in FY <strong>2012</strong> compared to FY2011.• Non-interest income improved by 21.1% from N50.8billion in FY 2011 toN61.5billion in FY <strong>2012</strong> as a result of the increasing acceptance of our unique feebased products and services which we have successfully deployed across ourfranchise in Africa.FY <strong>2012</strong> FINANCIAL COMPARATIVE ANALYSIS & RATIOS:Financial Metric (N' Billion) FY'12 FY'11 ChangeGross Earnings 220.1 163.7 34.5%Net Interest Income 91.6 68.2 34.3%Non-interest Income 61.5 50.8 21.1%Operating Income 153.1 119.0 28.7%Operating Expenses (102.6) (106.1) +3.3%Profit/(Loss) Before Tax 52.0 (26.6) 295.5%Profit/(Loss) After Tax 54.8 (6.8) 905.4%Basic Earnings Per Share (Kobo) 1.66 (0.29) 672.4%Total Assets 2,272.9 1,920.4 18.4%Total Deposits 1,777.8 1,465.3 21.3%Key Ratios FY'12 FY'11Net Interest Margins 5.9% 4.6%Cost of Funds 3.2% 3.0%Cost-to-Income Ratio 67.0% 89.8%Return on Assets 2.6% (0.4%)Return on Equity 31.9% (4.5%)Loan-to-Deposit Ratio 38.7% 44.2%Liquidity Ratio 69.8% 69.0%Capital Adequacy Ratio 23.5% 21.7%BVPS 584k 467kEPS 166k (29k)Lagos, May 10, 2013 – United Bank for Africa <strong>Plc</strong> (“<strong>UBA</strong>” or “the Bank”) todayannounced its audited financial results for the full year <strong>2012</strong>. A profit of N54.8billion wasachieved for year, representing an increase of 905.4% over the N6.8billion loss recordedin the corresponding period.“The fourth quarter earnings contributed to a strong year for <strong>UBA</strong>,” said Phillips Oduoza,Group Managing Director and Chief Executive Officer. “<strong>UBA</strong>’s gross earnings for theyear were more than N220 billion, with all our businesses contributing to gross earningsgrowth. We achieved those results despite a tough operating environment,demonstrating the strength and resilience of our business model.”“<strong>UBA</strong> had a strong year in <strong>2012</strong>. Our success was again driven by the strength of ourcustomer-focused, Corporate and Treasury driven business model. We are confidentabout our ability to deliver sustainable earnings growth in the future. We will continue tostrategically invest in our businesses, manage our expenses and contain cost growth,whilst continually seeking ways to exceed expectations.”“As always, our employees and their dedication to our customers and clients remainsthe driving force behind our success and I thank them for their tremendouscontributions” said Mr. Oduoza.2 | P a g e
Consolidated and Separate Statement of Comprehensive IncomeFor the year ended 31 DecemberIn millions of Nigerian NairaGroup Parent Group Parent<strong>2012</strong>2011Interest and similar income 150,003 126,147 113,590 97,427Interest and similar expense (58,386) (51,302) (45,423) (41,203)Net interest income 91,617 74,845 68,167 56,224Net fee and commission income 45,108 34,212 38,660 28,726Net trading income/(loss) 9,695 9,254 3,546 (2,563)Other operating income 6,673 6,045 8,596 2,763Operating income 153,093 124,356 118,969 85,150Net impairment loss on loans and receivables (4,560) (2,654) (17,738) (8,180)Net gains/(losses) on investment securities 6,123 (129) (1,865) (1,460)Loss on loans sold to Asset Management Corporation of Nigeria - AMCON - - (19,894) (19,894)Net operating income 154,656 121,573 79,472 55,616Personnel expenses (43,452) (32,999) (47,874) (38,103)Depreciation and amortisation (10,888) (6,903) (10,500) (8,239)Other operating expenses (48,252) (35,491) (47,730) (35,742)Total operating expenses (102,592) (75,393) (106,104) (82,084)Share of (loss)/profit of equity accounted investee (54) - 32 -Profit/(loss) before income tax 52,010 46,180 (26,600) (26,468)Taxation (charge)/credit (533) 1,195 17,935 18,502Profit/(loss) for the year from continuing operations 51,477 47,375 (8,665) (7,966)Profit for the year from discontinued operations 3,289 - 1,864 -Profit/(loss) for the year 54,766 47,375 (6,801) (7,966)Other comprehensive incomeForeign currency translation differences (2,999) - 1,607 -Fair value gains on available-for-sale investments 3,763 3,534 4,073 4,212Other comprehensive income 764 3,534 5,680 4,212Total comprehensive income/(loss) for the year 55,530 50,909 (1,121) (3,754)Profit attributable to:Owners of Parent 54,664 47,375 (7,651) (7,966)Non-controlling interest 102 - 850 -Profit/(loss) for the year 54,766 47,375 (6,801) (7,966)Total comprehensive income attributable to:Owners of Parent 55,306 50,909 (1,971) (3,754)Non-controlling interest 224 - 850 -Total comprehensive income for the year 55,530 50,909 (1,121) (3,754)Earnings per share from continuing and discontinued operationsattributable to owners of the parent during the yearBasic earnings/(loss) per share (Naira)From continuing operations 1.66 1.44 (0.29) (0.24)From discontinued operations 0.11 - 0.06 -From profit for the year 1.77 1.44 (0.23) (0.24)Diluted earnings/(loss) per share (Naira)From continuing operations 1.66 1.44 (0.29) (0.24)From discontinued operations 0.11 - 0.06 -From profit for the year 1.77 1.44 (0.23) (0.24)3 | P a g e
Consolidated and Separate Statement Statement of Financial of Financial Position PositionGroupGroupParentParentGroupGroupParentParentGroupGroupParentParentAsAsatat31 December31 December<strong>2012</strong><strong>2012</strong>31 December31 December201120111 January1 January20112011In millions of Nigerian NairaIn millions of Nigerian NairaASSETSASSETSCash and bank balances 714,115 629,481 434,218 352,500 385,397 330,701CashFinancialand bankassetsbalancesheld for trading714,115457629,481456434,2181,303352,500237385,3972,594330,7011,267FinancialLoans andassetsadvancesheld fortotradingbanks45728,51345627,8781,30341,56423741,5642,59411,2261,26711,226LoansLoansandandadvancesadvancestotobankscustomers28,513658,92227,878570,71441,564605,62741,564552,52611,226590,79711,226557,224LoansInvestmentand advancessecuritiesto customers 658,922680,817570,714527,994605,627722,308552,526560,028590,797493,079557,224391,461Investment Other assets securities 680,817 18,598 527,994 11,159 722,308 16,513 560,028 16,891 493,079 30,290 391,461 24,877Other Investments assets in equity accounted investee 18,598 - 11,159 - 16,513 10,356 16,891 10,843 30,290 10,118 24,877 10,843Investments Investments in in equity subsidiaries accounted investee - - -66,727 10,356 - 10,843 56,695 10,118- 10,843 50,355Investments Property and in subsidiaries equipment -70,746 66,727 63,118 -55,618 56,695 47,066 62,009 - 50,355 53,263Property Intangible and assets equipment 70,7467,568 63,118 1,578 55,618 5,930 47,066 2,099 62,009 6,626 53,263 2,952Intangible Deferred assets tax assets 7,568 29,624 1,578 28,152 5,930 26,998 2,099 25,604 6,626 7,049 2,952 6,555Deferred tax assets 29,624 2,209,360 28,152 1,927,257 26,998 1,920,435 25,604 1,666,053 1,599,185 7,049 1,440,724 6,555Non-current assets held for distribution 2,209,360 63,563 1,927,257 5,808 1,920,435 - 1,666,053 - 1,599,185- 1,440,724 -Non-current TOTAL ASSETS assets held for distribution 63,563 2,272,923 1,933,065 5,808 1,920,435 - 1,666,053 - 1,599,185 - 1,440,724 -TOTAL ASSETS 2,272,923 1,933,065 1,920,435 1,666,053 1,599,185 1,440,724LIABILITIESLIABILITIESDerivative liabilities 124 124 817 817 9,310 9,310Derivative Deposits from liabilities banks 124 57,780 124 22,875 817 19,510 817 23,408 9,310 7,456 9,31051Deposits from from banks customers 57,780 1,720,008 22,875 1,461,131 19,510 1,445,822 23,408 1,216,511 1,270,409 7,456 1,120,566 51Deposits Managed from funds customers 1,720,008 - 1,461,131 - 1,445,822 51,943 1,216,511 - 1,270,409 32,753 1,120,566 -Managed Other liabilities funds -81,438 -57,299 51,943 58,210 49,924 - 32,753 41,671 38,782 -Other Current liabilities tax liabilities 81,4381,274 57,299 1,325 58,210 2,627 49,924784 41,671 2,869 38,782 1,185Current Subordinated tax liabilities liabilities 1,274 53,719 1,325 55,474 2,627 53,500 784 55,254 2,869 18,335 1,185 20,147Subordinated Borrowings liabilities 53,719 114,520 55,474 114,520 53,500 137,040 55,254 137,040 18,335 63,327 20,147 63,327Borrowings Deferred tax liabilities 114,520 59 114,520 - 137,040 26 137,040 - 63,32730 63,327 -Deferred tax liabilities 2,028,922 59 1,712,748 - 1,769,495 26 1,483,738 - 1,446,160 30 1,253,368 -Liabilities held for distribution 2,028,922 51,534 1,712,748 - 1,769,495 - 1,483,738 - 1,446,160- 1,253,368 -Liabilities TOTAL LIABILITIES held for distribution 51,534 2,080,456 1,712,748 - 1,769,495 - 1,483,738 - 1,446,160 - 1,253,368 -TOTAL LIABILITIES 2,080,456 1,712,748 1,769,495 1,483,738 1,446,160 1,253,368EQUITYEQUITYShare capital Share capital premium16,49116,491 107,93216,49116,491 107,93216,16816,168 108,25516,16816,168 108,25512,93412,934 111,48912,93412,934 111,489Share Retained premium earnings 107,932 49,572 107,932 47,723 108,255 16,034 108,255 21,474 111,489 25,695 111,489 30,727Retained Other reserves earnings 49,572 15,111 47,723 48,171 16,034 6,888 21,474 36,418 25,69510 30,727 32,206Other EQUITY reserves ATTRIBUTABLE TO OWNERS15,111 48,171 6,888 36,418 10 32,206EQUITY OF THE ATTRIBUTABLE PARENT TO OWNERSOF THE PARENT189,106189,106220,317220,317147,345147,345182,315182,315150,128150,128187,356187,356Non-controlling interests 3,361 - 3,595 - 2,897 -Non-controlling TOTAL EQUITY interests 3,361 192,467 220,317 - 3,595 150,940 182,315 - 153,025 2,897 187,356 -TOTAL EQUITY 192,467 220,317 150,940 182,315 153,025 187,356TOTAL LIABILITIES AND EQUITY 2,272,923 1,933,065 1,920,435 1,666,053 1,599,185 1,440,724TOTAL LIABILITIES AND EQUITY 2,272,923 1,933,065 1,920,435 1,666,053 1,599,185 1,440,7244 | P a g e
Conclusion“<strong>UBA</strong> had a good performance for full year <strong>2012</strong>. This performance puts us in a positionto commence our journey back to industry leadership, thereby, setting the stage for theattainment of our long term strategic intent of being a leading Bank on the Africancontinent. <strong>UBA</strong> has continued to focus on customer service delivery, efficient capitalmanagement and returns maximization with return on equity exceeding 30 per cent in<strong>2012</strong>. We believe that our ability to serve clients globally with solutions tailored to theirneeds gives us a strong advantage in today’s rapidly changing and highly competitivemarket place. Adopting a unique business platform across Africa, as a group, has alsoensured that we present a single face to our customers and clients around Africa. Thisdoes not only help foster collaboration throughout the Group, it also strengthens ourability to deliver value adding and innovative solutions to our customers and clientsthrough our integrated model.Our ability to deliver tailored financial solutions based on high-value customizedproducts and services sets us apart from our peers.I am pleased to say that we remain committed to achieving our targets for 2013 andespecially, our long term aspirations of being the leading financial services institution inAfrica”.5 | P a g e
PRESENTATION OF FINANCIAL RESULTS – TELECONFERENCE CALL INVITATIONPlease accept our invitation to attend a teleconference call with our topManagement, as they present the full year <strong>2012</strong> audited financial report.The results presentation can be downloaded from the <strong>UBA</strong> Group website in themorning of Friday May 17, 2013, via the following link: http://www.ubagroup.com/ir/Kindly dial-in five minutes before start time. <strong>Full</strong> detail of the call is shown below.CONFERENCE CALL DETAILSConference NameChairperson's NameAdditional Speakers<strong>UBA</strong>’s FY <strong>2012</strong> <strong>Results</strong> PresentationPhillips Oduoza (Group Managing Director/CEO)Ugochukwu Nwaghodoh (Group Chief Financial Officer)In attendanceKennedy Uzoka (DMD), Emmanuel Nnorom (CEO, <strong>UBA</strong> Africa), DanOkeke (ED, Abuja & East Bank), A.J Bello (ED, Far North), EmekeIweriebor (Group Director, Corporate Banking, Lagos and West Bank);Ayodeji Adigun (Director of Strategy); Kayode Fadahunsi (Director,Investor Relations)Call Date Friday May 17, 2013Call Time15:00 Dublin, Edinburgh, London, LisbonDuration (hh:mm) 01:00Required participantInformationName, CompanyHost Dial In Number +44 (0) 20 3023 4484Participant Dial InNumber(s)Password0 800 980 512 - South Africa Toll Free+44 (0) 20 3003 2666 - Standard International Access0808 109 0700 - UK Toll Free1 866 966 5335 - USA Toll Free<strong>UBA</strong>6 | P a g e
EDITOR’S COMMENTUnited Bank for Africa <strong>Plc</strong> is one of Africa's leading financial institutions offering bankingservices to more than 7 million customers across 558 branches in 19 African countries.With presence in New York, London and Paris, <strong>UBA</strong> is connecting people and businessesacross Africa through retail, commercial and corporate banking, innovative crossborder payments, trade finance and investment banking.CAUTION REGARDING FORWARD LOOKING STATEMENTSFrom time to time, the Bank makes written and/or oral forward-looking statements,including in this press release and in other communications. In addition, representativesof the Bank may make forward-looking statements orally to analysts, investors, themedia and others. All such statements are intended to be forward looking statements.Forward looking statements include, but are not limited to, statements regarding theBank’s objectives and priorities for 2013 and beyond and strategies to achieve them,and the Bank’s anticipated financial performance. Forward looking statements aretypically identified by words such as “will”, “should”, “believe”, “expect”, “anticipate”,“intend”, “estimate”, “may” and “could”.By their very nature, these statements require the Bank to make assumptions and aresubject to inherent risks and uncertainties, general and specific. Especially in light of theuncertainty related to the financial, economic and regulatory environments, such risksand uncertainties – many of which are beyond the Bank’s control and the effects ofwhich are difficult to predict – may cause actual results to differ materially from theexpectations expressed in the forward-looking statements. Risk factors that could causesuch differences include: credit, market (including equity, commodity, foreignexchange, and interest rate), liquidity, operational, reputational, insurance, strategic,regulatory, legal, environmental, and other risks. All such factors should be consideredcarefully, as well as other uncertainties and potential events, and the inherentuncertainty of forward looking statements, when making decisions with respect to theBank and we caution readers not to place undue reliance on the Bank’s forwardlooking statements.Any forward looking statements contained in this presentation represent the views ofmanagement only as of the date hereof and are presented for the purpose of assistingthe Bank’s investors and analysts in understanding the Bank’s financial position,objectives and priorities and anticipated financial performance as at and for theperiods ended on the dates presented, and may not be appropriate for otherpurposes. The Bank does not undertake to update any forward-looking statements,whether written or oral, that may be made from time to time by or on its behalf, exceptas required under applicable securities legislation7 | P a g e