EXAM I STUDY GUIDE – STAT 226 Introduction Descriptive ...
EXAM I STUDY GUIDE – STAT 226 Introduction Descriptive ...
EXAM I STUDY GUIDE – STAT 226 Introduction Descriptive ...

You also want an ePaper? Increase the reach of your titles
YUMPU automatically turns print PDFs into web optimized ePapers that Google loves.
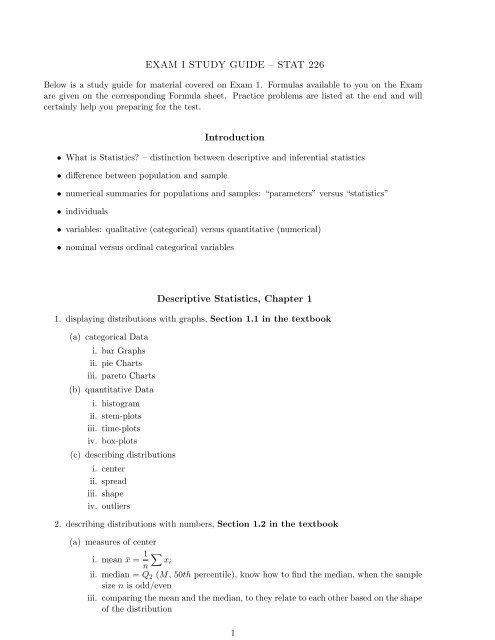
<strong>EXAM</strong> I <strong>STUDY</strong> <strong>GUIDE</strong> <strong>–</strong> <strong>STAT</strong> <strong>226</strong>Below is a study guide for material covered on Exam 1. Formulas available to you on the Examare given on the corresponding Formula sheet. Practice problems are listed at the end and willcertainly help you preparing for the test.<strong>Introduction</strong>• What is Statistics? <strong>–</strong> distinction between descriptive and inferential statistics• difference between population and sample• numerical summaries for populations and samples: “parameters” versus “statistics”• individuals• variables: qualitative (categorical) versus quantitative (numerical)• nominal versus ordinal categorical variables<strong>Descriptive</strong> Statistics, Chapter 11. displaying distributions with graphs, Section 1.1 in the textbook(a) categorical Datai. bar Graphsii. pie Chartsiii. pareto Charts(b) quantitative Datai. histogramii. stem-plotsiii. time-plotsiv. box-plots(c) describing distributionsi. centerii. spreadiii. shapeiv. outliers2. describing distributions with numbers, Section 1.2 in the textbook(a) measures of centeri. mean ¯x = 1 n∑xiii. median = Q 2 (M, 50th percentile), know how to find the median, when the samplesize n is odd/eveniii. comparing the mean and the median, to they relate to each other based on the shapeof the distribution1
• 2.31, 2.33, 2.37, 2.41,• 2.69, 2.70, 2.71, 2.73, 2.79, 2.874