1Q Unaudited Financial Statement Announcement - SC Global ...
1Q Unaudited Financial Statement Announcement - SC Global ...
1Q Unaudited Financial Statement Announcement - SC Global ...

Create successful ePaper yourself
Turn your PDF publications into a flip-book with our unique Google optimized e-Paper software.
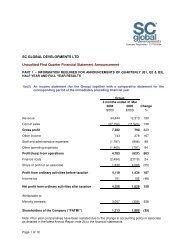
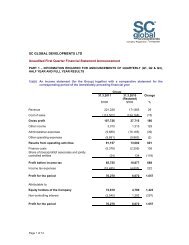
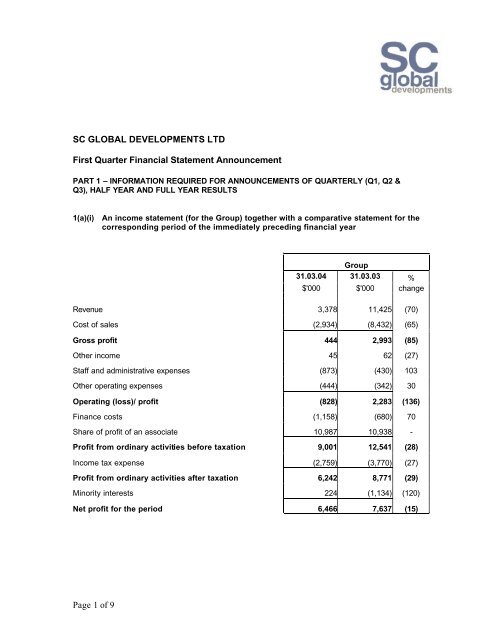
<strong>SC</strong> GLOBAL DEVELOPMENTS LTDFirst Quarter <strong>Financial</strong> <strong>Statement</strong> <strong>Announcement</strong>PART 1 – INFORMATION REQUIRED FOR ANNOUNCEMENTS OF QUARTERLY (Q1, Q2 &Q3), HALF YEAR AND FULL YEAR RESULTS1(a)(i) An income statement (for the Group) together with a comparative statement for thecorresponding period of the immediately preceding financial yearGroup31.03.04 31.03.03 %$'000 $'000 changeRevenue 3,378 11,425 (70)Cost of sales (2,934) (8,432) (65)Gross profit 444 2,993 (85)Other income 45 62 (27)Staff and administrative expenses (873) (430) 103Other operating expenses (444) (342) 30Operating (loss)/ profit (828) 2,283 (136)Finance costs (1,158) (680) 70Share of profit of an associate 10,987 10,938 -Profit from ordinary activities before taxation 9,001 12,541 (28)Income tax expense (2,759) (3,770) (27)Profit from ordinary activities after taxation 6,242 8,771 (29)Minority interests 224 (1,134) (120)Net profit for the period 6,466 7,637 (15)Page 1 of 9
1(a)(ii) Additional information to Income <strong>Statement</strong>:Other income includes:Group31.03.04 31.03.03 %$'000 $'000 changeInterest income 102 20 nmLoss on foreign exchange (57) - nmSales forfeiture penalty - 39 nmGain on disposal of other financial assets - 3 nm45 62 (27)Other operating expenses include:Depreciation of property, plant and equipment 110 77 43Sales & promotion expenses 106 - nmMaintenance and service charges 168 212 (21)Operating lease expenses 60 80 (25)Impairment loss written back on other financial assets - (27) nm444 342 30Income taxesCurrent year tax expense - 682 nmDeferred tax expense (491) (142) nmShare of an associate's taxation 3,250 3,230 -2,759 3,770 (27)The Group tax was higher than the amount determined by applying the statutory rate of income taxto the operating profit mainly due to higher tax rate in foreign associated company.nm: not meaningfulPage 2 of 9
1(b)A balance sheet (for the issuer and the group), together with a comparativestatement as at the end of the immediate preceding financial yearGroupCompany31.03.04 31.12.03 31.03.04 31.12.03Non-current assets $'000 $'000 $'000 $'000Property, plant & equipment 9,515 9,278 329 356Investment in subsidiaries - - 48,226 48,226Investment in associate 137,011 131,162 - -146,526 140,440 48,555 48,582Current assetsDevelopment properties 343,483 337,570 - -Trade & other receivables 8,347 12,805 143,578 144,668Cash & cash equivalents 36,964 37,768 4,287 2,536388,794 388,143 147,865 147,204Less: Current liabilitiesBank overdrafts (secured) 5,940 5,624 609 -Trade & other payables 42,859 44,899 4,658 4,289Interest-bearing liabilities 65,463 65,463 35,084 35,084Current tax payable 2,690 2,690 - -116,952 118,676 40,351 39,373Net current assets 271,842 269,467 107,514 107,831418,368 409,907 156,069 156,413Non-current liabilitiesInterest-bearing liabilities 246,621 242,023 66,133 66,151Deferred taxation 4,940 5,431 27 27251,561 247,454 66,160 66,178Minority interests (13,633) (13,857) - -Net assets 153,174 148,596 89,909 90,235Capital & reservesShare capital 47,952 47,952 47,952 47,952Currency translation reserve 27,376 29,264 - -Accumulated profit 77,846 71,380 41,957 42,283153,174 148,596 89,909 90,235Page 3 of 9
1(b)(ii) Aggregate amount of group borrowings and debt securitiesAmount repayable in one year or less, or on demandAs at 31.03.04$’000As at 31.12.03$’000Secured Unsecured Secured Unsecured64,363 1,000 64,363 1,000Amount repayable after one yearAs at 31.03.04$’000As at 31.12.03$’000Secured Unsecured Secured Unsecured246,320 - 241,698 -Details of collateralsBank loan amounting to $86 million is secured by a pledge of the Group’sinvestment in its Associated Company. Other secured borrowings are generallysecured by the borrowing companies’ investment properties, property underdevelopment or developed properties for sale and assignment of all rights andbenefits with respect to the properties. The aggregate carrying value of therelevant underlying assets is approximately $490 million.Page 4 of 9
1(c)A cash flow statement (for the group), together with a comparative statement for thecorresponding period of the immediately preceding financial year31.03.04 31.03.03Operating activities $'000 $'000Profit from operating activities before taxation 9,001 12,541Adjustments for:Depreciation of property, plant and equipment 110 77Gain on disposal of other financial assets - (3)Impairment loss written back on other financial assets - (27)Interest income (102) (20)Interest expense 1,158 680Share of profit of associate (10,987) (10,938)Operating (loss)/profit before working capital changes (820) 2,310Changes in working capital:Development properties (4,977) (11,157)Trade and other receivables 4,458 21,360Trade and other payables (2,040) (3,433)Cash flows from operating activities (3,379) 9,080Investing activities:Interest received 102 20Purchases of property, plant & equipment (347) (211)Proceeds from disposal of other financial assets - 207Acquisition of other financial assets - (154)Cash flows from investing activities (245) (138)Financing activities:Interest paid (2,094) (2,133)Proceeds from/ (repayment of) bank loans 4,622 (4,973)(Payment of)/ proceeds from obligations under finance leases (24) 160Cash flows from financing activities 2,504 (6,946)Net (decrease)/ increase in cash and cash equivalents (1,120) 1,996Cash and cash equivalents at beginning of period 32,144 14,062Cash and cash equivalents at end of period 31,024 16,058Note to Consolidated Cash Flow <strong>Statement</strong>:Cash and cash equivalents included in the consolidated statement of cash flows comprise thefollowing balance sheet amounts:31.03.04 31.03.03$'000 $'000Fixed deposits 30,400 14,006Cash and bank balances 6,564 4,360Bank overdrafts (5,940) (2,308)31,024 16,058Page 5 of 9
1(d)(i) A statement (for the issuer and the group) showing either (i) all changes in equity or(ii) changes in equity other than those arising from capitalisation issues anddistributions to shareholders, together with a comparative statement for thecorresponding period of the immediately preceding financial yearThe GroupShare capitalCurrencyTranslationreserveAccumulatedprofitTotal$'000 $'000 $'000 $'000At 1 January 2003 47,952 (886) 49,895 96,961Net profit for the period - - 7,637 7,637Translation differences relating tofinancial statements of foreign associate - 7,726 - 7,726At 31 March 2003 47,952 6,840 57,532 112,324At 1 January 2004 47,952 29,264 71,380 148,596Net profit for the period - - 6,466 6,466Translation differences relating tofinancial statements of foreign associate (1,888) (1,888)At 31 March 2004 47,952 27,376 77,736 153,174The CompanyAt 1 January 2003 47,952 - 54,765 102,717Net loss for the period - - (369) (369)At 31 March 2003 47,952 - 54,396 102,348At 1 January 2004 47,952 - 42,283 90,235Net loss for the period - - (326) (326)At 31 March 2004 47,952 - 41,957 89,9091(d)(ii) Details of any changes in the company’s share capital arising from rights issue,bonus issue, share buy-backs, exercise of share options or warrants, conversion ofother issues of equity securities, issue of shares for cash or as consideration foracquisition or for any other purpose since the end of the previous period reportedon. State also the number of shares that may be issued on conversion of all theoutstanding convertibles as at the end of the current financial period reported onand as at the end of the corresponding period of the immediately preceding financialyearThere was no change in the company’s issued share capital since 31 December 2003.Page 6 of 9
2. Whether the figures have been audited or reviewed and in accordance with whichauditing standard or practice.The figures have not been audited nor reviewed by the company’s auditors.3. Where the figures have been audited or reviewed, the auditors’ report (including anyqualifications or emphasis of matter)Not applicable4. Whether the same accounting policies and methods of computation as in theissuer’s most recently audited annual financial statements have been appliedThis financial statement has been prepared based on the accounting policies and methodsof computation consistent with those adopted in the most recent audited financial statementfor the year ended 31 December 2003.5. If there are any changes in the accounting policies and methods of computation,including any required by an accounting standard, what has changed, as well as thereasons for, and the effect of, the changeNot applicable.6. Earnings per ordinary share of the group for the current period reported on and thecorresponding period of the immediately preceding financial year, after deductingany provision for preference dividendsGroup31.03.04 31.03.03Earnings per ordinary share for the year 6.74 cents 7.96 cents7. Net asset value (for the issuer and group) per ordinary share based on issued sharecapital of the issuer at the end of the (a) current period and (b) immediatelypreceding financial yearGroupCompany31.03.04 31.12.03 31.03.04 31.12.03Net asset value per ordinary share $1.60 $1.55 $0.94 $0.94Page 7 of 9
8. A review of the performance of the group, to the extent necessary for a reasonableunderstanding of the group’s business. It must include a discussion of thefollowing:-(a)(b)any significant factors that affected the turnover, costs, and earnings of thegroup for the current financial period reported on, including (whereapplicable) seasonal or cyclical factors; andany material factors that affected the cash flow, working capital, assets orliabilities of the Group during the financial period reported on.Group revenue decreased by 70% from $11.4 million to $3.4 million compared to thecorresponding quarter. The decline was due to lower recognition of sales compared to thecorresponding quarter as projects achieved TOP. Revenue from sales achieved in TheBoulevard Residence have progressively been recognized during the quarter.Staff and administrative expenses increased by 103% to $0.9 million mainly due to theincrease in staff strength to manage and undertake marketing and sales of the Group’sportfolio of properties. In addition, other costs from projects which have achieved TOPhave been expensed during the quarter as opposed to being capitalized in thecorresponding quarter last year.The Group’s associate company in Australia, AVJennings Homes Limited, continued tocontribute significantly to the Group’s profit.As a result of the above, profit attributable to shareholders for the period decreased by 15%to $6.5 million.9. Where a forecast, or a prospect statement, has been previously disclosed toshareholders, any variance between it and the actual resultsThe current announced results are in line with the prospect commentary previouslydisclosed to shareholders in the results announcement for the full year ended 31 December2003.10. A commentary at the date of the announcement of the significant trends andcompetitive conditions of the industry in which the group operates and any knownfactors or events that may affect the group in the next reporting period and the next12 monthsThe Singapore economy has shown strong growth in the first quarter of 2004, with GDPincreasing by 7.3% over the same period in 2003. The improvement has also helpedunderpin sentiment in the general residential property market as several property launchesduring the quarter were well receivedThe Group’s associate, AVJennings Home Limited in Australia is expected to continue tocontribute positively to the Group’s profitability.Save as disclosed in this announcement, the Group is not aware of any known factors orevents that may affect the Group’s profitability in the next reporting period or the next 9months.Page 8 of 9
11. Dividend(a) Current <strong>Financial</strong> Period reported on:Any dividend declared for the current financial period reported on?None(b) Corresponding Period of the Immediately Preceding <strong>Financial</strong> YearAny dividend declared for the corresponding period of the immediately precedingfinancial year? None(c) Date payableNot applicable.(d) Books closure dateNot applicable.12. If no dividend has been declared/recommended, a statement to that effectNo dividend has been declared/recommended for the first quarter ended 31 March 2004BY THE ORDER OF THE BOARDFong Keng CheeCompany Secretary28 May 2004Page 9 of 9