Teacher notes - Modeling Physics
Teacher notes - Modeling Physics
Teacher notes - Modeling Physics

You also want an ePaper? Increase the reach of your titles
YUMPU automatically turns print PDFs into web optimized ePapers that Google loves.
UNIT I: Scientific Thinking in Experimental SettingsInstructional Goals1. Experimental designBuild a qualitative modelIdentify and classify variablesMake tentative qualititative predictions about the relationship between variables2. Data CollectionSelect appropriate measuring devicesConsider accuracy of measuring device and significant figuresMaximize range of data3. Mathematical <strong>Modeling</strong>Learn to use Graphical Analysis (Vernier) softwareDevelop linear relationshipsRelate mathematical and graphical expressions.Validate pendulum model4. Lab ReportPresent and defend interpretations.Write a coherent report (See Appendix for suggested format.)©<strong>Modeling</strong> Workshop Project 2006 1 Unit I <strong>Teacher</strong> Notes v2.0
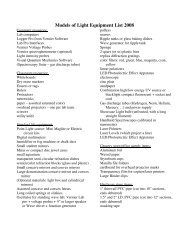
Lab Notes and Instructional CommentsPendulum labApparatus3 masses for bobs (≈ same size and shape, different masses- you can use metal spheres or filmcanisters filled with "BBs".)stringpendulum support and clamp (or equivalent)stop watchesbalance for mass measurementGraphical Analysis (optional)Pre-lab discussion• Set up a support stand from which at least two pendula are swinging. Ask for observations.Request a list of factors that might have an impact on the behavior of the pendula. Accept allsuggestions at first; cull from this list those factors which are not quantifiable (shape of bob ormaterial) or over which you have little or no control (room temperature, gravity). Ask whichobservations are related in order to isolate dependent and independent variables.• The dependent variable is the period of swing (T). Use period rather than frequency to simplifythe data analysis, since T α l and f α 1 . The dependent variable will be graphed on thelvertical axis.• The independent variables are:length (l).mass (m). You should draw a distinction between mass and weight.amplitude (A). You can measure as an angle or a distance from the rest point.• Ask the students to make tentative predictions about how changes in the independent variableswill affect the period.Lab performance <strong>notes</strong>• This is a teacher-directed activity. Each student, however, will produce a separate lab report.Try to involve every student in the class by assigning various tasks.• Pass out stopwatches to as many students as possible to increase involvement and quantity ofdata. Have all students with stopwatches time each trial.• Select a "data recorder" to work at the board.• Emphasize that there must be separate experimental designs for each independent variable.• Use at least three pendulums of different mass, keeping the shape and size identical if possible.• Record data involving each variable separately. This is the time to introduce and discussuncertainty and significant digits. Use SI units only.• PERIOD VS MASS: avoid the term "weight". Emphasize the recording of mass in kilograms.(See Figure 1.)• PERIOD VS AMPLITUDE: record amplitude in meters or degrees. Carefully select amplitudesto avoid large angles. (See Figure 2.)• PERIOD VS LENGTH: record length in meters. Select a wide range of values for length. Besure to collect enough data at short lengths where the curve changes the most. Otherwise,students might conclude that the relationship is linear. It is appropriate to pose the question,"What would the period be if the length were zero?" (See Figure 3.)©<strong>Modeling</strong> Workshop Project 2006 2 Unit I <strong>Teacher</strong> Notes v2.0
PeriodPeriodPeriodMassAmplitudeFig. 1 Fig. 2 Fig. 3LengthAnalysis of DataThis is the appropriate time to review graphical methods with your students. You could have thestudents graph the data in the three experiments by hand as a way to determine their weaknessesand provide remediation. This approach makes students appreciative of the power of graphicalanalysis software. Or, you could introduce Graphical Analysis right away. If you do so, then onthis first set of experiments, do not select regression line for the T vs m, T vs a and T vs l graphs.GA will scale the vertical axis in such a way as to make it appear that the regression line has aslight slope. Instead, have the students sketch the lines (and curve) by hand. On the T vs l data,you will have to point out that on GA, you need to select and make theexponent 0.5 in order to obtain the square root of l.Post-lab discussion• Focus discussion on the scientific method.• Emphasize need to have adequate data quantity and adequate data ranges to get good graphs andto make conclusions.• Discuss graphical versus mathematical models. Show samples of curve fitting. Discuss the fivepercentrule for intercepts. Derive the mathematical model from the graphical representation.• Reiterate the concepts of dependent and independent variables.• Redefine the terms: period, frequency, weight, mass.• Avoid introducing the formal pendulum equation (using "g" and π). It is not the purpose of thislab to derive this relationship.• Discuss and demonstrate proper lab report format.Types of Graphs Suite of labs (Optional)Depending on the availability of equipment and the abilities of your students, you might chooseto perform this set of labs in order to give your students more opportunity to relate the five basictypes of graphical relationships to real lab phenomena. In the interest of time and logistics, haveeach group perform two different experiments (one linear, one curve) and evaluate the data. Inthe post-lab discussion, students can compare results and learn about the phenomena they didn'tdirectly examine.©<strong>Modeling</strong> Workshop Project 2006 3 Unit I <strong>Teacher</strong> Notes v2.0
Reading: Graphical MethodsWorksheet 1Quiz 1Reading: Significant FiguresWorksheet 2Quiz 2ReviewTest©<strong>Modeling</strong> Workshop Project 2006 4 Unit I <strong>Teacher</strong> Notes v2.0