Office Market Snapshot - Cassidy Turley
Office Market Snapshot - Cassidy Turley
Office Market Snapshot - Cassidy Turley

Create successful ePaper yourself
Turn your PDF publications into a flip-book with our unique Google optimized e-Paper software.
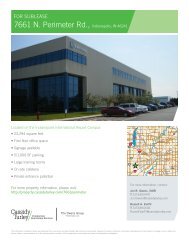
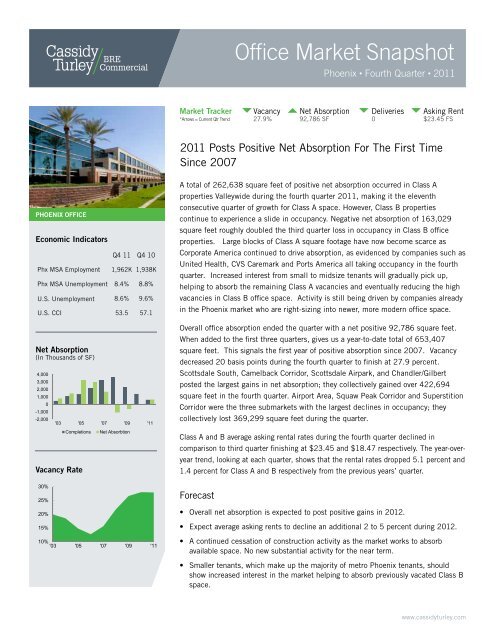
<strong>Office</strong> <strong>Market</strong> <strong>Snapshot</strong>Phoenix • Fourth Quarter • 2011<strong>Market</strong> Tracker*Arrows = Current Qtr TrendVacancy27.9%Net Absorption92,786 SFDeliveries0Asking Rent$23.45 FS2011 Posts Positive Net Absorption For The First TimeSince 2007PHOENIX OFFICEEconomic IndicatorsQ4 11 Q4 10Phx MSA Employment 1,962K 1,938KPhx MSA Unemployment 8.4% 8.8%U.S. Unemployment 8.6% 9.6%U.S. CCI 53.5 57.1A total of 262,638 square feet of positive net absorption occurred in Class Aproperties Valleywide during the fourth quarter 2011, making it the eleventhconsecutive quarter of growth for Class A space. However, Class B propertiescontinue to experience a slide in occupancy. Negative net absorption of 163,029square feet roughly doubled the third quarter loss in occupancy in Class B officeproperties. Large blocks of Class A square footage have now become scarce asCorporate America continued to drive absorption, as evidenced by companies such asUnited Health, CVS Caremark and Ports America all taking occupancy in the fourthquarter. Increased interest from small to midsize tenants will gradually pick up,helping to absorb the remaining Class A vacancies and eventually reducing the highvacancies in Class B office space. Activity is still being driven by companies alreadyin the Phoenix market who are right-sizing into newer, more modern office space.Net Absorption(In Thousands of SF)4,0003,0002,0001,0000-1,000-2,000Completions vs. Net Absorption(in thousands)'03 '05 '07 '09 '11CompletionsVacancy RateNet AbsorbtionOverall office absorption ended the quarter with a net positive 92,786 square feet.When added to the first three quarters, gives us a year-to-date total of 653,407square feet. This signals the first year of positive absorption since 2007. Vacancydecreased 20 basis points during the fourth quarter to finish at 27.9 percent.Scottsdale South, Camelback Corridor, Scottsdale Airpark, and Chandler/Gilbertposted the largest gains in net absorption; they collectively gained over 422,694square feet in the fourth quarter. Airport Area, Squaw Peak Corridor and SuperstitionCorridor were the three submarkets with the largest declines in occupancy; theycollectively lost 369,299 square feet during the quarter.Class A and B average asking rental rates during the fourth quarter declined in<strong>Office</strong> Graphscomparison to third quarter finishing at $23.45 and $18.47 respectively. The year-overyeartrend, looking at each quarter, shows that the rental rates dropped 5.1 percent and1.4 percent for Class A and B respectively from the previous years’ quarter.30%25%20%15%10%'03 '05 '07 '09 '11Completions vs. Net Absorption43210-1Forecast• Overall net absorption is expected to post positive gains in 2012.• Expect average asking rents to decline an additional 2 to 5 percent during 2012.• A continued cessation of construction activity as the market works to absorbavailable space. No new substantial activity for the near term.• Smaller tenants, which make up the majority of metro Phoenix tenants, shouldshow increased interest in the market helping to absorb previously vacated Class Bspace.www.cassidyturley.com
<strong>Cassidy</strong> <strong>Turley</strong> <strong>Office</strong> <strong>Market</strong> <strong>Snapshot</strong>Phoenix • Fouth Quarter • 2011TOTALBLDGSINVENTORYSUBLETVACANTDIRECTVACANTVACANCYRATECURRENTNETABSORPTIONYTD NETABSORPTIONUNDERCONSTRUCTIONAVERAGEASKING RENT(ALL CLASSES)AVERAGEASKING RENT(CLASS A)SubmarketDowntown North 65 9,066,350 149,794 2,393,089 28.0% (125,667) (382,199) - $19.36 $22.19Downtown South 28 6,603,424 167,518 891,286 16.0% 100,579 528,175 - $24.66 $27.78CBD TOTAL 93 15,669,774 317,312 3,284,375 23.0% (25,088) 145,976 - $20.78 $24.3644th Street Corridor 40 3,906,368 51,062 976,548 26.3% (7,737) 10,380 - $21.26 $22.08Airport Area 41 3,087,117 27,150 904,380 30.2% (280,196) 69,822 - $18.87 $21.81Camelback Corridor 69 7,204,175 91,790 2,242,056 32.4% 99,353 (76,183) - $24.89 $26.59Chandler/Gilbert 26 1,713,901 - 489,926 28.6% 92,055 195,925 - $23.28 $25.52Deer Valley/Airport 31 2,190,418 82,501 751,769 38.1% (10,483) (199,242) - $19.33 $20.15Glendale 7 554,927 - 237,198 42.7% 576 (10,235) - $20.94 $21.58Mesa Downtown 6 273,666 - 78,836 28.8% (1,684) (23,103) - $14.36 -Mesa East 6 294,241 - 208,998 71.0% (1,200) (10,828) - $19.30 $21.00Midtown 28 1,116,675 2,821 234,045 21.2% 11,253 (33,870) - $15.43 -N Phoenix/Desert Ridge 33 2,370,619 38,058 708,359 31.5% 26,962 (31,190) - $20.46 $21.55Northwest Phoenix 59 4,278,509 9,219 1,165,020 27.4% (14,053) 86,560 - $16.80 $20.10Scottsdale Airpark 98 6,457,150 99,614 1,921,003 32.2% 92,408 95,667 - $22.46 $23.77Scottsdale North 68 4,943,721 14,243 1,256,288 25.7% 41,935 208,453 - $21.63 $23.31Scottsdale South 33 3,238,432 43,465 559,455 18.6% 138,878 202,770 - $21.41 $23.36Squaw Peak Corridor 31 2,065,937 18,853 577,406 29.9% (48,881) (145,029) - $18.34 $20.53Sun City 17 843,978 21,886 266,329 34.1% (12,464) (7,237) - $20.81 $20.01Superstition Corridor 40 2,188,926 18,900 731,824 34.3% (40,222) 4,309 - $18.18 $20.31Tempe 45 2,777,550 33,918 646,229 24.5% 31,021 155,932 - $22.64 $26.90Tempe South/Chandler 32 2,126,609 5,104 507,047 24.1% 12,629 (27,786) - $20.16 $20.80West Phoenix 22 964,133 6,060 372,262 39.2% (12,276) 42,316 - $18.81 $21.44Suburban Total 732 52,597,052 564,644 14,834,978 29.4% 117,874 507,431 - $20.97 $23.29TOTAL 825 68,266,826 881,956 18,119,353 27.9% 92,786 653,407 - $20.93 $23.45ClassA 277 36,588,190 535,036 9,462,081 27.3% 262,638 1,083,674 - $23.45B 429 26,821,994 343,211 7,593,226 29.9% (163,029) (503,544) - $18.47C 119 4,856,642 3,709 1,064,046 22.0% (6,823) 73,277 - $14.90TOTAL 825 68,266,826 881,956 18,119,353 27.9% 92,786 653,407 - $20.93About <strong>Cassidy</strong> <strong>Turley</strong><strong>Cassidy</strong> <strong>Turley</strong> is a leading commercial real estate services provider with more than 3,400 professionals in more than 60 offices nationwide. The company represents a widerange of clients—from small businesses to Fortune 500 companies, from local non-profits to major institutions. The firm completed transactions valued at $18 billion in 2010,manages 455 million square feet on behalf of private, institutional and corporate clients and supports more than 25,000 domestic corporate services locations. <strong>Cassidy</strong> <strong>Turley</strong>serves owners, investors and occupiers with a full spectrum of integrated commercial real estate services—including capital markets, tenant representation, corporate services,project leasing, property management, project and development services, and research and consulting. In 2010, the firm enhanced its global service delivery outside of NorthAmerica through its partnership with GVA. Please visit www.cassidyturley.com for more information about <strong>Cassidy</strong> <strong>Turley</strong>.<strong>Cassidy</strong> <strong>Turley</strong> BRE Commercial2375 E. Camelback Road, Suite 300Phoenix, AZ, 85016ph: 602.954.9000 | fx: 602.468.8588www.brephoenix.comPrepared by:Chris JantzVice President Research602.224.4485cjantz@brephoenix.comZach AulickSenior Research Analyst602.468.8521zaulick@brephoenix.comJerad SilverResearch Analyst602.468.8571jsilver@brephoenix.comThe information contained within this report is gathered frommultiple sources considered to be reliable. The informationmay contain errors or omissions and is presented without anywarranty or representations as to its accuracy.Copyright © 2012 <strong>Cassidy</strong> <strong>Turley</strong>. All rights reserved.Ambri BizekResearch Analyst602.468.8542abizek@brephoenix.comBobby SzetoResearch Analyst602.468.8583bszeto@brephoenix.com