Assessment of Physicochemical Properties of Tomato Genotypes.pdf
Assessment of Physicochemical Properties of Tomato Genotypes.pdf
Assessment of Physicochemical Properties of Tomato Genotypes.pdf

Create successful ePaper yourself
Turn your PDF publications into a flip-book with our unique Google optimized e-Paper software.
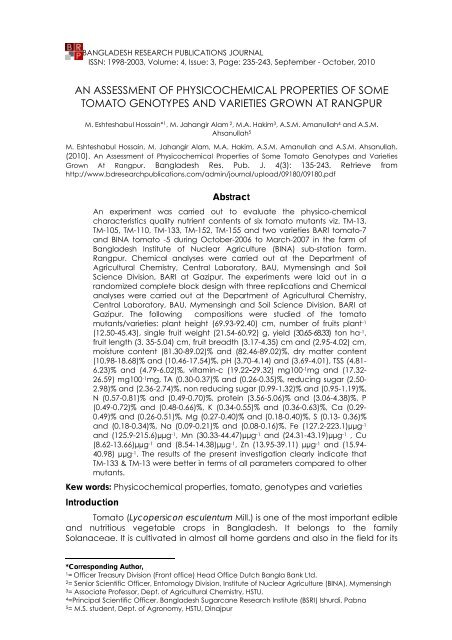
BANGLADESH RESEARCH PUBLICATIONS JOURNALISSN: 1998-2003, Volume: 4, Issue: 3, Page: 235-243, September - October, 2010AN ASSESSMENT OF PHYSICOCHEMICAL PROPERTIES OF SOMETOMATO GENOTYPES AND VARIETIES GROWN AT RANGPURM. Eshteshabul Hossain* 1 , M. Jahangir Alam 2 , M.A. Hakim 3 , A.S.M. Amanullah 4 and A.S.M.Ahsanullah 5M. Eshteshabul Hossain, M. Jahangir Alam, M.A. Hakim, A.S.M. Amanullah and A.S.M. Ahsanullah.(2010). An <strong>Assessment</strong> <strong>of</strong> <strong>Physicochemical</strong> <strong>Properties</strong> <strong>of</strong> Some <strong>Tomato</strong> <strong>Genotypes</strong> and VarietiesGrown At Rangpur. Bangladesh Res. Pub. J. 4(3): 135-243. Retrieve fromhttp://www.bdresearchpublications.com/admin/journal/upload/09180/09180.<strong>pdf</strong>AbstractAn experiment was carried out to evaluate the physico-chemicalcharacteristics quality nutrient contents <strong>of</strong> six tomato mutants viz. TM-13,TM-105, TM-110, TM-133, TM-152, TM-155 and two varieties BARI tomato-7and BINA tomato -5 during October-2006 to March-2007 in the farm <strong>of</strong>Bangladesh Institute <strong>of</strong> Nuclear Agriculture (BINA) sub-station farm,Rangpur. Chemical analyses were carried out at the Department <strong>of</strong>Agricultural Chemistry, Central Laboratory, BAU, Mymensingh and SoilScience Division, BARI at Gazipur. The experiments were laid out in arandomized complete block design with three replications and Chemicalanalyses were carried out at the Department <strong>of</strong> Agricultural Chemistry,Central Laboratory, BAU, Mymensingh and Soil Science Division, BARI atGazipur. The following compositions were studied <strong>of</strong> the tomatomutants/varieties: plant height (69.93-92.40) cm, number <strong>of</strong> fruits plant -1(12.50-45.43), single fruit weight (21.54-60.92) g, yield (30.65-68.33) ton ha -1 ,fruit length (3. 35-5.04) cm, fruit breadth (3.17-4.35) cm and (2.95-4.02) cm,moisture content (81.30-89.02)% and (82.46-89.02)%, dry matter content(10.98-18.68)% and (10.46-17.54)%, pH (3.70-4.14) and (3.69-4.01), TSS (4.81-6.23)% and (4.79-6.02)%, vitamin-c (19.22-29.32) mg100 -1 mg and (17.32-26.59) mg100 -1 mg, TA (0.30-0.37)% and (0.26-0.35)%, reducing sugar (2.50-2.98)% and (2.36-2.74)%, non reducing sugar (0.99-1.32)% and (0.95-1.19)%,N (0.57-0.81)% and (0.49-0.70)%, protein (3.56-5.06)% and (3.06-4.38)%, P(0.49-0.72)% and (0.48-0.66)%, K (0.34-0.55)% and (0.36-0.63)%, Ca (0.29-0.49)% and (0.26-0.51)%, Mg (0.27-0.40)% and (0.18-0.40)%, S (0.13- 0.36)%and (0.18-0.34)%, Na (0.09-0.21)% and (0.08-0.16)%, Fe (127.2-223.1)µµg -1and (125.9-215.6)µµg -1 , Mn (30.33-44.47)µµg -1 and (24.31-43.19)µµg -1 , Cu(8.62-13.66)µµg -1 and (8.54-14.38)µµg -1 , Zn (13.95-39.11) µµg -1 and (15.94-40.98) µµg -1 . The results <strong>of</strong> the present investigation clearly indicate thatTM-133 & TM-13 were better in terms <strong>of</strong> all parameters compared to othermutants.Kew words: <strong>Physicochemical</strong> properties, tomato, genotypes and varietiesIntroduction<strong>Tomato</strong> (Lycopersicon esculentum Mill.) is one <strong>of</strong> the most important edibleand nutritious vegetable crops in Bangladesh. It belongs to the familySolanaceae. It is cultivated in almost all home gardens and also in the field for its*Corresponding Author,1= Officer Treasury Division (Front <strong>of</strong>fice) Head Office Dutch Bangla Bank Ltd.2= Senior Scientific Officer, Entomology Division, Institute <strong>of</strong> Nuclear Agriculture (BINA), Mymensingh3= Associate Pr<strong>of</strong>essor, Dept. <strong>of</strong> Agricultural Chemistry, HSTU,4=Principal Scientific Officer, Bangladesh Sugarcane Research Institute (BSRI) Ishurdi, Pabna5= M.S. student, Dept. <strong>of</strong> Agronomy, HSTU, Dinajpur
Hossain et al.236adaptability to wide range <strong>of</strong> soil and climate in Bangladesh. It ranks next topotato and sweet potato in respect <strong>of</strong> vegetable production in the world.It is widely cultivated in tropical, sub-tropical and temperate climates andthus it ranks third in terms <strong>of</strong> world vegetable production (FAO, 2006). The leadingtomato producing countries are China, United States <strong>of</strong> America, India, Egypt,Turkey, Iran, Mexico, Brazil and Indonesia (FAO, 2006). In Bangladesh, tomato iscultivated all over the country due to its adaptability to wide range <strong>of</strong> soil andclimate (Ahamed, 1995). The cultivated area under tomato in Bangladesh was17,813.8 hectares, total production was 1,20,000 metric tons having an averageyield <strong>of</strong> 6.7 metric tons per hectare (BBS, 2006), which is very low compared toother countries like India (15.67 t ha -1 ), Japan (52.82 t ha -1 ), USA (65.22 t ha -1 ),China (30.39 t ha -1 ), Egypt (34.00 t ha -1 ) and Turkey (41.77 t ha -1 ) (FAO, 2006). Thelow yield potentiality <strong>of</strong> this crop is responsible for the lower yield attribute viz.,unavailability <strong>of</strong> quality seeds <strong>of</strong> improved varieties, improper management <strong>of</strong>fertilizers, irrigation, disease control and lack <strong>of</strong> suitable pruning practices. <strong>Tomato</strong>cultivated in all parts <strong>of</strong> Bangladesh due to its adaptability to wide range <strong>of</strong> soiland climate (Hoque et al. 1999). The best growing areas <strong>of</strong> tomato in Bangladeshare Chittagong, Comilla and Rajshahi (Sharfuddin and Siddque, 1985) and it ranksfourth in respect <strong>of</strong> production and third in respect <strong>of</strong> area (BBS, 2006). It containsa number <strong>of</strong> nutritive elements almost double compared to fruit apple and showssuperiority with regard to food values (Barman, 2007). Food value <strong>of</strong> tomato isgreatly dependent on its chemical composition such as dry matter, titrableacidity, total sugar, total soluble solids and ascorbic acid etc. Studies in USAindicate that flavor and taste <strong>of</strong> tomato are related to free sugars, organic acidsand sugar acid ratios (Kader et al. 1978). Considering the above facts, thepresent study was, therefore undertaken to determine some important selectivephysico-chemical properties and to analyse the nutrient status <strong>of</strong> different tomatomutants and varieties grown at Rangpur District.Materials and methodsThe experimental sites were located at the Bangladesh Institute <strong>of</strong> NuclearAgriculture (BINA) sub-station farm, Rangpur. Geographically the experimentalfield at Rangpur Sadar Upazila is located at 25˚40΄ N to 25˚50΄ N latitude and89˚06΄ E longitudes to 89˚19΄ E longitude. The soils <strong>of</strong> the experimental plots wasTista Meander Floodplain (AEZ-3) at Rangpur, respectively. The soil <strong>of</strong> BINA substationfarm, Rangpur was belongs to ‘Sonatola’ series under general soil type,moderately acidic, low organic matter content, low-medium fertile and havegood moisture holding capacity. The corners <strong>of</strong> the land were spaded and largerclods were broken into smaller pieces. After ploughing and laddering all thestubbles, crop residues and uprooted weeds were collected and removed fromthe main field and the land was ready. Whole experimental land was divided intounit plots maintaining the desired spacing. The plots were spaded again beforeplanting the planting materials. The experiments were laid out in a RandomizedComplete Block Design (RCBD) with 3 replications. The whole area <strong>of</strong> theexperimental plot was divided into 3 blocks and each block was again dividedinto 8 unit plots. The size <strong>of</strong> the unit plot was 4 m length and 3 m width. Block toblock and plot to plot distance were 1.0 m and 1.0 m respectively. Two varieties(BINA tomato-5 and BARI tomato-7), six Trans mutants (TM-13, TM-105, TM-110, TM-133, TM- 152 and TM- 155) were used. Seeds <strong>of</strong> all varieties, mutants and cultivarswere collected from (BINA) farm, Mymensingh. <strong>Tomato</strong> seedlings were raised insub-station farm; complete germination <strong>of</strong> the seeds took place within 9 daysafter sowing. Healthy and uniform sized <strong>of</strong> about one month old seedlings weretaken for transplanting. A light irrigation was done immediately aftertransplanting. The seeds <strong>of</strong> tomato were sown in rows made by hand plough. Thehttp://www.bdresearchpublications.com/journal/
An <strong>Assessment</strong> <strong>of</strong> Some <strong>Tomato</strong> <strong>Genotypes</strong> and Varietiesdistance between row to row was 50 cm and seed to seed was 50 cm. Two seedswere placed in each point at 2-3 cm depth from the soil surface. Differentintercultural operations were accomplished as and when necessary for bettergrowth and development <strong>of</strong> plants. Before harvesting the crops 10 representativeplant samples from each plot were collected separately, tagged properly andbought to the laboratory for further observations. Fruits were harvested in themorning considering the uniformity in size. After the collection <strong>of</strong> plant samples <strong>of</strong>different mutants/varieties/ cultivars from the experimental field. DifferentPhysiological parameters (plant height, number <strong>of</strong> fruits plant -1 , single fruit weight,yield, fruit size, moisture content and dry matter content) are recorded. Chemicaland biochemical parameters[Vitamin C content,Total soluble Solid (TSS), pH,Titrable acidity, Reducing sugar and non-reducing sugar content, Nitrogen andprotein content, Phosphorus content, Potassium content, Sulphur content,Calcium and magnesium content, Iron content. Manganese content, Zinccontent, Copper content and Sodium content] are also recorded. Preparation <strong>of</strong>fruit extract for the determination <strong>of</strong> different nutrients are by following wayexactly 1 g <strong>of</strong> finely grind fruit materials were taken into a 250 mL conical flaskand 10 mL <strong>of</strong> di-acid mixture (HNO3 : HClO4 = 2 : 1) was added to it. Then it wasplaced on an electric hot plate for heating at 180 – 200 o C until the solid particlesdisappeared and white fumes were evolved from the flask. Then it was cooled atroom temperature, washed with distilled water and filtered into 100 mL volumetricflask through Whatman No. 42 filter paper making the volume up to the mark withdistilled water following wet oxidation method as described by Jackson (1973).Thesolution was used for the estimation <strong>of</strong> P, K, S, Na, Ca, Mg, Fe, Mn and Cu. Thedata were analyzed statistically by F-test (Gomez and Gomez, 1984). The ANOVAfor each character is shown in appendix section. Analysis <strong>of</strong> variance was donewith the help <strong>of</strong> computer package M-STAT developed by Russell (1986). Themean comparisons <strong>of</strong> the treatments were evaluated by DMRT (Duncan's MultipleRange Test).Results and discussionPhysical characteristicsPlant heightPlant height is one <strong>of</strong> the most important characteristics <strong>of</strong> tomato plant.The plant height <strong>of</strong> tomato genotypes were measured after fruit ripen and theresults are presented in the (Table: 1). The results indicated that there were nosignificant leave <strong>of</strong> variation among the tomato genotypes and varieties grownat Rangpur. Considering all the varieties and genotypes at both locations BARItomato-7 was the tallest plant; TM-13, TM-155 and BINA tomato-5 were almostsimilar; while TM-110 was the shortest genotype. The range <strong>of</strong> plant height wasvaried from 69.93 cm to 92.40 cm.Number <strong>of</strong> fruits plant -1Number <strong>of</strong> fruits plant -1 is the most important yield attributing character <strong>of</strong>tomato plant. The observed results are presented in the (Table 1). The parametershowed statistical significant variation in compare with the check variety BARItomato-7 and BINA tomato-5. The value <strong>of</strong> total number <strong>of</strong> fruits plant -1 wasranged from 12.50-45.43. Considering all the varieties and genotypes TM-110 gavethe highest number <strong>of</strong> fruits plant -1 . TM-105 gave the second highest number <strong>of</strong>fruits plant -1 in compare with TM-110. TM-13, TM-155, TM-152 and BINA tomato-5gave similar number <strong>of</strong> fruits plant -1 ; while BARI tomato-7 gave lowest number <strong>of</strong>fruits plant -1 . Similar result was also reported by Arun et al. (2004).http://www.bdresearchpublications.com/journal/
Hossain et al.238Single fruit weightSingle fruit weight is one <strong>of</strong> the most important yields attributing character<strong>of</strong> tomato. The results <strong>of</strong> single fruit weight <strong>of</strong> different genotypes and varieties arepresented in the (Table 1).The results <strong>of</strong> single fruit weight showed statisticallysignificant variation. The range <strong>of</strong> single fruit weight was varied from 21.54g to60.92g. Considering all the varieties and genotypes BARI tomato-7 gave thehighest weight <strong>of</strong> single fruit; TM-13 was identical second highest value <strong>of</strong> singlefruit weight; TM-155, TM-152 and BINA tomato-5 gave similar value <strong>of</strong> single fruitweight; while TM-110 gave the lowest value <strong>of</strong> single fruit weight. Ereifej et al.(1997) also found similar results.YieldYield is the most important characteristics for the justification <strong>of</strong> evaluation<strong>of</strong> tomato genotypes and varieties. The results <strong>of</strong> yield <strong>of</strong> tomato genotypes andvarieties are presented in the (Table 1). There was statistically significant variation.The range <strong>of</strong> yield was ranged from 40.73 ton ha -1 to 60.59 ton ha -1 . Consideringall the genotypes and varieties TM-155 gave the highest yield. While BARI tomato-7 gave the lowest yield. TM-13 gave the second highest yield. Though the fruit size<strong>of</strong> BARI tomato-7 was large; but it did not produce the height value <strong>of</strong> yield dueto less number <strong>of</strong> fruits plant -1 .Size <strong>of</strong> fruitsLengthStatistically significant variation was found in length <strong>of</strong> fruits and the resultswere presented in (Table 1). At full maturity <strong>of</strong> fruit it observed that TM-13 was thetallest mutant. The fruit length <strong>of</strong> BARI tomato-7 was next in compare the TM-13.TM-133 and TM-152 were alike mutants. TM-105, TM-110, were almost similar. Thehighest value <strong>of</strong> fruit length was observed in TM-13 (5.14 cm), where as the lowestvalue <strong>of</strong> fruit length was observed in TM-110 (3.35 cm). Similar results were als<strong>of</strong>ound by Rathore (1992).BreadthFruit breadth showed statistically significant and the results were presentedin (Table: 1). Fruit breadth <strong>of</strong> BARI tomato-7 was superior among varieties/mutants.TM-13, TM-133, TM-155, TM-152, TM-110, TM-105, were almost similar mutants. Thehighest value <strong>of</strong> fruit breadth was observed in BARI tomato-7 (4.02 cm), where asthe lowest value <strong>of</strong> fruit breadth was observed in TM-105 (3.35 cm), respectively.Moisture contentMoisture content is one <strong>of</strong> the important characters <strong>of</strong> fruits. The observedresults are presented in the (Table: 1). The results showed that there were statisticalsignificant variations among the genotypes and varieties <strong>of</strong> tomatoes incompared with the check variety BARI tomato-7 and BINA tomato-5. Consideringall the genotypes and varieties, on an average, the highest moisture content wasobserved in TM-105 (89.02%). TM-110 has the second highest value <strong>of</strong> moisturecontent and it was quite similar to TM- 105; while TM-13, TM-133, TM-152, TM-155and BINA tomato-5 had the similar value <strong>of</strong> moisture content. The lowest moisturecontent was found in BARI tomato-7 (82.46%) and (81.30%). Similar result was alsoreported by Rathore (1992).Dry matter contentThe observed results are presented in the (Table 1). The results showed thatthere was statistical significant variation were found among the genotypes andvarieties <strong>of</strong> tomatoes in compared with the check variety BARI tomato-7 andhttp://www.bdresearchpublications.com/journal/
An <strong>Assessment</strong> <strong>of</strong> Some <strong>Tomato</strong> <strong>Genotypes</strong> and VarietiesBINA tomato-5. Considering all the genotypes and varieties BARI tomato-7 has thehighest dry matter content (17.54%), while TM-13, TM-133, TM-152, TM-155 andBINA tomato-5 had the similar value <strong>of</strong> dry matter content; TM-105 has the lowestvalue <strong>of</strong> dry matter content (10.60%). Davis and Hobson (1981) also found the lessvariation in dry matter content among the different variety.Table 1. Plant height, fruit number, single fruit weight and yield <strong>of</strong> some tomatogenotypes and varieties grown at Rangpur<strong>Tomato</strong>genotypesand varietiesPlantheight(cm)Number<strong>of</strong> fruitsplant -1Singlefruitweight(gm)Yield(ton ha- 1 )LengthFruit size (cm)BreadthMoistureContent(%)Drymatteryield (%)TM- 13 86.74a 25.13 c 55.24 ab 55.32 b 16.11 abTM1-105 75.67a 44.63 a 26.55 d 47.23 b 3.82 cd 2.95 c 88.99 a 10.60 cTM-110 69.93a 45.43 a 21.54 d 39..08 bc 3.35 d 3.10 c 89.39 a 11.00 cTM-133 81.08a 33.07 b 41.49 c 54.81 ab 4.77 a-c 3.25 bc 83.36 b 16.63 abTM-152 85.00a 25.83 c 41.91 c 43.40 bc 4.35 a-d 3.71 ab 83.97 b 16.03 abTM-155 81.38a 29.97 bc 57.19 a 68.33 a 3.96 b-d 3.24 bc 88.44 a 11.55 bcBARI tomato-7 92.40a 12.50 d 60.92 a 30.65 c 5.04 ab 4.02 a 82.46 b 17.54 aBINA tomato-5 85.10a 24.27 c 50.28 b 48.71 b 4.14 a-d 3.15 bc 86.79 a 13.21 bcS -x 5.68 1.98 1.99 3.643 0.34 0.17 1.12 1.12In a column, means followed by dissimilar letter/s are significantly different at 5%level by DMRT.Chemical characteristicsVitamin C contentVitamin C content showed statistically significant variation among thegenotypes and varieties that grown at both locations and the results are shown in(Table 2). Considering all the genotypes and varieties TM-133 has the highestvitamin-c content. TM-13, BARI tomato-7, TM-152, BINA tomato-5, TM-155 and TM-105 were chronologically next to the TM-133. While TM-110 has the lowest vitaminC content. The range <strong>of</strong> vitamin C content varied from 17.32 mg 100 -1 mg to 26.59mg 100 -1 mg. Similar result was also founded by Kallo (1985).Total Soluble Solids and pHTotal soluble solid content showed statistically significant variation amongthe genotypes and varieties that grown. Considering all the varieties andgenotypes TM-133 has the highest total soluble solid content at the both locations.BARI tomato-7, TM-13, TM-152, TM-155, BINA tomato-5 and TM-110 werechronologically next to TM-133. While TM-105 has the lowest total soluble solidcontent. The value <strong>of</strong> total soluble solids content varied from 4.79% to 6.02%.Similar result was also found by Rathore (1992). pH showed statistically significantvariation among the genotypes and varieties and the results were presented inthe (Table 2). Considering all the varieties and genotypes TM-133 gave the highestvalue <strong>of</strong> pH. TM-152 and TM-155 gave similar pH value they were chronologicallynext to TM-133; while TM-105 gave the lowest pH value. Saimbhi et al. (1995)reported similar results.Titrable acidityTitrable acidity showed statistically insignificant variation among thegenotypes and varieties grown and the results are presented in (Table 2).Considering all the varieties and genotypes and varieties TM-133 has the highesttitrable acidity, while TM-110 has the lowest titrable acidity. The range <strong>of</strong> titrableacidity content varied from 0.256% to 0.353%.http://www.bdresearchpublications.com/journal/
Hossain et al.240Reducing and non-reducing sugar contentReducing sugar content showed statistically significant variation amongthe genotypes and varieties. Considering all the genotypes and varieties TM-133has the highest reducing sugar content. BINA tomato-5 and TM-13 gave sameresults; TM-105, TM-110 and TM-152 were similar. While TM-152 has the lowestreducing sugar content. The range <strong>of</strong> reducing sugar content varied from 2.36%to 2.74%. Similar trend <strong>of</strong> reducing sugar content was also reported by Kallo(1985). Non reducing sugar content showed statistically insignificant variationamong the genotypes and varieties and the results are presented in (Table 2).Considering all the genotypes and varieties TM-133 has the highest non reducingsugar content. BARI tomato-7, BINA tomato-5, TM-13, TM-152 were chronologicallynext to TM-133; TM-110 and TM-155 were similar. While TM-105 has the lowest nonreducing sugar content. The range <strong>of</strong> non reducing content varied from 0.95 % to1.19 %.Nitrogen, phosphorus and potassium contentNitrogen content showed statistically significant variation among thegenotypes. The results were shown in (Table 2). Considering all the genotypes andvarieties TM-133 has the highest nitrogen content at the both locations. TM-13, TM-105, TM-152, BARI tomato-7, TM-110 and BINA tomato-5 were chronologically nextto TM-133. While TM-155 has the lowest nitrogen content. The value <strong>of</strong> nitrogencontent ranged from 0.49 % to 0.70 %. Considering all the genotypes and varietiesTM-133 has the highest phosphorus content at the both locations. BINA tomato-5was next to TM-133; BARI tomato-7 and TM-155 were similar; while TM-110 has thelowest phosphorus content. The value <strong>of</strong> phosphorus content varied from 0.48 %to 0.66 %. Kallo (1985) found that tomato fruits contained 0.2-0.8 g 100 -1 g <strong>of</strong> dryfruit weight. Considering all the genotypes and varieties TM-133 has the highestpotassium content at the both locations. While TM- 110 has the lowest potassiumcontent. The value <strong>of</strong> potassium content varied from 0.36 % to 0.63 %. Kallo (1985)found that tomato fruits contained (0.4-0.8) g 100 -1 g <strong>of</strong> dry fruit weight. Davis andHobson (1981) observed almost the same result.Table 2. Vitamin C content, total soluble soilds (TSS), pH, titable acidity (%), reducing &non reducing sugar (%) and N, P & K (%) <strong>of</strong> some tomato genotypes and veritiesgrown at Rangpur<strong>Tomato</strong>genotypes andvarietiesVitamin C(mg 100 -1 g)TotalSolubleSolid %pHTittableacidity(%)Reducingsugar (%)Nonreducing sugar(%)TM- 13 24.68 ab 5.41 ab 3.73 c 0.353 a 2.45 c 1.02 b-d 0.64 b 0.54 de 0.44 bcTM1-105 19.65 c 4.79 b 3.72 c 0.314 a 2.42 c 0.95 d 0.57 bc 0.50 ef 0.38 cTM-110 17.32 d 4.86 b 3.69 c 0.256 b 2.39 c 0.97 cd 0.57 c 0.48 f 0.36 cTM-133 26.59 b 6.02 a 4.01 0.365 a 2.74 a 1.19 a 0.70 a 0.66 a 0.63 aaTM-152 23.85 b 5.39 ab 3.86 0.327 a 2.36 c 1.06 bc 0.59 bc 0.60 bc 0.37 cbTM-155 23.32 b 5.20 b 3.74 c 0.344 a 2.55 bc 0.99 b-d 0.49 d 0.61 a-c0.54abBARI 24.61 ab 5.54 ab 3.67 c 0.320 a 2.48 c 1.09 b 0.62 bc 0.65 0.48 bctomato-7abBINA 23.06 b 5.15 b 3.73 c 0.325 a 2.70 ab 0.99 b-d 0.58 c 0.58 cd 0.42 bctomato-5S -x 0.64 0.22 0.02 0.01 0.05 0.03 0.01 0.01 0.03N(%)P(%)K(%)http://www.bdresearchpublications.com/journal/
An <strong>Assessment</strong> <strong>of</strong> Some <strong>Tomato</strong> <strong>Genotypes</strong> and VarietiesProtein contentProtein content showed statistically significant variation among thegenotypes and varieties that are grown. The results were presented in (Table 3.)Considering all the genotypes and mutants TM-133 has the highest proteincontent. TM-13, TM-105, TM-152, BARI tomato-7, TM-110 and BINA tomato-5 werechronologically next to TM-133. While TM-155 has the lowest protein content. Therange <strong>of</strong> protein content varied from 3.06 % to 4.38 %.Sulphur, Calcium and Magnesium contentSulphur content showed statistically significant variation among thegenotypes and varieties that were grown. The results are presented in (Table 3).Considering all the genotypes and varieties TM-133 has the highest sulphurcontent. TM-105 has the lowest sulphur content. The value <strong>of</strong> calcium contentvaried from 0.18 % to 0.34 %. According to Chatfield (1949 and 1954), tomatocontained 0.024 g sulphur 100g -1 <strong>of</strong> edible portion. Considering all the genotypesand varieties TM-133 has the highest calcium content while BINA tomato-5 has thelowest calcium content at Rangpur. The value <strong>of</strong> calcium content was variedfrom 0.26 % to 0.51 %. Almost same result was found by Kallo (1985) and his findingwas 0.25-0.50 g/100g <strong>of</strong> dry fruit weight. Similar result was also found by Davis andHobson (1981). Considering all the genotypes and varieties BINA tomato-5 has thehighest magnesium content. TM-13 has the lowest magnesium content while TM-105 TM-110 has the lowest magnesium content at Rangpur. The value <strong>of</strong> calciumcontent varied from 0.18 % to 0.40 %. Similar result was also found by Kallo (1985)and his finding was 0.10-0.50 g 100 -1 g <strong>of</strong> dry fruit weight.Iron, Manganese and contentIron content showed statistically significant variation among the genotypesand varieties that were grown. The results are presented in (Table 3). Consideringall the genotypes and varieties TM-133 has the highest iron content, while TM-110has the lowest iron content at Rangpur. The range <strong>of</strong> iron content varied from125.9 µgg -1 to 215.6 µgg -1 . Similar result was also found by Kallo (1985) and hisfinding was 40-500 µgg -1 <strong>of</strong> dry fruit weight. Considering all the genotypes andvarieties TM-133 has the highest zinc content. While TM-105 has the lowest zinccontent. The value <strong>of</strong> iron content was varied from 15.94 µgg -1 to 40.98 µgg -1 .Almost same result was found by Kallo (1985) and his finding was 10-50 µgg -1 <strong>of</strong> dryfruit weight.Sodium and copper contentSodium content showed statistically significant among the genotypes andvarieties that were grown. The results are presented in (Table 3). Considering allthe genotypes and varieties BINA tomato-5 has the highest sodium content, whileTM-110 has the lowest sodium content. The range <strong>of</strong> calcium content varied from0.08 % to 0.16 %. Almost similar result was found by Kallo (1985) and his finding was0.10-0.25 g 100 -1 g <strong>of</strong> dry fruit weight. Considering all the genotypes and varietiesTM-133 has the highest copper content, while TM-105 has the lowest coppercontent. The value <strong>of</strong> iron content varied from 8.54 µgg -1 to 14.38 µgg -1 . Accordingto Chatfield (1949 and 1954), 100g <strong>of</strong> edible tomato portion contained 1 µgg -1copper.http://www.bdresearchpublications.com/journal/
Hossain et al.242Table 3. Protein (%), S%, Ca%, Mg%, Fe (µgg- 1 ), Mn (µgg- 1 ), Zinc (µgg- 1 ), Na% and Cu (µgg- 1 )content <strong>of</strong> some tomato genotypes and verities grown at Rangpur<strong>Tomato</strong>genotypesandvarietiesProtein(%)S(%)Ca(%)Mg(%)Fe(µgg- 1 )Mn(µgg- 1 )Zinc(µgg- 1 )Na(%)Cu(µgg- 1 )TM- 13 3.99 b 0.31 a 0.42 b 0.40 125.9 e 39.91 b 22.02 0.12 c 12.45 bbcTM1-105 3.56 b 0.18 b 0.31 c 0.34 184.5 c 27.57 e 15.94 c 0.08 ef 8.54 fTM-110 3.56 b 0.22 b 0.30 c 0.28 154.1 d 33.38 c 17.38 c 0.08 f 9.34 eTM-133 3.38 a 0.34 a 0.51 a 0.39 215.6 a 43.19 a 40.98 a 0.14 b 14.38 aTM-152 3.66 b 0.33 a 0.34 bc 0.33 205.1 ab 28.33 24.88 b 0.11 cd 11.80 cdeTM-155 3.06 c 0.28 a 0.30 c 0.34 213.1 ab 29.72 d 21.30 0.09 de 11.31 cbcBARI 3.87 b 0.33 a 0.42 b 0.36 194.1 bc 35.17 c 21.56 0.10 cd 10.54 dtomato-7bcBINA 3.62 b 0.29 a 0.26 c 0.33 201.9 a-c 24.31 f 21.80 0.16 a 10.66 dtomato-5bcS -x 0.13 0.01 0.02 0.03 6.1 0.65 1.83 0.005 0.16In a column, means followed by dissimilar letter/s are significantly different at 5%level by DMRT.ConclusionConsidering all the varieties and genotypes, TM-110 has the highestnumber <strong>of</strong> fruits. Highest yields were obtained from BINA tomato-5. Among themutants and varieties, TM-133 has the highest N, P,K, Ca, S, Fe, Mn, Cu, Zn, protein,vitamin C, pH value and TSS, TA, reducing sugar and non-reducing sugar contentcompared to other mutants. In respect <strong>of</strong> the quality parameter studied, freshfruits at full ripe appeared to be the best for immediate consumption.ReferencesAhamad, K. (1995). ‘Phul Phal O Shak-Sabjee’, 5th Edn. 414 Senpara, Parbata,Mirpur, Dhaka. p. 440.Arun, J., V. Amit and M.C. Thakur. (2004). Studies on genetic variability, correlationand path analysis for yield and physico-chemical traits in tomato.Progressive Hort. 36(1): 51-58.Barman, S. C. (2007). Real Adoption Impact Measure <strong>of</strong> <strong>Tomato</strong> Technologies onProduction at Farmers' Level in Bangladesh. Bangladesh J. Sci. Ind.Res.42(1): 15-28.BBS. (2006). Statistical Pocket Book, Statistics Division, Ministry <strong>of</strong> Planning, Govt. <strong>of</strong>the Peoples Republic <strong>of</strong> Bangladesh, Dhaka. p. 58.Davis, J.N. and G.E. Hobson. (1981). The constituents <strong>of</strong> tomato fruit – the influence<strong>of</strong> environment, nutrition and genotype. Hort. Sci. 21(8):415-421 and CRCCrit. Rev. Food Sci. Nutr. 15. 205(80).Ereifej, K.I., R.A. Shibli, M.M. Ajlouni and A. Hussain. (1997). Physico-chemicalcharacteristics and processing quality <strong>of</strong> newly introduced seven tomatocultivars into Jordan in comparison with local variety. J. Food Sci. and Tech.Mysore. 34 (2): 171-174FAO. (2006). FAO Production Yearbook, (1996). Basic Data Unit, Statistics Division,FAO, Rome, Italy, 55:125-127.http://www.bdresearchpublications.com/journal/
An <strong>Assessment</strong> <strong>of</strong> Some <strong>Tomato</strong> <strong>Genotypes</strong> and VarietiesHaque, M.S., M.T. Islam and M. Rhaman. (1999). Studied on the preservation <strong>of</strong>semi-concentrated tomato juice. Bangladesh J. Agril. Sci. 26 (1) : 37-43.Kader, A.A., L.L. Moris, M.A. Stevens and M. Albright. (1978). Composition andflavor quality <strong>of</strong> fresh market tomatoes as influenced by some post harvesthandling procedures. J. Amer. Soc. Hort. Sci. 103(1):6-13.Kallo. (1985). <strong>Tomato</strong>. Published by R.H. Saehdev for Allied Publishers Pvt. Ltd.India. p. 33.Rathore, D.S. (1992). Physico-chemical evaluation <strong>of</strong> tree tomato fruits.Progressive-Horticulture. N.B.P.G.R., Regional Station, Phagli, Shimla 171 004,H.P., India. p. 24: 3-4, 233-234.Russell, D.F. (1986). MSTAT-C Package programme. Crop and Soil Sci. Dept.,Michigan State University, USA.Saimbhi, M.S., D.S. Cheema, S. Shing and K.S. Nandpuri. (1995). Physico-chemicalproperties <strong>of</strong> some tomato hybrids. Trop. Sci. 35(1):9-12Sharfuddin, A.F.M. and M.A. Siddque. (1985). Sabjibagan, Bangladesh AgriculturalUniversity, Mymensingh, Bangladesh. p. 32.http://www.bdresearchpublications.com/journal/