STUMPF, RICHARD P., KRISTINE HOLDERIED, AND ... - Ocean Color
STUMPF, RICHARD P., KRISTINE HOLDERIED, AND ... - Ocean Color
STUMPF, RICHARD P., KRISTINE HOLDERIED, AND ... - Ocean Color

Create successful ePaper yourself
Turn your PDF publications into a flip-book with our unique Google optimized e-Paper software.
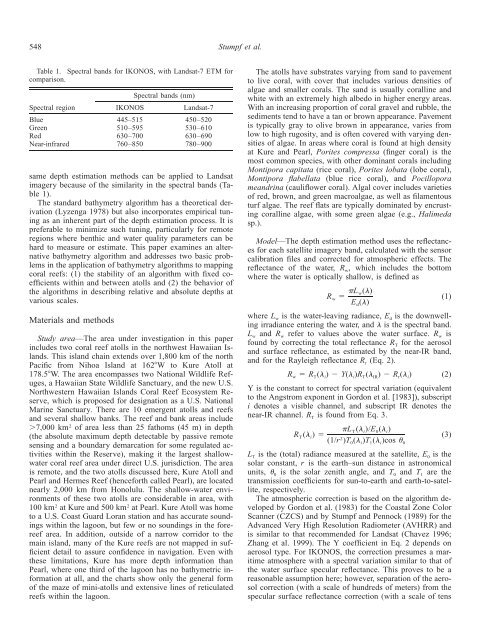
548 Stumpf et al.Table 1. Spectral bands for IKONOS, with Landsat-7 ETM forcomparison.Spectral regionBlueGreenRedNear-infraredIKONOS445–515510–595630–700760–850Spectral bands (nm)Landsat-7450–520530–610630–690780–900same depth estimation methods can be applied to Landsatimagery because of the similarity in the spectral bands (Table1).The standard bathymetry algorithm has a theoretical derivation(Lyzenga 1978) but also incorporates empirical tuningas an inherent part of the depth estimation process. It ispreferable to minimize such tuning, particularly for remoteregions where benthic and water quality parameters can behard to measure or estimate. This paper examines an alternativebathymetry algorithm and addresses two basic problemsin the application of bathymetry algorithms to mappingcoral reefs: (1) the stability of an algorithm with fixed coefficientswithin and between atolls and (2) the behavior ofthe algorithms in describing relative and absolute depths atvarious scales.Materials and methodsStudy area—The area under investigation in this paperincludes two coral reef atolls in the northwest Hawaiian Islands.This island chain extends over 1,800 km of the northPacific from Nihoa Island at 162W to Kure Atoll at178.5W. The area encompasses two National Wildlife Refuges,a Hawaiian State Wildlife Sanctuary, and the new U.S.Northwestern Hawaiian Islands Coral Reef Ecosystem Reserve,which is proposed for designation as a U.S. NationalMarine Sanctuary. There are 10 emergent atolls and reefsand several shallow banks. The reef and bank areas include7,000 km 2 of area less than 25 fathoms (45 m) in depth(the absolute maximum depth detectable by passive remotesensing and a boundary demarcation for some regulated activitieswithin the Reserve), making it the largest shallowwatercoral reef area under direct U.S. jurisdiction. The areais remote, and the two atolls discussed here, Kure Atoll andPearl and Hermes Reef (henceforth called Pearl), are locatednearly 2,000 km from Honolulu. The shallow-water environmentsof these two atolls are considerable in area, with100 km 2 at Kure and 500 km 2 at Pearl. Kure Atoll was hometo a U.S. Coast Guard Loran station and has accurate soundingswithin the lagoon, but few or no soundings in the forereefarea. In addition, outside of a narrow corridor to themain island, many of the Kure reefs are not mapped in sufficientdetail to assure confidence in navigation. Even withthese limitations, Kure has more depth information thanPearl, where one third of the lagoon has no bathymetric informationat all, and the charts show only the general formof the maze of mini-atolls and extensive lines of reticulatedreefs within the lagoon.The atolls have substrates varying from sand to pavementto live coral, with cover that includes various densities ofalgae and smaller corals. The sand is usually coralline andwhite with an extremely high albedo in higher energy areas.With an increasing proportion of coral gravel and rubble, thesediments tend to have a tan or brown appearance. Pavementis typically gray to olive brown in appearance, varies fromlow to high rugosity, and is often covered with varying densitiesof algae. In areas where coral is found at high densityat Kure and Pearl, Porites compressa (finger coral) is themost common species, with other dominant corals includingMontipora capitata (rice coral), Porites lobata (lobe coral),Montipora flabellata (blue rice coral), and Pocilloporameandrina (cauliflower coral). Algal cover includes varietiesof red, brown, and green macroalgae, as well as filamentousturf algae. The reef flats are typically dominated by encrustingcoralline algae, with some green algae (e.g., Halimedasp.).Model—The depth estimation method uses the reflectancesfor each satellite imagery band, calculated with the sensorcalibration files and corrected for atmospheric effects. Thereflectance of the water, R w , which includes the bottomwhere the water is optically shallow, is defined asL w()Rw (1)E d()where L w is the water-leaving radiance, E d is the downwellingirradiance entering the water, and is the spectral band.L w and R w refer to values above the water surface. R w isfound by correcting the total reflectance R T for the aerosoland surface reflectance, as estimated by the near-IR band,and for the Rayleigh reflectance R r (Eq. 2).R w R T ( i ) Y( i )R T ( IR ) R r ( i ) (2)Y is the constant to correct for spectral variation (equivalentto the Angstrom exponent in Gordon et al. [1983]), subscripti denotes a visible channel, and subscript IR denotes thenear-IR channel. R T is found from Eq. 3.L T( i)/E 0( i)R T( i) (3)2(1/r )T ( )T ( )cos 0 i 1 i 0L T is the (total) radiance measured at the satellite, E 0 is thesolar constant, r is the earth–sun distance in astronomicalunits, 0 is the solar zenith angle, and T 0 and T 1 are thetransmission coefficients for sun-to-earth and earth-to-satellite,respectively.The atmospheric correction is based on the algorithm developedby Gordon et al. (1983) for the Coastal Zone <strong>Color</strong>Scanner (CZCS) and by Stumpf and Pennock (1989) for theAdvanced Very High Resolution Radiometer (AVHRR) andis similar to that recommended for Landsat (Chavez 1996;Zhang et al. 1999). The Y coefficient in Eq. 2 depends onaerosol type. For IKONOS, the correction presumes a maritimeatmosphere with a spectral variation similar to that ofthe water surface specular reflectance. This proves to be areasonable assumption here; however, separation of the aerosolcorrection (with a scale of hundreds of meters) from thespecular surface reflectance correction (with a scale of tens

![Franz ocrt_terra_franz.ppt [Read-Only] - Ocean Color - NASA](https://img.yumpu.com/24076593/1/190x146/franz-ocrt-terra-franzppt-read-only-ocean-color-nasa.jpg?quality=85)