Stroke - Patient-Reported Outcomes Measurement
Stroke - Patient-Reported Outcomes Measurement
Stroke - Patient-Reported Outcomes Measurement

Create successful ePaper yourself
Turn your PDF publications into a flip-book with our unique Google optimized e-Paper software.
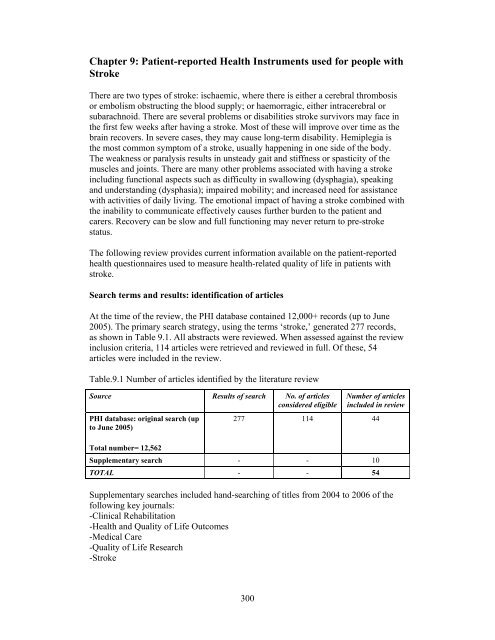
Chapter 9: <strong>Patient</strong>-reported Health Instruments used for people with<strong>Stroke</strong>There are two types of stroke: ischaemic, where there is either a cerebral thrombosisor embolism obstructing the blood supply; or haemorragic, either intracerebral orsubarachnoid. There are several problems or disabilities stroke survivors may face inthe first few weeks after having a stroke. Most of these will improve over time as thebrain recovers. In severe cases, they may cause long-term disability. Hemiplegia isthe most common symptom of a stroke, usually happening in one side of the body.The weakness or paralysis results in unsteady gait and stiffness or spasticity of themuscles and joints. There are many other problems associated with having a strokeincluding functional aspects such as difficulty in swallowing (dysphagia), speakingand understanding (dysphasia); impaired mobility; and increased need for assistancewith activities of daily living. The emotional impact of having a stroke combined withthe inability to communicate effectively causes further burden to the patient andcarers. Recovery can be slow and full functioning may never return to pre-strokestatus.The following review provides current information available on the patient-reportedhealth questionnaires used to measure health-related quality of life in patients withstroke.Search terms and results: identification of articlesAt the time of the review, the PHI database contained 12,000+ records (up to June2005). The primary search strategy, using the terms ‘stroke,’ generated 277 records,as shown in Table 9.1. All abstracts were reviewed. When assessed against the reviewinclusion criteria, 114 articles were retrieved and reviewed in full. Of these, 54articles were included in the review.Table.9.1 Number of articles identified by the literature reviewSource Results of search No. of articlesconsidered eligiblePHI database: original search (upto June 2005)Total number= 12,562Number of articlesincluded in review277 114 44Supplementary search - - 10TOTAL - - 54Supplementary searches included hand-searching of titles from 2004 to 2006 of thefollowing key journals:-Clinical Rehabilitation-Health and Quality of Life <strong>Outcomes</strong>-Medical Care-Quality of Life Research-<strong>Stroke</strong>300
Reproducibility of the SF-36 was assessed in a study of UK patients randomlyselected from the International <strong>Stroke</strong> Trial (Dorman et al., 1999). SF36 domains weregenerally found to be acceptable, except for the Mental Health domain (ICC=0.30when completed by patients; ICC=0.24 when patient assisted by a relative or friend).However, 95% CIs for the mean differences between scores between test and re-testwere substantial across dimensions. Reproducibility was higher when patientscompleted instruments alone than when they were proxy rated.Item-total correlations were reported to be good by Hagen et al., (2003), although theworst were for the item 'I expect my health to get worse' in the General Health scale.This item may well seem irrelevant after a stroke.ValidityConstruct validity was assessed by Hobart et al., (2002) who reported item-totalcorrelations in excess of 0.4 for all items in their respective dimensions, except fortwo items in the General Health scale.Dorman et al., (1999) found that the domains of Physical Functioning, SocialFunctioning, Bodily Pain and General Health as measured by the SF-36 and EuroQolinstruments were strongly correlated. However, Mental Health as measured on theSF-36 was poorly correlated with the Psychological Functioning domain of theEuroQol (rho =0.21, p
etween AAP scores and scores on the Social Functioning scale and concluded thatthe Social Functioning domain did not assess in a way that was meaningful to strokepatients.Hagen et al., (2003) found significant correlations between SF-36 domains and a selfcompleted version of the Barthel Index and the Canadian Neurological Scale (Cote etal., 1986) over three administrations. The Physical Functioning domain was veryhighly correlated with the Barthel Index and the Canadian Neurological Scale.Duncan et al., (2002) found moderate correlations between physical measures ofhealth status on the <strong>Stroke</strong> Impact Scale and the Physical Dimension of the SF-36.Patel et al., (2006) found a graded positive relationship between all SF-36 domainsand the Barthel Index and Frenchay Activities Index.Scores on the Physical Function domain of the SF-36 were found to be highly relatedto the modified Rankin <strong>Stroke</strong> Outcome Scale (a measure of disability assessed byclinicians) in a survey of 459 stroke patients in the USA (Duncan et al., 2000).The developers of the SF-36 suggest a method of calculating two summary scoresfrom the results gained on the eight dimensions. Hobart et al., (2002) tried to replicatethis work using higher order factor analytic techniques on their data. They found thehypothesised two factor solution, but as it accounted for only 60% of the variancethey argue that a substantial amount of the information is lost by reporting thesesummary statistics alone.Williams et al., (1999b) found, in a regression analysis that the SF-36 did not predictoverall self-reported quality of life, and suggest the instrument may be insufficientlysensitive to quality of life changes after stroke.ResponsivenessResponsiveness was assessed in patients at one, three and six months post-stroke(Hagen et al., 2003). The authors suggest that low sensitivity to change was found onthree SF-36 scales: Bodily Pain, General Health and Mental Health, and for othersubscales sensitivity to change was comparable to the Barthel Index. However, theevidence presented in their paper suggests that the Barthel Index indicated far greaterchange (SRM=0.51) than that found on any of the dimensions on the SF-36 (indeed,the SRMs only get close to this on two dimensions: Social Functioning=0.39; RolePhysical = 0.33).PrecisionFloor and ceiling effects were reported in a number of studies. Role Physical wasfound to have substantial floor effects (70%) in the study reported by Hagen et al.,(2003). Other 'end' effects reported in that study included 35% ceiling effects for thePain dimension, 23% scores exhibiting a floor effect for Physical Functioning and27% floor and 16% ceiling effects for Social Functioning. Hobart et al., (2002) alsofound serious floor effects (59.1%) for the Role Physical dimension and ceilingeffects for Social Functioning (29.9%), Bodily Pain (25.6%) and Role Emotional(63.1%) domains. Somewhat different results were reported by Anderson et al.,(1996), who found considerable ceiling effects for the Role Physical, RoleLimitations, Social Functioning and Bodily Pain dimensions of the SF-36, and303
Hamedani et al., (2001) who also found ceiling effects for Physical Functioning, RolePhysical, Bodily Pain, Social Functioning and Role Emotional. O'Mahony et al.,(1998) report ceiling effects on the Role Emotional, Role Physical, SocialFunctioning, Mental Health, and Bodily Pain dimensions in a small scale survey ofolder stroke patients. They also report floor effects on Role Physical, Role Emotional,Mental Health and Physical Functioning domains. Pickard et al., (2005) report ceilingeffects on the Role Emotional domain and floor effects on the Physical Functioning,Role Physical and Role Emotional domains.Lai et al., (2004) compared results gained from the SIS Participation Domain and theSIS-16 (measuring Physical Function) with the SF-36 Social Functioning andPhysical Functioning Domains. Rasch analyses indicated that both the SIS-16 and SF-36 Physical Functioning domain both showed a good spread of item difficulty, but theSIS-16 incorporates easier items that are capable of measuring lower levels ofphysical functioning in patients with severe stroke. Similar analyses of the SISParticipation domain and the SF-36 Physical Functioning domain indicated that theSIS measure has widespread item difficulty, whereas the SF-36 domain does not. TheSocial Functioning domain of the SF-36 contains only two items, measuring the samelevel of item difficulty, leading to severe ceiling effects and consequently an inabilityto discriminate among more active patients.AcceptabilityAnderson et al., (1996) reported that of the 124 patients approached to undertake aninterview administration of the SF-36, 13 were unable to communicate sufficientlywell to complete the instrument. Dorman et al., (1999) randomly selected UK patientsfrom the International <strong>Stroke</strong> Trial. An initial survey was undertaken in which patientscompleted either the EuroQol questionnaire or the SF-36. Respondents to the EuroQolwere then mailed a copy of the SF-36 at a three week follow-up (n=272), andrespondents to the EuroQol were mailed a copy of the SF-36 at follow-up (n=505).Ninety-one percent sent the EuroQol at follow-up replied, whilst 85% of those sentthe SF-36 at follow-up responded.O'Mahony et al., (1998) reported poor completion rates on the SF-36 andconsequently difficulties calculating dimension scores in older age group strokepatients. Similarly, O'Mahony et al., (1998) claimed that completion rates for someitems were as low as 66%. Hagen et al., (2003) simply reported that some of thepatients in their study 'encountered some problems' completing the SF-36.Dorman et al., (1997, 1999) randomised all patients who had been entered by UKcentres to the International <strong>Stroke</strong> Trial between March 1992 and May 1995, whowere not known to have died, to either the EuroQol or SF-36 instruments. Theacceptability of the EuroQol appeared superior with a 5% difference in returnsbetween the two measures, whilst missing data was found on returned SF-36 forms in45% cases and 34% on the EuroQol.FeasibilitySegal and Schall (1994) evaluated the feasibility of using reports by carers tocomplete the SF-36 (which they refer to in the paper as the Health StatusQuestionnaire - HSQ). Proxy agreement with patient evaluations was low, and theauthors claim that the instrument is an inadequate outcome measure in stroke. They304
find high levels of association between patient and carer completion of functionalassessment measures (the Functional Independence Measure - FIM and FrenchayActivities Index - FAI), which they suggest indicates their superior measurementproperties. This view could be criticised as the FAI and FIM were designed forcompletion by observers of the patient, whereas the SF-36 was designed to tapsubjective experience, which is not always readily observed.b) SF-12The SF-12 contains a sub-set of the items included in the SF-36, and was initiallydesigned to reduce patient burden and provide the summary Mental Health andPhysical Health Component Scores. The instrument was assessed in six papers, noneof which were based on data collected in the UK.ReliabilityBohannon et al., (2004a) evaluated the internal consistency of the twelve items of theSF-12 using the alpha statistic, and found internal consistency reliability for themeasure as a whole to be high at three different times, following stroke, and threemonths and twelve months after stroke (alpha values = 0.83, 0.88 and 0.89,respectively). Bohannon et al., (2004b), in a separate study, evaluated the test-retestreliability of the SF-36 in a small telephone interview based survey of 31 strokepatients. The SF-12 was administered at two occasions 16.2 +/- 5 days apart. Themean difference between the two administrations was less than 1.5 points on both thePhysical Component Scale (PCS) and Mental Component Scale (MCS) scores. Theauthors claim that ICC's for both summary scores of 0.80 p
Lim and Harris (1999) report that trends for PCS and MCS scores were worse forthose who were older and women who had longer hospital stays. However, thestatistically significant results are possibly due to multiple comparisons on a largedataset. Furthermore, the data are aggregated heart disease and stroke patients.Rubenach et al., (2000) in a small scale telephone survey found that PCS scores wereable to discriminate patients classified as dependent from those classified asindependent in activities of daily living as indicated on the Barthel Index. They alsofound poorer PCS and MCS scores observed in patients with high GHQ-28 scores.They suggest this provides evidence that the SF-12 provides a ‘valid indicator ofhealth-related quality of life among patients with stroke’. However the association ofGHQ-28 scores with the PCS may be seen as evidence against such a claim. Theauthors counter such a potential criticism by claiming that the GHQ-28 ‘may reflectquestions with a somatic emphasis’. This is indeed true (the GHQ-28 can provide aSomatic sub-scale score), but scores can be calculated from the GHQ-28 to overcomethis (i.e. scores for the Severe Depression and Anxiety sub-scales). However,Rubenach et al., (2000) do not undertake such analyses.King et al., (2005) found a relationship between Hospital and Anxiety Scale (HAD)Anxiety scores and the MCS on the SF-12. However, no such relationship was foundbetween MCS and the HAD Depression scale. The authors suggest that the HADDepression scale is measuring a somewhat different aspect of mental health than theMCS, which is assessing general mental health status. They also report high levels ofassociation between functional status measures (including the self-report BarthelIndex and Glasgow Outcome Scale) and the PCS.Pickard et al., (1999) compared SF-12 Physical Mobility Component Scores (PCS-12)to SF-36 Physical Mobility Component Scores (PCS-36) and found them be highlycorrelated (intra-correlation coefficient 0.95). Similarly, Mental Health ComponentScores (MCS-12) were compared to SF-36 Mental Health Component Scores (MCS-36) and found to be highly correlated (ICC = 0.97). Mean scores between the twomeasures were separated by only a few points (Pickard et al., 1999). However, suchsmall differences can be meaningful (Jenkinson 1998), and could mean the SF-12 isnot exactly replicating SF-36 results in this patient group.ResponsivenessBohannon et al., (2004) report results from a longitudinal survey over a period oftwelve months, and report that PCS scores drop three months after stroke, and thenimprove at follow-up twelve months later. MCS scores did not change over the 12months of the study. The authors claim that these results suggest that the SF-12 issensitive to changes in health as a result of stroke, but provide no evidence that thechanges are either accurate or meaningful.PrecisionNo data available.AcceptabilityLim and Harris claim that over 50% of respondents (heart disease and stroke patients)omitted at least one item which, unless a data substitution algorithm is used, wouldsuggest over half of the PCS and MCS scores could not be calculated. Rubenach et306
al., (2000), however, claim that the SF-12 may be an appropriate instrument to use inpostal surveys. In a small scale survey (n=45) by telephone they claimed that ‘85% ofpatients who were able to be interviewed fully completed the SF-12’.FeasibilityNo data available.c) SF-6DThe SF-6D index score can be calculated from six items of the SF-36. It is onlyincluded in this review because any data set containing the SF-36 is amenable to suchanalyses. It is a preference/utility based measure intended for providing an indexintended for use in QALY calculations.ReliabilityNo data available.ValidityQALY estimates based on the SF-6D were half as large as those calculated whenusing the HUI3 or EQ-5D Index (Pickard et al., 2005), which may cast some doubt asto the appropriateness of this instrument in stroke.ResponsivenessThe SF-6D was found to be more responsive to change than the EuroQol (Pickard etal., 2005). Pickard et al., (2005) also report that change scores were found to be highlycorrelated with EQ-VAS, EQ-5D Index and HUI3.PrecisionNo data available.AcceptabilityNo data available.FeasibilityNo data available.307
a) SF-36; SF12; SF-6DTable 9.2: Developmental and evaluation studies relating to the SF-36, SF-12 and SF-6D in strokeStudy/CountryPopulation (N)AgeMethod of administrationSetting<strong>Measurement</strong> propertiesSF-36 Reliability Validity Responsiveness Precision Acceptability FeasibilityAnderson C, etal., 1996Australia<strong>Stroke</strong> patients (90)Age: mean 72Out-patientsInterview administeredInternalconsistency Construct Dorman P etal., 1997UKDorman P etal., 1998UKDorman P etal., 1999UKDuncan P, etal., 2000AmericaDuncan et al.,2002AmericaHackett et al.,2000New Zealand<strong>Stroke</strong> patients (2253)Age: mean not specifiedRCT of measuresPostal administration<strong>Stroke</strong> patients (SF-36 n=253;EuroQol=271)Age: mean not specifiedOut-patientsPostal administration<strong>Stroke</strong> patients (2253)Age: mean not specifiedRCT of measuresPostal administration<strong>Stroke</strong> patients (459)Age: 70+/- 11.4 yearsOut-patientsMethod of administration not specified<strong>Stroke</strong> patients(125)Mean age = 68.1Telephone administration of SF-36639 stroke patients and 310 controls76% of cases aged 65 or over<strong>Stroke</strong> patients interviewed 6 years afterstrokeInternalconsistency Test-retest Construct Construct Construct Construct Construct Construct Hamedani etal., 2002UK111 stroke patients (40 interviewed, 71sent questionnaire)<strong>Patient</strong>s aged between 18 and 49Open ended interviews and telephoneadministered questionnaire interviews308
Study/CountryPopulation (N)AgeMethod of administrationSetting<strong>Measurement</strong> propertiesSF-36 Reliability Validity Responsiveness Precision Acceptability FeasibilityHobart et al.,2002UK177 <strong>Stroke</strong> patientsMean age=62Face to face interview administration ofSF-36Internalconsistency Construct Lai et al., 2003USAO'Mahony etal., 1998Patel et al.,2006UKPickard et al.,2005CanadaSegall andSchall, 1994USAWilliams et al.,1999a278 individuals with strokeAge (mean) 72.5Interview survey<strong>Stroke</strong> patients (73)Age: impossible to determine.<strong>Stroke</strong> patients (490)Age:SF-36 collected by interview<strong>Stroke</strong> patients (n=124)Age (mean) 67Self completion but 53% of respondentsrequired assistance.Longitudinal survey<strong>Stroke</strong> patients (38) and their carersAge mean 65 (patients) and 54 (carers)<strong>Stroke</strong> patients (n=71)Age mean 61Interview administered survey of patientsin three hospitalsConstruct Construct Proxy versus self -reportSF-12 Reliability Validity Responsiveness Precision Acceptability FeasibilityBohannon etal., 2004aUSA<strong>Stroke</strong> patients (90)Age: mean 70.4In-patientsInterview administeredInternalconsistency Construct Bohannon etal., 2004bUSAKing et al.,2005 USALim and Fisher1999Australia<strong>Stroke</strong> patients (31)Age: mean 66.5In-patientsInterview administered, by telephone<strong>Stroke</strong> patients (n=170)Mean age = 53.5 yearsSF-12 self completed(2341 respondents of which 62%diagnosed with stroke)Age: mean 66.5Postal surveyTest re-test ConstructInternalconsistency Construct Construct 309
Study/CountryPopulation (N)AgeMethod of administrationSetting<strong>Measurement</strong> propertiesSF-12 Reliability Validity Responsiveness Precision Acceptability FeasibilityPickard et al.,1999Canada<strong>Stroke</strong> patients (n=161, of which 53proxy completed)Age (mean) 72.11Self completion but 32.92% proxycompleted)Construct Rubenach etal., 2000AustraliaSF-6DPickard et al.,2005Canada<strong>Stroke</strong> patients (40)Age: not specifiedTelephone interview<strong>Stroke</strong> patients (n=124)Age (mean) 67Self completion but 53% of respondentsrequired assistance.Longitudinal surveyInternalconsistency Construct Construct 310
d) EuroQol- EQ-5DThe EuroQol was evaluated in six papers, two of which were based on data gainedfrom the UK (Dorman et al., 1997, 1999). Results from the UK papers were basedupon the same dataset.ReliabilityTest-retest reliability was found to be good for the EuroQol in a study of UK patientsrandomly selected from the International <strong>Stroke</strong> Trial (Dorman et al., 1997, 1999).The authors claim the EuroQol overall score has greater reproducibility thanindividual items whether weighted by utility weights or not. Unweighted Kappavalues for the utility weighted EuroQol were 0.83 for questionnaires completed by thepatient alone and 0.81 for those completed by proxy.ValidityThe construct validity of the EuroQol was assessed by Dorman et al., (1999) whocompared results on the measure with those gained from the SF-36. Measuresassessing Physical Functioning, Social Functioning, Bodily Pain and Overall Healthwere highly correlated, but this was not the case for Mental Health which was poorlycorrelated on the two measures. They suggest this may be due to the instrumentstapping different aspects of mental health or possible measurement error on the SF-36.However, no firm conclusion is drawn from this finding.McPherson et al., (2004) compared population based valuation estimates for theEuroQol with those elicited from patients. Valuations provided by stroke patientswere significantly different from population-based ratings and correlations betweenEuroQol Index calculations based on the two weighting schemes were poor.Population based ratings of health are systematically lower than ratings gained frompatients with stroke. Additionally, the magnitude of this difference depends on healthstatus in a curvilinear way, increasing as health state severity increases but decreasingin the most severe states. The authors conclude that the valuations used in any givensurvey could have considerable effects on the results, and this has importantimplications for interpreting shifts in health status valuations following interventions.Polsky et al., (2001) examined the health status of patients enrolled in a clinical trialfor a new drug for treating aneurysmal subarachnoid haemorrhage. These assessmentswere made using the EuroQol classification and weighting system, and also the visualanalogue ‘thermometer’. They developed a model for predicting responses to thethermometer and derived scoring weights for the EuroQol health state classificationthat met convergent validity criterion of having higher predicted scores for betteroutcomes and lower scores for worse outcomes. They suggest the scoring rule theydeveloped could be used to impute health valuations in clinical trials when self-ratingfor health states is not possible. Additionally, they found differences on scores gainedfrom stroke patients than from the general public, with the general public ratinghigher (i.e. better) levels of function more favourably than stroke patients, yet worselevels of function less favourably than stroke patients.311
ResponsivenessChange scores EQ-VAS and EuroQol EQ-5D Index have been found to be highlycorrelated with results from other utility measures (SF-6D and HUI3), as well asclinically assessed Barthel Index change scores (Pickard et al., 2005).PrecisionPoissant et al., (2004) reported that in a ‘high functioning’ stroke population theEuroQol EQ-5D exhibited an end effect with many patients scoring as ‘perfect health’on the utility index but not on the EQ-VAS.AcceptabilityThe acceptability of the EuroQol has been evaluated in a study in which the EuroQoland the SF-36 were randomly allocated to patients taking part in the International<strong>Stroke</strong> Trial (Dorman et al., 1997, 1998). One thousand one hundred and twenty five(1125) patients were randomly selected to receive the EuroQol and 1128 to receivethe SF-36. The response frequency was found to be statistically significantly higherfor the EuroQol (80% versus 75%). <strong>Patient</strong>s returning the questionnaire were thensent another copy 'within approximately three weeks' (-sic) to assess response rate andtest-retest reliability. A similar proportion responded for each questionnaire (86% forthe EuroQol versus 83% for the SF-36). Respondents were asked if they required helpcompleting the instruments and 52% requested help with the EuroQol and 51% withthe SF-36.Table 9.3: Developmental and evaluation studies relating to the EuroQol in strokeStudy/CountryPopulation (N)AgeMethod ofadministrationSetting<strong>Measurement</strong> propertiesEuroQol Reliability Validity Responsiveness Precision Acceptability FeasibilityDorman <strong>Stroke</strong> patients (2253)Constructet al.,1999 UKAge: mean not specifiedRCT of measuresPostal administrationTest re-testDormanP et al.,1997UKMcPherson et al.,2004NewZealandPickardetal.,.2005CanadaPoissantet al.,2003CanadaPolsky etal.,2000USA<strong>Stroke</strong> patients (2253)Age: mean not specifiedRCT of measuresPostal administration<strong>Stroke</strong> patients (585)age 79% aged 60 orover; 54% aged 70 oroverPostal survey<strong>Stroke</strong> patients (n=124)Age (mean) 67Self completionLongitudinal survey<strong>Stroke</strong> patient (n=91)Age (mean) 69Six months post strokeSelf completion<strong>Stroke</strong> patients (649,aneurysmalsubarachnoidhaemorrhage)Age: mean 50Interview administrationConstructConstructConstructConstructConstruct312
e) Health Utilities Index (HUI)The Health Utility Index is a preference/utility instrument designed for use ineconomic analyses. The measure has been updated and is currently in its third version(HUI-3). Three papers were found that report on the evaluation of the HUI-3 in theUSA and Canada.ReliabilityGoldstein et al., (2002) found reasonable test-retest results for most dimensions of theHUI-3. However, the Speech dimension on the HUI-3 showed very poor test-retestreliability (ICC=0.28).Goldstein et al., (2002) found no significant differences between mean scores forpatient and carer pairs when completing the HUI-3. However, this may be due to thesmall sample size (n=73 pairs at two time periods) and high degrees of missing data(see below) as correlation coefficients were variable, ranging from a low 0.24 to ahigh 0.88. The fact that the data was pooled (i.e. patient and carers completed themeasures at two time periods) may also artificially raise the level of correlation.ValidityThe construct validity of the HUI-3 was assessed by Grootendorst et al., (2000) inrespondents reporting having had a stroke or arthritis in the Ontario Health Survey.Subjects with stroke (n=173) or arthritis (n=7,751) had substantially lower healthrelated quality of life than those not reporting such conditions (referred to as the'reference group'). Respondents with stroke reported worse health on the Global utilityIndex than either arthritis patients or the reference group (n=53,838). Furthermore,stroke patients had lower (i.e. worse) scores on all eight dimension scores on the eightsingle attribute scores.HUI-3 scores were compared to known groups defined by the Barthel Index. Scoreson the HUI measures were found to distinguish between mild and moderate/severecases as defined by the Barthel Index, but did not distinguish between moderate andsevere groups.ResponsivenessChange scores for HUI-3 have been found to be highly correlated with results fromother utility measures (EQ-5D and SF-6D), as well as clinically assessed BarthelIndex change scores (Pickard et al., 2005). Pickard et al., (2005) also report that theHUI-3 was found to be more responsive than the HUI-2 and the VAS on the EuroQol.PrecisionNo data available.AcceptabilityGoldstein et al., (2002) report that the percentage of missing data on the HUI-3 was‘surprisingly high’ with at least one item of assessment missing in over 70% of cases.They argue that the high proportion of missing data would limit the usefulness of theHUI-3 in the context of stroke trials.313
FeasibilityNo data available.Table 9.4: Developmental and evaluation studies relating to the HUI-3 in strokeStudy/CountryPopulation (N)AgeMethod ofadministrationSetting<strong>Measurement</strong> propertiesHUI Reliability Validity Responsiveness Precision Acceptability FeasibilityGoldsteinLB et al.,2002USA<strong>Stroke</strong> patients(73)Age: 64 yearspopulationsurveyMethod ofadministrationTelephoneInterview surveyTest-retestConstruct Grootendorst P, etal., 2000CanadaPickard etal., 2005Canada<strong>Stroke</strong> patients(173)Age: 63 yearspopulationsurveyMethod ofadministrationpostal survey<strong>Stroke</strong> patients(n=124)Age (mean) 67Self completionbut 53% ofrespondentsrequiredassistance.LongitudinalsurveyConstructf) Nottingham Health Profile (NHP)ReliabilityThe test re-test reliability of the NHP was assessed in a postal study of 21 strokepatients. Questionnaires were sent to patients on the North East Thames OutcomeStudy six months after a stroke, and then a further questionnaire was sent two weekslater. The authors report significant variation in scores between the twoadministrations, and poor coefficients of repeatability (Trigg and Wood, 2000).ValidityThe construct validity of the NHP was indirectly assessed in a survey evaluating theSubjective Index of Physical and Social Outcome (SIPSO) (Trigg and Wood, 2000).The NHP domain of Mobility was highly correlated with scores on the Physicalsubscale of the SIPSO, and the NHP domains of Emotional Health and SocialFunctioning were highly correlated with the Social subscale of the SIPSO.ResponsivenessNo information available.314
PrecisionNo information available.AcceptabilityNo information available.FeasibilityNo information available.Table 9.5: Developmental and evaluation studies relating to the NHP in strokeStudy/CountryPopulation (N)AgeMethod ofadministrationSetting<strong>Measurement</strong> propertiesNHP Reliability Validity Responsiveness Precision Acceptability FeasibilityTrigg andWood, 2000Gompertz etal., 1993UK<strong>Stroke</strong> patients(157)Age notspecifiedPostal survey<strong>Stroke</strong> patients(21)Age (mean) 69Longitudinalpostal surveyTest-retestConstruct315
RESULTS: STROKE-SPECIFIC PATIENT REPORTED HEALTHINSTRUMENTS:Seven <strong>Stroke</strong> -specific instruments were identified which were evaluated with patientswith COPD. Full details of the development, domains and scoring methods aredetailed in Tables 9.6 and 9.7.The following instruments measurement properties are reported:a) <strong>Stroke</strong> Impact Scaleb) <strong>Stroke</strong> Specific Quality of Life Scalec) Subjective Index of Physical and Social <strong>Outcomes</strong>d) The Barthel Indexe) Frenchay Activities Indexf) Nottingham Extended Activities of Daily Living (ADL) Scaleg) London Handicap Scalea) <strong>Stroke</strong> Impact Scale Versions 2 and 3The developers of the <strong>Stroke</strong> Impact Scale noted that many instruments, such as theSIP and SF-36, exhibited ceiling and floor effects in stroke populations.Consequently, these measures had limited ability to evaluate stroke outcomes overtime. Consequently, they decided to develop a stroke specific measure that mayovercome such problems (Lai et al., 2003). The instrument content was derived frominput from stroke patients, caregivers and health professionals with experience in thefield of stroke. It contains 59 items across eight domains (Strength, Hand Function,ADL/IADL, Mobility, Emotion, Memory, Communication and Social Participation).A related measure to the SIS is the SIS-16 which was designed to assess physicalfunctioning and be more sensitive to differences than existing measures of physicalfunction. The SIS-16 contains 16 items from the SIS measuring ADL/IADL, mobilityand hand function (Edwards and O’Connell, 2003). The SIS Version 3 contains minormodifications but consists of the same items and domains as the SIS Version 2. Note:Version 1 of the SIS is reported only in unpublished literature.b) <strong>Stroke</strong> Specific Quality of Life Scale (SS-QOL)At the time of the development of the SS-QOL the authors argued that there was nostroke specific health related quality of life measures available. Consequently,Williams et al., (1999a) set about devising a stroke specific QOL measure developedfrom interviews with patients. Thirty four survivors of ischemic stroke wereinterviewed to identify common themes that affect stroke patients’ quality of life.Subjects included in the interviews were identified from stroke clinics one to sixmonths after stroke and with no significant cognitive or language impairment. <strong>Patient</strong>swere asked to identify three areas most affected by their stroke. Twelve commonlyaffected domains were identified: energy, family roles, language, mobility, mood,personality, self-care, social roles, thinking, upper extremity function, vision, andwork/productivity. The final instrument contains 49 items measuring these concepts.316
c) Subjective Index of Physical and Social <strong>Outcomes</strong> (SIPSO)The SIPSO is an outcome tool that was designed to measure people's socialintegration rather than their abilities per se. It contains 10 items giving an overallscore as well as Physical and Social Component scores.The definition of social integration used in the work initially incorporatedenvironment, activities as well as social integration. However, during testdevelopment the items relating to environment were omitted as they failed to fulfil thecriteria necessary for inclusion. The authors claim that the main aim of rehabilitationshould be to reintegrate the patient into as normal a lifestyle as possible. Interviewswith patients and carers were undertaken covering three aspects of their life: (1) prestroke,(2) life since stroke and (3) perceptions of change since stroke. Contentanalysis was undertaken on this data (Trigg et al., 1999). On the basis of theinterviews a questionnaire was developed and tested (Trigg and Wood, 2000). Theauthors claim that the SIPSO measures the ability of an individual to reintegrate to hisor her own satisfaction.An overall score can be calculated together with Physical and Social subscale scores.d) The Barthel IndexThe Barthel Index was originally developed for use in clinical practice as a means ofassessing the degree of independence in patients with neurological and neuromuscularlimitations. Strictly speaking, the instrument is neither stroke specific nor developedfor completion by patients. However, it is widely used in the field of rehabilitationand patient completed versions of the instrument have been developed.The original Barthel Index consists of ten items, each of which is rated in terms of thepatient’s ability to undertake the task. <strong>Patient</strong>s are classified into one of dependent,performs task with help and independent. In the original index there were ten areascovered (Bowel control, Bladder control, Grooming, Toilet use, Feeding, Transfer(from bed to chair), Mobility, Dressing, Stairs, Bathing). There have been a number ofmodifications to this original formulation, including a version with fifteen areascovered called the Modified Barthel Index (Granger et al., 1979), and one developedby Wade and Collin (1988) which uses simplified scoring algorithms.e) Frenchay Activities IndexThe Frenchay Activities Index (FAI) was developed as a means of measuring socialactivities and lifestyle following stroke, to supplement the more basic functionalactivities of daily living assessed by measures such as the Barthel Index. The FAI wasdesigned from the outset to be an instrument that would be administered by theclinician to the patient in the clinical interview (Holbrook and Skilbeck, 1983; Wadeet al., 1985).f) Nottingham Extended Activities of Daily Living (ADL) ScaleThe Nottingham Extended ADL Scale was developed and evaluated as aquestionnaire for postal use (Nouri and Lincoln, 1987). It assesses the ability to carryout functional tasks, such as using public transport, housework, social life andhobbies. Scores in four areas: mobility, kitchen tasks, domestic activities and leisureactivities can be added to give a summary score out of 22. Respondents are asked317
whether they do the activity rather than if they can do it, in order to assess level ofactivity rather than capability.g) London Handicap ScaleThe London Handicap Scale (LHS) was developed in response to the need formeasures of morbidity to complement mortality statistics in the evaluation of healthcare interventions and services (Harwood, et al., 1994). Handicap is the disadvantageexperienced by an individual patient because of ill-health. The developers adopt adefinition of handicap developed by the World Health Organisation and claim that itcan be classified according to disadvantages in each of six dimensions: mobility,physical independence, occupation, social integration, and economic self sufficiency.The LHS contains one item for each of these dimensions. A single index score isgained by summing and weighting responses to these items. The measure wasdesigned for use in rehabilitation, hence its inclusion in this review as a stroke specificmeasure. However, although it has been primarily used in stroke patients it could beused in other serious illness where patients undergo rehabilitation.318
STROKE-SPECIFIC INSTRUMENTS:Table 9.6: Details of stroke-specific patient-reported health instrumentsInstrument Domains (no. items) Response options Score Administration/Completion (time)<strong>Stroke</strong> Impact Scale(SIS); Duncan et al.,1997, Wallace et al.,2002<strong>Stroke</strong> Specific Qualityof Life Scale; Williamset al., 1999Subjective Index ofPhysical and SocialOutcome (SIPSO);Trigg and Wood, 1999,2000, 2003Strength, Hand Function, ADL/IADL, Mobility, Emotion, Memory,Communication, Social Participation (SIS version 3 contains 59 items in total)Energy (3), Family roles (3), Language (5), Mobility (6), Mood (5), Personality(3), Self-care (5), Social roles (5), Thinking (3), Upper extremity function (5),Vision (3), Work (3)Overall score (10)Physical component (5)Social component (5)5 point scales0-100 for all dimensionsand aggregate ‘PhysicalDomain’5 point scale Unweighted averages ofitems per domain (0-5)Overall score 0-605 point scales Mean score0-40 (overall)0-20 for Physical andSocial Component scoresInterviewSelf completionInterviewSelf completion<strong>Stroke</strong> adapted 30 itemSickness Impact Profile(30); Straten et al., 1997Barthel Index (10);Mahoney and Barthel,1965Modified Barthel Index(15); Granger et al.,1979Stroake and AphasiaQuality of Life scaleEmotional Behaviour (4); Body care and movement (5); Householdmanagement (4); Mobility (3); Social Interaction (5); Ambulation (3);Alertness Behaviour (3); Communication (3); Physical component score (11);Psychosocial component score (15); Total score (30)Bowels (1) Bladder (1) Grooming (1) Toilet use (1) Feeding (1) Transfer (1);Mobility (1); Dressing (1); Stairs (1); Bathing (1)Drinking from a cup (1) Eating (1) Dressing - upper body (1); Dressing - lowerbody (1); Putting on brace or artificial limb (1); Grooming (1) Getting in andout of chair (1); Toilet use (1); Getting in and out of tub or shower; Walking 50yards (1); Walking up/down one flight of stairs (1); If not walking: pushing awheelchairLanguage; Thinking; Personality; Energy; Mood; Family Roles; Social Roles;Work; Overall ScoreDichotomousyes/no responsesCategorical: 2-4optionsCategorical: 2-4options0-100 for all dimensionsand summary scores0-100 (0-20 withsimplified scoring)-2 - 100Self care functions: -2 -53Mobility: 0-47.5 point scales 0-5 for all dimensions andsummary scoresInterviewMeasure initially designedfor completion byclinician, but interviewand self completionversions have beendevelopedClinician, interview andself completionInterview319
Instrument Domains (no. items) Response options Score Administration/Completion (time)39 item <strong>Stroke</strong> and Physical (17); Psychosocial (11); Communication (7); Energy (4) Overall score 5 point scales 0-5 for all dimensions and InterviewAphasia Quality of LifeScalesummary scoresLondon Handicap Scale Handicap (6)6 options per Index of handicap Interview or self(6)Frenchay ActivitiesIndex (FAI)Nottingham ExtendedActivities of DailyLiving ScaleSingle Index Scores (15) 15 items are Work; Driving, Hobby, Preparing meals,Local shopping, Reading books, Gardening, Washing up, Washing clothes,walking outside for longer than 15 minutes, Light housework, Heavyhousework, Household/car maintenance, Social occasions, Travel outingsquestion4 point scales 0 - 45 (or 15 to 60) pointIndex scoreSub dimensions:Domestic Activities;Work and Leisure;Outdoors and OtherMobility (6); Kitchen Tasks (5); Domestic tasks (5); Leisure activities (6) 4 point scales Total score, Mobility,Kitchen, Domestic andLeisure scoresInterviewSelf/proxy completionInterviewSelf completion320
InstrumentNEWSQOL(56)Table 9.7: Summary of stroke-specific instruments: health status domainsPhysicalfunctionADL/SelfcareEmotionsSleepSocial/InterpersonalCognitivefunctioningCommunicationPainRoleFunctioningFatiguex x x x x x x x x xSIS x x x xSS-QOL x x x x x x x xSIPSO x xBarthel Index x xFAI x xNottinghamExtendedADL ScaleLondonHandicapScaleReintegrationto NormalLiving Indexx xxxVision321
STROKE-SPECIFIC PATIENT- REPORTED HEALTH INSTRUMENTS:a) <strong>Stroke</strong> Impact Scale (SIS)The SIS is a relatively recent addition to the battery of measures available to measurestroke outcomes. However, despite this it has been subject to a substantial amount ofwork evaluating its measurement properties. Seven papers documenting itsdevelopment and use in the North American context, and one Australian study, werefound for this review. To date, no work on the measure has been published in the UK.ReliabilityInternal consistency reliability of the SIS was assessed in a small scale interviewsurvey of patients with mild and severe stroke (Duncan et al., 1999) and found to behigh for all eight domains in both groups. This result was broadly substantiated in alarger interview study, except for the Strength subscale where an alpha of 0.63 wasgained (n=216). Internal consistency reliability was also assessed for the SIS whenadministered by telephone and self completion and found to be high for all eightprimary dimensions (alpha >0.75) (Duncan et al., 2005). Similarly, in a postal surveythe SIS dimensions and the SIS-16 (a subset of items measuring functional ability)were found to have high internal consistency (Edwards and O’Connell, 2003).Test-retest was undertaken on 25 stroke patients and found to be good (ICC’s range0.7 to 0.92) except for the Emotion dimension (ICC=0.57) (Duncan et al., 1999).Duncan et al., (2003) evaluated the unidimensionality of dimensions on the SIS. Theyargued that domains that could not be shown to have unidimensionality would bedifficult to interpret. Consequently, they decided to apply the Rasch model to each ofthe separate dimensions of the SIS. A total of 696 subjects completed the SIS atbaseline and/or at follow-up (640 at baseline and 624 three months later). All 1264SIS questionnaires were entered into the Rasch analysis. Rasch analysis assesses theextent to which items fit a unidimensional model: poor 'fit' statistics suggest items arenot tapping a single underlying construct, and is therefore a good test of internalconsistency reliability. Rasch analysis can be used to determine whether items fit aunidimensional model, and hence can indicate internal consistency reliability. Veryfew items were indicated not to 'fit' their proposed domains, one each from thememory, mobility and participation domains. Three items from composite physicaldomain (created by aggregating the domains of strength, Hand function, ADLs/IADLsand Mobility) had poor in fit statistics.Edwards and O’Connell (2003) reported that item discriminant validity statistics (i.e.the number of correlations of items in own domains that were significantly higherthan correlations with other domains) were adequate for most dimensions of the SISand were excellent for Strength and Hand Function domains.322
ValidityConvergent and discriminant validity of the SIS-16 was supported by correlationswith the SIS and a general quality of life measure: the WHOQOL-Bref (WHOQOLGroup, 1998).Discriminant validity was assessed in an interview survey by comparison of SIS meanscores across groups defined by Rankin scores. Six of the eight domains showedsignificantly different results across scales (Duncan et al., 1999). The authors claimthat ‘criterion’ validity was also assessed against existing measures and showedmoderate to good associations with related dimensions on the SF-36, FIM and BarthelIndex (Duncan et al., 1999).In a telephone survey the SIS was found to have superior discrimination betweenRankin Scores than either the SF-36V (a modified version of the SF-36) or FunctionalIndependence Measure (Kwon et al., 2004).In a postal survey of stroke patients the SIS Physical Domain scores and theAggregate Physical Domain scores had fair to moderate correlations with data FIMMotor scores and the Physical Functioning dimension of the SF-36 gained viatelephone interview (Duncan et al., 2002).The developers also used Rasch analysis to assess the validity of the SIS (Duncan etal., 2003). One of the assumptions behind Rasch analysis is that items in a scaleshould form a hierarchy of difficulty. When measures are developed using aconceptual hierarchy then the ordering gained by Rasch analysis can be compared tothat assumed when the items were initially chosen. Finally Rasch analysis producesan index that indicates the number of distinct strata of persons discerned within eachdomain: the larger the more distinct levels of functioning can be distinguished in themeasure. A total of 696 subjects completed the SIS at baseline and/or at follow up(640 at baseline and 624 three months later). All 1264 SIS questionnaires wereentered into the Rasch analysis. In each domain empirical ordering of items bydifficulty was consistent with expectations regarding the theoretical ordering of taskdifficulty. This supports the construct validity of the SIS. Separation indices werecalculated for each domain and results were generally good, although floor or ceilingeffects were found on memory, emotion, communication and hand function domains.ResponsivenessData on change over time is reported in Duncan et al., (1999), and the authors claimthat the instrument is responsive to ‘ongoing recovery’. The authors suggest thatdifferences of approximately 10-15 points would suggest meaningful change bothclinically and subjectively.PrecisionLai et al., (2003) compared results gained from the SIS Participation Domain and theSIS-16 (measuring physical function) with the SF-36 Social Functioning and PhysicalFunctioning Domains. Rasch analyses indicated that both the SIS-16 and SF-36Physical Functioning domain both showed a good spread of item difficulty, but theSIS-16 incorporates easier items that are capable of measuring lower levels ofphysical functioning in patients with severe stroke. Similar analyses of the SISParticipation domain and the SF-36 Physical Functioning domain indicated that the323
SIS measures has a wide spread of item difficulty, whereas the SF-36 domain doesnot. The Social Functioning domain of the SF-36 contains only two items, measuringthe same level of item difficulty, leading to severe ceiling effects and consequently aninability to discriminate among more active patients.Floor or ceiling effects have, however, been found on the measure (Duncan et al.,1999, 2003). In one study floor effects were found for minor stroke patients on alldimensions except Hand Function, whilst only on Emotion was there a floor effect forsevere stroke patients (Duncan et al., 1999). However, such results could be argued assupporting the construct validity of the instrument. In another study (Duncan et al.,2003) floor effects were found on the domains of Memory, Emotion andCommunication. Floor effects suggest that stroke has had no effects in these areas,which is, of course, a possible explanation for the findings. However, ceiling effectswere found on the Hand function dimension, and this suggests some potentialmeasurement limitations on this domain for stroke patients, and the possibility thatfurther 'more severe' items could meaningfully be added.AcceptabilityDuncan et al., (2005) evaluated results from self completion and telephoneinterviewer administered versions of the SIS in a randomised controlled trial of thetwo methods of administration. Response rates for mail and telephone were 45% and69% respectively.Missing data points were present in the mail version but not in the telephone version.In a mail survey Duncan et al., (2002) reported that non-responders to the SIS hadmore severe strokes and lower functional status than responders.FeasibilityThe cost of administering the questionnaire by telephone was found to be over twicethat of self completion (Duncan et al., 2005). However, Kwon et al., (2004) suggestthat such a method may be a practical method of measuring outcomes in communitydwelling stroke survivors.324
Table 9.8: Developmental and evaluation studies relating to the <strong>Stroke</strong> Impact Scale (SIS):Study/CountryPopulation (N)AgeMethod of administrationSetting<strong>Measurement</strong> properties<strong>Stroke</strong> Impact Scale Reliability Validity Responsiveness Precision Acceptability FeasibilityDuncan et al., 1999USA33 individuals with minorstroke; 58 with major strokeMean age 69.2 (minor stroke)and 71.9 years (major stroke)Interview administeredInternal consistencyTest re-test Construct Duncan et al., 2002USADuncan et al., 2003USA125 individuals with strokeMean age 68.1 yearsPostal interview696 individuals with strokeAge: Mean 68.6Face to face interviewInternal consistencyConstruct Construct Duncan et al., 2005USAEdwards andO’Connell 2003AustraliaKwon et al., 2006USALai et al.,2003USANichols-Larsen etal., 2005USA190 individuals with strokeAge: Mean 68.6RCT of either telephoneinterview or self completionversions74 individuals with strokeAge: Mean 58.4Postal questionnaire survey136 individuals with strokeAge: Mean 68.0Telephone survey278 individuals with strokeAge (mean) 72.5Interview survey213 individuals with strokeAge (mean) 62.1Interview surveyInternal consistencyTest re-test Internal consistencyConstruct Construct Construct Construct Construct 325
) <strong>Stroke</strong> Specific Quality of Life ScaleThree studies were identified which evaluated the SS-QOL, two based on data gainedin North America and one based on UK data.ReliabilityThe developers report high internal reliability in all dimensions of the SS-QOL (alpha>= 0.73) (Williams et al., 1999a).ValidityScores one month after stroke on the domains of Energy, Family Roles, Mobility,Mood, Personality, Self-care and Work domains were significantly linearly associatedwith the corresponding scores of the BI, BDI and subscales of the SF-36. However,scores on the Language and Thinking domains were not associated with clinicianadministered NIH <strong>Stroke</strong> Scale. The authors suggest this may be because the subjectsin their study were largely unaffected by Language and Cognitive problems, thoughwhy this finding should not be replicated on the NIHSS is not fully explained. In aregression analysis overall self-reported health related quality of life was associatedwith SS-QOL domain scores, Barthel Index, NIH <strong>Stroke</strong> Scale and Beck DepressionIndex scores, but not with SF-36 scores (Williams et al., 1999b).ResponsivenessNo data available.PrecisionThe developers found no evidence for ceiling and floor effects (Williams et al.,(1999a).AcceptabilityHilari and Byng (2001) evaluated the SS-QOL for stroke patients with aphasia as partof study of 80 people with long-term aphasia. They held two focus groups and, as aconsequence, amended the form to be more easily completed by patients with aphasia.They amended the instrument so that it was interviewer administered, and simplifiedthe wording of many of the items, and changed the response categories after pilottesting the instrument on 12 patients with aphasia. However, results from amendingthe SS-QOL to a more 'communicatively accessible' version are based on very smallsamples and are very preliminary.FeasibilityNo data available.326
Table 9.9: Developmental and evaluation studies relating to the <strong>Stroke</strong> SpecificQuality of Life Scale:Study/CountryPopulation (N)AgeMethod ofadministrationSetting<strong>Measurement</strong> propertiesSS-QOL Reliability Validity Responsiveness Precision Acceptability FeasibilityHilari KandByng S.,2001UK<strong>Patient</strong>s withaphasia as aconsequence ofstroke selectedfrom focus groups(80). Age notspecifiedConstructWilliamset al.,1999aUSAWilliamset al.,1999bUSA<strong>Stroke</strong> patients(n=32 interviews;n=72 survey)Age: interviewsample - notspecified; surveysample 61 years)<strong>Stroke</strong> patients(n=71)Mean age = 61<strong>Patient</strong>s in one ofthree hospitalsInternalconsistencyConstructConstructc) Subjective Index of Physical and Social Outcome (SIPSO)The Subjective Index of Physical and Social Outcome is a measure developed andtested in the UK. Three papers were found outlining its development and validationand are included in this review.ReliabilityThe developers report high item total correlations for this ten item scale (>0.6).Internal consistency validity was calculated for the overall scale (alpha =0.92) and thePhysical Integration (alpha=0.94) and Social Integration (alpha=0.85) (Trigg andWood, 2003). A small test-retest study (n=31) was undertaken by the developers andintraclass correlation coefficients were found to be high (>0.91 for all SIPSOmeasures). A further test-retest study (n=128) confirmed these results (Trigg andWood, 2003).Kersten et al., (2004) evaluated internal consistency reliability of the SIPSO in asurvey of young adults with stroke and found to be very high (overall score alpha=0.90; 0.92 for Physical Integration subscale and 0.82 for the Social Integrationsubscale. Test re-test was also found to be good with an intra-class correlationcoefficient of 0.96 for the overall score, and 0.94 and 0.95 for the Physical Integrationand Social Integration subscales.ValidityThe constructs used by the developers in validating the SIPSO were generated withrespect to four other measures: the Barthel Index, the Frenchay Activities Index, theWakefield Depression Inventory and the Nottingham Health Profile (NHP). It washypothesised that the results of the SIPSO would correlate with each of thesemeasures so that patients who were better integrated would be more able to perform327
asic tasks, have better self assessed health and be less depressed. The SIPSOPhysical Scale was most highly correlated with the Barthel Index, Frenchay ActivitiesIndex and Mobility on the NHP, suggesting it is tapping some aspect of physicalability. Indeed no significant correlations were found between the Physical Functionscale of the SIPSO and dimensions of Emotion, Sleep and Social Functioning on theNHP. The Social Functioning scale of the SIPSO was found to be more highlycorrelated with the Wakefield Depression Inventory, Emotion and Social Functioningon the NHP (Trigg and Wood, 2003).In a further validation paper of the SIPSO Trigg and Wood (2003) administered sixdimensions of the FLP and SIPSO to122 patients. They hypothesised that the peoplewho displayed better Physical and Social outcomes on the SIPSO would show betterAmbulation, Mobility, Recreation, Social Interaction, Emotion and Communicationscores on the FLP. All correlations between these SIPSO scores and FLP dimensionscores were significant and none fell below 0.45.Responders with poorer outcomes in terms of 'returning to work' and those reportingphysical limitations and problems with their sex lives had poorer SIPSO scores. Noassociations were found for SIPSO scores and age or sex (Kersten et al., 2004).ResponsivenessNo data available.PrecisionThe developers report that the measure shows ‘little ceiling or floor effect’ (Trigg andWood, 2000). Scores range from 0 to 40 (i.e. across the score band) with aninterquartile range of 15-32 a median of 24 and mode of 22 (Trigg and Wood, 2003).AcceptabilityItem completion was high, with missing data highest (7%) for the item 'Since yourstroke how independent are you in your ability to move around your localneighbourhood?' (Kersten et al.,2004).FeasibilityNo data available.328
Table 9.10: Developmental and evaluation studies relating to the Subjective Index ofPhysical and Social Outcome (SIPSO):Study/CountryPopulation (N)AgeMethod ofadministrationSetting<strong>Measurement</strong> propertiesSIPSO Reliability Validity Responsiveness Precision Acceptability FeasibilityKerstenet al.,2004 UKConstructTriggandWood,2000UKTriggandWood,2003UK390 individualswith strokeAge: Mean 57.7Postal survey157 patientswith strokeAge: notspecifiedPostal survey268 patientswith strokeAge 75 n=97Postal surveyInternalconsistencyTest re-testInternalconsistencyTest re-testInternalconsistencyTest re-testConstructConstructd) The Barthel Index/Modified Barthel IndexThe Barthel Index is typically completed by a clinician. However, a number ofversions of the instrument exist which are suitable for patient completion. Onlystudies where the measure has been completed by the patient are included in thisreview. Five papers based on data from the UK and two papers from the USA areincluded.ReliabilityThe Barthel Index when completed by patients (or by an unspecified number of proxyrespondents) and internal reliability was found to be high (alpha=0.83, n=82) (Sadariaet al., 2001). Gompertz et al., (1993, 1994) undertook a small scale evaluation of thetest re-test reliability of the Barthel Index in a postal survey (n=21). The meandifference in total score was -0.5 (SD 2.1) out of 20, with 95% CI of -4.6 to 3.6corresponding to a change in dependence of up to two ADL items. The authorssuggest that these results indicate a postal Barthel Index is both practicable andreliable.ValidityCorrelations between the FIM and the Barthel Index have been found to be high(rho=0.97, n=82) (Sadaria et al., 2001). A self completion version of the BarthelIndex was found to correlate very highly with the Physical subscale of the SubjectiveIndex of Physical and Social Outcome, r=0.82, p
In another interview based study results on the Barthel Index (Shah modified version,Shah, 1994) were found to be highly correlated with the Nottingham Extended ADLIndex both at discharge and follow up.ResponsivenessEffect sizes indicating an instrument’s ability to detect change were found to be highfor both the Barthel Index and the FIM (2.2 and 2.4, respectively, n=82) (Sadaria, etal., 2001). However, Jacob-Lloyd (2005) found the Barthel Index (Shah modifiedversion, Shah, et al., 1989).to be insensitive to changes over time in their study of 55patients, whereas the Nottingham Extended ADL scale detected considerable change.PrecisionJacob-Lloyd et al., (2005) claimed that the Barthel Index (Shah modified version,Shah et al., 1989) showed signs of ceiling effects in a study of 54 patients withcomplete data on the measure. However, only 2 respondents gained a score at theceiling so this claims seems hard to justify.AcceptabilityGompertz et al., (1994) evaluated a test re-test version of the BI on 21 patients. Theydo not explicitly state what number responded to the follow up, but claim that themeasure is ‘practical’ for use via postal administered. Jacob-Lloyd (2005) report that98% of stroke respondents in their survey completed the Barthel Index (Shahmodified version, Shah et al., 1989).FeasibilityNo data available.Table 9.11: Developmental and evaluation studies relating to the Barthel IndexStudy/CountryPopulation (N)AgeMethod ofadministrationSetting330<strong>Measurement</strong> propertiesBarthel/Modified Barthel Reliability Validity Responsiveness Precision Acceptability FeasibilityGompertzet al., 1993UK<strong>Stroke</strong> (21)Mean age: 69Postal surveyTest re-testGompertz Pet al.,1994UKJacob-Lloyd et al.,2005UKJenkinsonet al., 2000UKKing et al.,2005USASadaria KS,et al.,2001USATrigg andWood, 2000UK<strong>Stroke</strong> (21)Mean age: 69Postal survey<strong>Stroke</strong> (55)Mean age 85%over 60Interview<strong>Stroke</strong> (303)Mean age: 74Interviewsurvey<strong>Stroke</strong> (170)Mean age:53SF-12 selfcompleted<strong>Stroke</strong> (82)Age: mean 70.8Interview<strong>Stroke</strong> (157)Age: notspecifiedTest re-testInternalconsistencyConstructConstructConstructConstructConstructConstruct
e) Frenchay Activities IndexThe Frenchay Activities Index was developed in the UK to assess social functioning,and developed for use in the clinical interview. It was always intended responses tothe form should originate from the patient. It is widely used and reported in theliterature on stroke, although few papers assess its psychometric and measurementcharacteristics. Five papers were judged suitable for inclusion in this review.ReliabilityInter-rater reliability was assessed by Piercy et al., (2000). Moderate to high levels ofagreement were found between the two raters both at the level of individual items.The Index score was very highly correlated between the two administrations(Spearman’s rho=0.93, p
having very low agreement, whilst items relating to work and driving having highlevels of agreement. Kappa values (a statistic indicating level of agreement rangedfrom a low of 0.35 to a high of 1 (perfect agreement). Mean score differences for thetwo administrations of the Index were small, but masked substantial differences insome instances at the individual level (Carter et al., 1997).In a small scale study Wade et al., (1985) assessed the extent that differentinterviewers may have on results from the FAI and found that whilst individual itemscores varied considerably, the overall scores were highly correlated (r=0.80, p
f) Nottingham Extended ADL ScaleThe Nottingham Extended ADL scale was developed in the UK as an instrument forpostal use. Three papers that reported its use and evaluation are included in thisreview.ReliabilityTest re-test reliability of the Nottingham Extended ADL Scale was found to be high ina small scale (n=21) postal evaluation. <strong>Stroke</strong> patients were sent a questionnaire packcontaining the Nottingham Extended ADL Scale six months after having a stroke andthen again 2 weeks later. Results were found to be highly correlated, and the measuregained the best repeatability coefficient of all instruments assessed (including theBarthel Index and the Nottingham Health Profile). Item agreement was also found tobe good (Gompertz et al., 1993).ValidityGompertz et al., (1994) evaluated the validity of the Extended ADL Scale in alongitudinal study. A total of 361 patients were recruited, but at follow-up only 191questionnaires were returned at 6 months and 158 twelve months follow-up. Highcorrelations were found between Barthel Score, NHP Physical Mobility, Energy andPain Scores. However, the authors argue that gender, race and social class, which areindependent of mobility, influence scores. Consequently, they suggest that resultsfrom the measure may be biased by such confounding variables.ResponsivenessGompertz et al., (1994) found that the Extended ADL Scale detected substantialchanges between stroke and follow up at one month (effect size = 1.4), and moderatechange between one month and six months (effect size = 0.6). However, the measuredid not appear to be sensitive to changes between 6 and 12 months, which mayindicate insensitivity on the measure or limited changes in patient health. Jacob-Lloydet al., (2005) suggest that the Nottingham Extended ADL Scale was more sensitive tochange that the Barthel Index in their study of 55 patients from discharge to firstfollow-up appointment. Indeed the measure suggested substantial change over time,whilst the Barthel hardly registered only very modest change, as assessed with theeffect size statistic (ES= 0.63 and 0.17 respectively).PrecisionJacob-Lloyd et al., (2005) suggest that the Nottingham Extended ADL Scale ‘showedfloor effects at discharge with 50/51 participants scoring below the midpoint and 3 onthe minimum score.’ However, these results do not seem to suggest serious flooreffects, which are usually interpreted as a high proportion of scores at the veryextreme range of the scale.AcceptabilityJacob-Lloyd et al., (2005) found that 51 (98%) of stroke respondents completed theNottingham Extended ADL suggesting the instrument is acceptable to patients.FeasibilityNo data available.333
Table 9.13: Developmental and evaluation studies relating to the NottinghamExtended ADL IndexStudy/CountryPopulation (N)AgeMethod ofadministrationSetting<strong>Measurement</strong> propertiesNottingham Extended ADL Scale Reliability Validity Responsiveness Precision Acceptability FeasibilityGompertz etal., 1993UK<strong>Stroke</strong> patients(n=21)Mean age = 69Postal surveyTest retestConstructGompertz etal., 1994UK<strong>Stroke</strong> patients(n=191)Mean age = notreportedPostal surveyConstructJacob-Lloydet al., 2005UK<strong>Stroke</strong> patients(n=55)Age = 85% over 60Interview surveyConstructg) London Handicap ScaleOnly two papers evaluating the London Handicap Scale (LHS) were found whichwere suitable for inclusion in this review.ReliabilityHarwood et al., (1994) undertook a test-retest study on the LHS (n=37). They reportedthat ‘the mean test-retest difference for the group was 0.01, standard deviation 0.09(limits of agreement was 0.19) and the reliability coefficient was 0.91, implyingreasonable agreement between replicate measurements.’ Jenkinson et al., (2000)reported high levels of internal consistency reliability on the measure (alpha=0.98).ValidityHarwood et al., (1994) found predicted high levels of correlation between LHS andthe Barthel Index, the Nottingham Extended ADL Score and the NHP PhysicalMobility subscale. Similarly Jenkinson et al., (2000) found high levels of correlationbetween the LHS and the Frenchay Activities Index and the Barthel Index.ResponsivenessNo data available.PrecisionNo data available.AcceptabilityHarwood et al., (1994) reported that 71% of respondents to the LHS required help tocomplete the questionnaire.334
FeasibilityJenkinson et al., (2000) suggest that simple summation of items on the LHS is morestraightforward to undertake and provides almost identical information to the morecomplex weighted scheme, devised by the developers.Table 9.14: Developmental and evaluation studies relating to the London HandicapScaleStudy/CountryPopulation (N)AgeMethod ofadministrationSetting<strong>Measurement</strong> propertiesNottingham Extended ADLScaleHarwood etal., 1994<strong>Stroke</strong> patientsn=94Mean age 71PostalquestionnaireReliability Validity Responsiveness Precision Acceptability FeasibilityTest re-testConstructJenkinsonet al.,2000UK<strong>Stroke</strong> patients(n=303)Mean age = 74InterviewsurveyInternalconsistencyConstruct335
Other instruments identified from the review.The following table provides an overview of other instruments identified, of either newly developed instruments or single study reporting of measurementproperties and/or evaluation.Table 9.15Instrument/referenceNewcastle<strong>Stroke</strong> Qualityof Lifemeasure(NEWSQOL)Buck et al.,2004HSQuale forYoungHaeorrhagic<strong>Stroke</strong> <strong>Patient</strong>sHamedani etal., 2001Population (N)AgeMethod ofadministrationSetting<strong>Stroke</strong> patients(106)Age:70Interview athome<strong>Stroke</strong> patients(71) Age:44(62% were 40years old or less)Reliability Validity Responsiveness Precision Acceptability Feasibility CommentsInternalconsistencyTest re-testInternalconsistencyTest re-testConstruct Construct 336No other records identified unless stated11 domains, 56 itemsFeelings (6)ADL/self care (8)Cognition (5)Mobility (9)Emotion (4)Sleep (6)Interpersonal relationships (6)Communication (4)ain/sensation (3)vision (2)Fatigue (3)7 domains, 54 items (not all items contribute todomain scores)List 4 ways stroke has changed your life (1)Overall quality of life (1)General outlook (9)Physical functioning (8)Cognitive functioning (8)Relationships (5)Social and leisure activities (6)Emotional well-being (6)Work and financial status (8)Overall summary question (1)What other ways has stroke affected your qualityof life (1)
Instrument/reference<strong>Stroke</strong> andAphasiaQuality of LifeScale (SAQOL-39)Hilari et al.,2003Continuity andDiscontinuityFollowing<strong>Stroke</strong> Scale(CDSS)Secrest andZeller, 2003Burden of<strong>Stroke</strong> Scale(BOSS)Doyle et al.,2004Population (N)AgeMethod ofadministrationSetting<strong>Stroke</strong> patients(93)Age Mean 61.67<strong>Stroke</strong> patients(n=55)Mean age 55<strong>Stroke</strong> patientswith and withoutcommunicationdisorders (n=135and 146respectively)Mean age=63.4Reliability Validity Responsiveness Precision Acceptability Feasibility CommentsInternalconsistencyTest re-testInternalconsistencyTest re-testInternalconsistencyTest re-testConstructNo other records identified unless stated 4 domains, 39 itemsPhysical (17)Psychosocial (11)Communication (7)Energy (4)Construct Continuity (10)Discontinuity (10)ConstructMobility (5)Mobility distress (3)Self-Care (5)Self Care Distress (3)Communication (7)Communication distress (3)Cognition (5)Cognition Distress (3)Swallowing (3)Swallowing distress (3)Social Relations (5)social Relations Distress (3)Energy and Sleep (4)energy and Sleep distress (3)Negative Mood (4)Domain restrictions (1)Positive Mood (4)337
Instrument/reference<strong>Stroke</strong> andAphasiaQuality of Lifeinstrument(SAQOL)Hilari et al.,2003UK39 item <strong>Stroke</strong>and AphasiaQuality of Lifeinstrument(SAQOL-39)Hilari et al.,2003UKReintegrationto NormalLiving IndexDaneski et al.,2003Population (N)AgeMethod ofadministrationSettingn=83Age mean=61.7Interview surveyn=83Age mean=61.7Interview survey76 strokepatientsAge mean =67.1Postal surveyReliability Validity Responsiveness Precision Acceptability Feasibility CommentsInternalconsistencyTest re-test(n=17) InternalconsistencyTest re-test(n=17) InternalconsistencyTest re-testConstructConstructConstructNo other records identified unless stated Areas measured: Language; Thinking;Personality; Energy; Mood; Family Roles; SocialRoles; Work; Overall Score Areas measured: Physical (17); Psychosocial (11);Communication (7); Energy (4) Overall scoreTotal scoreDaily functioning scorePerception of self score339
SUMMARY - GENERIC INSTRUMENTSSix generic instruments (SF-36, SF-12, SF-6D, EuroQol, HUI-3, and NHP) wereidentified in the review, which had been evaluated with people who have experienceda stroke. For only three of these was there sufficient data to make any informeddecisions (SF-36, SF-12, and EuroQol).The most frequently reported instrument evaluated was the SF-36 with evidenceprovided for all measurement selection criteria. The evidence for its use in stroke isgenerally, but not universally, good. For the most part studies reported the instrumentdomains to have good internal consistency reliability or test-retest reliability.However, there were exceptions, with the General Health dimension failing to fulfilthe requirements for this attribute. Test-retest results were found to be acceptable onmost dimensions but very low in one study for the Mental Health dimension. Thevalidity of the SF-36 has been examined in concurrent evaluations with widely usedrehabilitation measures (e.g. the Frenchay Activities Index and Barthel Index) andfound to be good. Empirical evidence supports the internal structure and proposedhealth domains of the SF-36. There is evidence of responsiveness for the SF-36domains but evidence suggests it may not perform as well as established instrumentsused in rehabilitation. Floor and ceiling effects were widely reported, and this maylimit the use of the instrument in evaluative studies, especially in those where patientshave serious ill health. That said, in order to score on the ‘floor’ of the domains on theSF-36 one has to have substantially compromised functioning and/or well-being, andany further ability to assess severity may not truly be necessary. Furthermore, amodified version of the SF-36, the SF-36v2, is now available and may reduce suchproblems in at least the Role Functioning domains, which have been altered toincrease precision.It is perhaps predictable that response rates in those with severe stroke are lower onthe SF-36 than in shorter instruments, such as the EuroQol. Evidence for the accuracyof the measure by proxy (e.g. completed by carers, relatives etc) was not good. Therewas only a limited amount of evidence for the SF-12 in stroke. The two domainmeasurement model proposed by the developers of the instrument was supported inthis patient group. Scores on the two dimensions were generally supported byconcurrent evaluations with related measures. Indeed, the SF-12 can be evaluated inrelation to a ‘gold standard’ (the SF-36) and scores between the two measures werefound to be very highly correlated. However, there were differences, which could bemeaningful, in terms of descriptive statistics and this could suggest inaccuracy inmeasurement and reduce the validity of the instrument in stroke.The EuroQol EQ-5D was found to provide reproducible results, and was acceptable,in terms of completion, to more patients than the SF-36. It gave results comparable toother utility measures as well as the Barthel Index. There was some evidence of flooreffects in patients defined as ‘high functioning’ stroke, and hence the instrument islikely to be less sensitive to changes in this group. There is debate as to how theEuroQol should be weighted (with different results gained from stroke patientvaluations as to opposed societal valuations). However, as long as the same valuationsare used across time and across studies results should be comparable, though whetherthey should be used in economic analyses remains a matter of debate.340
RecommendationsOverall, the SF-36 is the most rigorously evaluated generic instrument although thereis mixed evidence to support its application with patients with severe stroke. There isevidence to support the EuroQol as a brief, reasonably acceptable measure of generalhealth in stroke, although both the amount and quality of evaluative material islimited.SUMMARY – STROKE-SPECIFIC INSTRUMENTSFifteen disease specific questionnaires were included in this review, including anumber of measures designed principally to assess the influence of rehabilitation.Two ‘individualised’ measures of outcome were also found to have been used instroke, but limited information was available for them (PGI and SEIQoL).Consequently seven measures were found to have sufficient information available ontheir psychometric properties to warrant evaluation (<strong>Stroke</strong> Impact Scale (SIS), <strong>Stroke</strong>Specific Quality of Life Scale (SS-QOL), Subjective Index of Physical and social<strong>Outcomes</strong> (SIPSO), Barthel Index, Frenchay Activities Index, Nottingham ExtendedADL scale, London Handicap Scale).Well established rehabilitation measures fared reasonably in terms of theirpsychometric properties. The Barthel Index, Frenchay Activities Index andNottingham Extended ADL Scale were all primarily designed to evaluationrehabilitation outcomes. They are not strictly multi dimensional healthoutcome/quality of life instruments, but all measure important aspects of health status.The Barthel Index is a measure of independence, and was not initially designed forself completion, but versions of the instrument exist that can be completed by patients.Self completion and interview versions of the instrument have been found to havegood reliability and validity, although the sensitivity of the instrument to change is amatter of debate. The Frenchay Activities Index was designed for interviewadministration, and is a measure of social activities and lifestyle following stroke. Theinstrument is generally used in interview settings, and there is evidence that theinterviewer agreement on items can vary, albeit not dramatically. Available evidencesuggests the instrument has good validity, and is amongst the easier measures forstroke patients to complete. The Nottingham Extended ADL Scale has been found tobe reliable, and valid in concurrent validation with other instruments. Furthermore itappears sensitive to changes, and appears acceptable to patients. Rehabilitationmeasures are widely used in the arena of stroke, are well understood by physiciansand consequently provide useful and interpretable data. It is hard not to suggest aplace for such instruments in evaluation of stroke. One potential criticism of suchinstruments is that they are typically designed on the basis of clinical judgement andmay not reflect issues of importance to patients. Consequently, it seems that suchinstruments might reasonably be used in conjunction with other quality of lifemeasures.The London Handicap Scale is perhaps a rather domain specific measure, and theavailable data is too limited to recommend its widespread use. However, on-goingvalidation of the measure is to be encouraged, although, within stroke at least, theinstrument does not appear to be widely used.341
In less than a decade there seems to have been an explosion of research intodeveloping stroke specific measures of quality of life and health status. However, thisresearch has not been well coordinated, and consequently a number of instrumentsexist but few have been subject to on-going evaluation. Researchers seem intent ondeveloping new measures rather than testing existing instruments. Of ten measuresdocumented in this review, only three had sufficient information to be included in theevaluation of instruments (SIS, SS-QOL, and SIPSO). The most data is available forthe SIS, but none of the validation research undertaken on the instrument hasoriginated in the UK. The measure has been found to have reasonably goodpsychometric properties. Internal consistency reliability of all the domains of themeasure has been found to be high. Concurrent validations with other health statusand rehabilitation instruments have supported the validity of the measure, althoughsome floor and ceiling effects. Unsurprisingly, response rates to the questionnairehave been found to be adversely effected by severity of stroke. Nonetheless resultsthus far for the SIS are promising, but it does not seem appropriate to recommendsuch a measure for inclusion in surveys in the UK without there first being some dataavailable on its measurement properties in a UK stroke sample. Similarly the SS-QOLwas developed and validated in the USA. Initial assessment of the instrument hasbeen undertaken in the UK, but there is insufficient information to recommend thisinstrument fully. The SIPSO has been developed in the UK and initial validation ofthis instrument is very promising. Internal reliability consistency and constructvalidity have been shown to be good. Furthermore item completion is good and thereis little evidence of floor and ceiling effects. However, the instrument is primarily ameasure of people’s social integration rather than abilities per se, and as aconsequence its focus may seem rather narrow. Furthermore, further research isneeded to fully evaluate the measure across different levels of stroke severity.RecommendationsAt the present stage of development no single multi-dimensional outcome tool hassufficient information available to recommend it wholeheartedly. Both the SIS and theSIPSO seem highly promising but further data is required for both measures. It seemsthat, at least for the time being, interview and self completion versions of the BarthelIndex, Frenchay Activities Index and Nottingham Extended ADL Scale would appearthe most appropriate condition-specific instruments.342
REFERENCESAhmed S, Mayo NE, Corbiere M, Wood-Dauphinee S, Hanley J, Cohen R. Change inquality of life of people with stroke over time: True change or response shift? Quality-of-Life-Research:-An-International-Journal-of-Quality-of-Life-Aspects-of-Treatment,-Care-and-Rehabilitation 2005;14:611-27.Anderson CS, Laubscher S, Burns R. Validation of the Short Form 36 (SF-36) HealthSurvey questionnaire among stroke patients. <strong>Stroke</strong> 1996; 27:1812-6.Bohannon RW, Maljanian R, Lee N, Ahlquist M. <strong>Measurement</strong> properties of theShort Form (SF)-12 applied to patients with stroke. International Journal ofRehabilitation Research 2004; 27:151-4.Bohannon RW, Maljanian R, Landes M. Test-retest reliability of short form (SF)-12component scores of patients with stroke. International Journal of RehabilitationResearch 2004; 27:149-50.Buck D, Jacoby A, Massey A, Steen N, Sharma A, Ford GA. Development andvalidation of NEWSQOLR, the newcastle stroke-specific quality of life measure.Cerebrovascular-Diseases 2004;17:143-52.Carter J, Mant F, Mant JW, Wade DT, Winner S. Comparison of postal version of theFrenchay Activities Index with interviewer-administered version for use in peoplewith stroke. Clinical Rehabilitation 1997; 11:131-8.Clark MS, Bond M, The Adelaide Activities Profile: a measure of the life-styleactivities of elderly people. Ageing Clin Exp Res 1995; 7: 174-184.Cote R, Hachinski V, Shurvell B, Norris J, Wolfson C. the Canadian NeurologicalScale: A preliminary study in acute stroke. <strong>Stroke</strong> 1986; 17: 731-737.Daneski K, Coshall C, Tilling K, Wolfe CDA. Reliability and validity of a postalversion of the Reintegration to Normal Living Index, modified for use with strokepatients. Clinical Rehabilitation 2003;17:835-9.Dorman PJ, Waddell F, Slattery J, Dennis M, Sandercock P. Are proxy assessments ofhealth status after stroke with the EuroQol questionnaire feasible, accurate, andunbiased? <strong>Stroke</strong> 1997; 28:1883-7.Dorman PJ, Waddell F, Slattery J, Dennis M, Sandercock P. Is the EuroQol a validmeasure of health-related quality of life after stroke? <strong>Stroke</strong> 1997; 28:1876-82.Dorman PJ, Slattery J, Farrell B, Dennis M, Sandercock P. Qualitative comparison ofthe reliability of health status assessments with the EuroQol and SF-36 questionnairesafter stroke. <strong>Stroke</strong> 1998; 29:63-8.Dorman PJ, Dennis M, Sandercock P. How do scores on the EuroQol relate to scoreson the SF-36 after stroke? <strong>Stroke</strong> 1999; 30:2146-51.343
Doyle PJ, McNeil MR, Mikolic JM, Prieto L, Hula WD, Lustig AP et al. The Burdenof <strong>Stroke</strong> Scale (BOSS) provides valid and reliable score estimates of functioning andwell-being in stroke survivors with and without communication disorders. Journal-of-Clinical-Epidemiology 2004;57:997-1007.Duncan PW, Wallace D, Lai SM, Johnson D, Embretson S, Laster LJ. The <strong>Stroke</strong>Impact Scale version 2.0: evaluation of reliability, validity, and sensitivity to change.<strong>Stroke</strong> 1999; 30:2131-40.Duncan PW, Lai SM, Keighley J. Defining post-stroke recovery: Implications fordesign and interpretation of drug trials. Neuropharmacology 2000; 39:835-41.Duncan PW, Reker DM, Horner RD, Samsa GP, Hoenig H, LaClair BJ et al.,Performance of a mail-administered version of a stroke-specific outcome measure, the<strong>Stroke</strong> Impact Scale. Clinical Rehabilitation 2002; 16:493-505.Duncan PW, Bode RK, Min-Lai S, Perera S. Rasch analysis of a new stroke-specificoutcome scale: the <strong>Stroke</strong> Impact Scale. Archives of Physical Medicine andRehabilitation 2003; 84:950-63.Duncan P, Reker D, Kwon S, Lai S, Studenski S, Perera S et al.,. Measuring strokeimpact with the <strong>Stroke</strong> Impact Scale: telephone versus mail administration in veteranswith <strong>Stroke</strong>. Medical-Care 2005; 43: 507-15Edwards B, O’Connell B. Internal consistency and validity of the <strong>Stroke</strong> Impact Scale2.0/SIS 2.0 and SIS-16 in an Australian sample. Quality of Life Research 2003;12:1127-35.Goldstein LB, Lyden P, Mathias SD, Colman SS, Pasta DJ, Albers G et al. Telephoneassessment of functioning and wellbeing following stroke: is it feasible? Journal of<strong>Stroke</strong> and Cerebrovascular Diseases 2002;11:80-7.Gompertz P, Pound P, Ebrahim S. The reliability of stroke outcome measures.Clinical Rehabilitation 1993; 7:290-6.Gompertz P, Pound P, Ebrahim S. A postal version of the Barthel Index. ClinicalRehabilitation 1994; 8:233-9.Gompertz P, Pound P, Ebrahim S. Validity of the Extended Activities of Daily Livingscale. Clinical Rehabilitation 1994; 8:275-80.Granger CV, Albrecht GL, Hamilton BB. (1979) Outcome of comprehensive medicalrehabilitation: <strong>Measurement</strong> by PULSES Profile and the Barthel Index. Archives ofPhysical Medicine and Rehabilitation 1979; 60: 145-54.Grootendorst P, Feeny DH, Furlong WJ. Health Utilities Index Mark 3: evidence ofconstruct validity for stroke and arthritis in a population health survey. Medical Care2000; 38:290-9.344
Hackett ML, Anderson CS, House AO. Interventions for treating depression afterstroke. The Cochrane Library/Cochrane Database Systematic Review2004;CD003437.Hagen S, Bugge C, Alexander H. Psychometric properties of the SF-36 in the earlypost-stroke phase. Journal of Advanced Nursing 2003; 44:461-8.Hamedani AG, Wells CK, Brass LM, Kernan WN, Viscoli CM, Maraire N et al.,.,. Aquality of life instrument for young hemorrhagic stroke patients. <strong>Stroke</strong> 2001; 32:687-95.Harwood RH, Gompertz P, Ebrahim S. Handicap one year after a stroke: validity of anew scale. Journal of Neurology, Neurosurgery and Psychiatry 1994; 57:825-9.Harwood RH, Ebrahim S. The validity, reliability and responsiveness of theNottingham Extended Activities of Daily Living scale in patients undergoing total hipreplacement. Disability and Rehabilitation 2002; 24:371-7.Hilari K, .Byng S. Measuring quality of life in people with aphasia: the <strong>Stroke</strong>-Specific Quality of Life Scale. International Journal of Language andCommunication Disorders 2001; 36:86-91.Hilari K, Byng S, Lamping DL, Smith SC. <strong>Stroke</strong> and Aphasia Quality of Life Scale-39/SAQOL-39: evaluation of acceptability, reliability, and validity. <strong>Stroke</strong> 2003;34:1944-50.Hobart JC, Williams LS, Moran K, Thompson AJ. Quality of life measurement afterstroke: uses and abuses of the SF-36. <strong>Stroke</strong> 2002; 33:1348-56.Holbrook M, Skilbeck CE. An activities index for use with stroke patients. Age andAgeing 1983; 12: 166-70.Jacob-Lloyd HA, Dunn OM, Brain ND, Lamb SE. Effective measurement of thefunctional progress of stroke clients. British-Journal-of-Occupational-Therapy2005;68:253-9.Jenkinson C. The SF-36 physical and mental health summary measures: an exampleof how to interpret scores. Journal of Health Services Research and Policy 1998; 3:92-96.Jenkinson CP, Mant JW, Carter J, Wade DT, Winner S. The London Handicap Scale:a re-evaluation of its validity using standard scoring and simple summation. Journalof Neurology, Neurosurgery and Psychiatry 2000; 68:365-7.Kersten P, George S, Low J, Ashburn A, McLellan L. The Subjective Index ofPhysical and Social Outcome: its usefulness in a younger stroke population.International-Journal-of-Rehabilitation-Research 2004; 27:59-63.King JTJ, Kassam AB, Yonas H, Horowitz MB, Roberts MS. Mental health, anxiety,and depression in patients with cerebral aneurysms. J Neurosurg. 2005;103:636-41.345
Kwon S, Hartzema AG, Duncan PW, Lai SM. Disability measures in stroke:relationship among the Barthel Index, the Functional Independence Measure, and theModified Rankin Scale. <strong>Stroke</strong> 2004; 35:918-23.LeVasseur SA, Green S, Talman P. The SEIQoL-DW is a valid method for measuringindividual quality of life in stroke survivors attending a secondary prevention clinic.Quality-of-Life-Research 2005;14:779-88.Lai, SM, Perera, S, Duncan, PW, Bode, R. Physical and social functioning afterstroke: Comparison of the stroke impact scale and SF-36. <strong>Stroke</strong> 2003; 34:448-493.Lai SL, Guo XF, Liang WX. Preliminary study on outcome assessment system oftreatment of stroke. Zhongguo Zhong.Xi.Yi Jie.He Za Zhi 2004; 24:197-201.Lim LLY, .Fisher JD. Use of the 12-item Short-Form (SF-12) Health Survey in anAustralian heart and stroke population. Quality of Life Research 1999; 8:1-8.McPherson K, Myers J, Taylor WJ, McNaughton HK, Weatherall M. Self-valuationand societal valuations of health state differ with disease severity in chronic anddisabling conditions Med.Care 2004;42:1143-51.Nouri FM, Lincoln NB. An extended activities of daily living index for strokepatients. Clinical Rehabilitation 1987; 1: 301-305.Nichols-Larsen DS, Clark PC, Zeringue A, Greenspan A, Blanton S. Factorsinfluencing stroke survivors quality of life during subacute recovery <strong>Stroke</strong> 2005; 36:1480-1484.Nunnally, J. Psychometric theory (2nd ed.). New York: McGraw-Hill Book Co.O'Mahony PG, Rodgers H, Thomson RG, Dobson R, James OFW. Is the SF-36suitable for assessing health status of older stroke patients? Age and Ageing 1998;27:19-22.Patrick D, Peach H. Disablement in the Community. Oxford: Oxford University Press,1989.Patel MD, Tilling K, Lawrence E, Rudd AG, Wolfe CD, McKevitt C. Relationshipsbetween long-term stroke disability, handicap and health-related quality of life.Age Ageing. 2006 May;35(3):273-9.Pickard AS. 'Replicability of SF-36 summary scores by the SF-12 in stroke patients' -erratum. <strong>Stroke</strong> 1999; 30:1737.Pickard AS, Johnson JA, Penn A, Lau F, Noseworthy T. Replicability of SF-36summary scores by the SF-12 in stroke patients. <strong>Stroke</strong> 1999; 30:1213-7.Pickard AS, Johnson JA, Feeny DH. Responsiveness of generic health-related qualityof life measures in stroke. Quality-of-Life-Research 2005;14:207-19.346
Piercy M, Carter J, Mant JW, Wade DT. Inter-rater reliability of the FrenchayActivities Index in patients with stroke and their carers. Clinical Rehabilitation 2000;14:433-40.Poissant, Lise. The development of a Preference-Based Health Index for stroke1002. Dissertation-Abstracts-International:-Section-B:-The-Sciences-and-Engineering64(11-B), 5836. 2004.Polsky D, Willke RJ, Scott K, Schulman KA, Glick HA. A comparison of scoringweights for the EuroQol derived from patients and the general public. HealthEconomics 2001; 10:27-37.Rubenach S, Anderson CS, Laubscher S. The Short Form-12 by telephone as ameasure of health-related quality of life after stroke. Age and Ageing 2000;29:553-4.Sadaria KS, Bohannon RW, Lee N, Maljanian R. Ratings of physical functionobtained by interview are legitimate for patients hospitalized after stroke. Journal of<strong>Stroke</strong> and Cerebrovascular Diseases 2001; 10:79-84.Secrest JS,.Zeller R. Measuring continuity and discontinuity following stroke. Journalof Nursing Scholarship 2003;35:243-7Segal ME, .Schall RR. Determining functional/health status and its relation todisability in stroke survivors. <strong>Stroke</strong> 1994; 25:2391-7.Shah S, Vanclay F, Cooper B (1989) Improving the sensitivity of the Barthel Indexfor stroke rehabilitation. Journal of Clinical Epidemiology 1989; 42 (8): 703-709Trigg R, .Wood VA. The Subjective Index of Physical and Social Outcome/SIPSO: anew measure for use with stroke patients. Clinical Rehabilitation 2000; 14:288-99.Trigg R, Wood V, Hewer R. Social integration after stroke: the first stages in thedevelopment of the Subjective Index of Physical and Social Outcome (SIPSO).Clinical Rehabilitation 1999; 13: 341-353.Trigg R, .Wood VA. The validation of the Subjective Index of Physical and SocialOutcome/SIPSO. Clinical Rehabilitation 2003; 17:283-9.Wade DT, Collin C. The Barthel ADL Index: a standard measure of disability?International Disability Studies 1988; 10: 64-7.Wade DT, Legh SJ, Langton HR. Social activities after stroke: measurement andnatural history using the Frenchay Activities Index. International RehabilitationMedicine 1985; 7:176-81.347
WHOQOL Group. The World Health Organisation Quality of Life Assessment(WHOQOL). Development and general psychometric properties. Soc Sci Med 1998;46: 1569-85Williams LS, Weinberger M, Harris LE, Clark DO, Biller J. Development of a strokespecificquality of life scale. <strong>Stroke</strong> 1999a; 30:1362-9.Williams LS, Weinberger M, Harris LE, Biller J. Measuring quality of life in a waythat is meaningful to stroke patients. Neurology 1999b; 53:1839-43.348