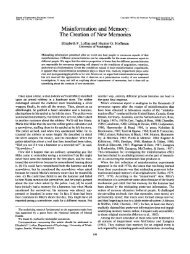
Module 9 Nonparametric tests.pdf - 1
Module 9 Nonparametric tests.pdf - 1
Module 9 Nonparametric tests.pdf - 1

You also want an ePaper? Increase the reach of your titles
YUMPU automatically turns print PDFs into web optimized ePapers that Google loves.
<strong>Module</strong> 9: <strong>Nonparametric</strong> TestsThe Applied Research Center
<strong>Module</strong> 9 Overview} <strong>Nonparametric</strong> Tests} Parametric vs. <strong>Nonparametric</strong> Tests} Restrictions of <strong>Nonparametric</strong> Tests} One-Sample Chi-Square Test} Chi-Square Test of Independence} Other <strong>Nonparametric</strong> Tests
What Are <strong>Nonparametric</strong> Tests?} <strong>Nonparametric</strong> <strong>tests</strong> require few, if any assumptionsabout the shapes of the underlying populationdistributions} For this reason, they are often used in place of parametric<strong>tests</strong> if or when one feels that the assumptions of theparametric test have been too grossly violated (e.g., if thedistributions are too severely skewed).
Parametric or <strong>Nonparametric</strong> <strong>tests</strong>?} If all assumptions are met, use Parametric techniques} Use <strong>Nonparametric</strong> techniques} When the dependent variable is either nominal or ordinal} If the distribution of the dependent variable is skewed} When the assumptions are not met, specifically:} Normality} Homogeneity of variance
Restrictions} <strong>Nonparametric</strong> <strong>tests</strong> do have at least two majordisadvantages in comparison to parametric <strong>tests</strong>:} First, nonparametric <strong>tests</strong> are less powerful. Why?Because parametric <strong>tests</strong> use more of the informationavailable in a set of numbers.} Parametric <strong>tests</strong> make use of information consistent withinterval or ratio scale (or continuous) measurement,whereas nonparametric <strong>tests</strong> typically make use ofnominal or ordinal (or categorical) information only.5
Restrictions (contd)} Second, parametric <strong>tests</strong> are much more flexible, andallow you to test a greater range of hypotheses. Forexample, ANOVA designs allow you to test forinteractions between variables in a way that is notpossible with nonparametric alternatives.} There are nonparametric techniques to test for certainkinds of interactions under certain circumstances, butthese are much more limited than the correspondingparametric techniques.6
Chi-Square Test} Used to test variables that have nominal data} Examples of nominal data} Gender} Political affiliation} Course delivery method} Three main types:} Goodness-of-fit (or one-sample) test} Test of independence (or association)} Independent-samples test
Chi-Square Goodness-of-Fit Test¨ Evaluates whether the proportions of individuals who fallinto categories are equal to hypothesized values¨ The variable can have two or more categories¨ The categories can have quantitative (one categoryreflects a higher value than another; e.g., Likert scaleresponses of Agree and Disagree) or qualitative grouping(e.g., course delivery method)¨ Note: The chi-square test does not recognize anyquantitative distinction among categories; it simplyassesses whether the proportions associated with thecategories are significantly different from thehypothesized values
Chi-Square Goodness-of-Fit Test(contd)} When conducting a chi-square test in SPSS, you must firstspecify the values for the hypothesized proportions} The proportions can be} Equal (proportion = 1/ number of categories)} Not equal (determined based on previous research)
Chi-Square Goodness-of-Fit Test(contd)¨ Next, you must formulate a null hypothesis (the expectedfrequencies = hypothesized proportions)¨ Then, specify the expected frequencies associated withthe categories.¤ The expected frequency =hypothesized proportion x total sample size.¤ If hypothesized proportions are equal, the expectedfrequencies will be equal¤ If hypothesized proportions are unequal, the expectedfrequencies will be unequal
Contingency Tables} Helps arrange the data in a study for the purpose ofshowing how each group split itself up on the variable} Make it easier to understand the null hypothesis and whythe data led to the rejection or not of the null.
Goodness-of-Fit Example¨ A professor was interested in whether students prefer totake classes face to face or online. A poll was taken with100 students to determine their preference for learning.¨ Step 1: State the null and alternate hypotheses¤ H 0 : The number of students who prefer to take classes face toface is equal to the number of students who prefer to takeclasses online¤ H a : The number of students who prefer to take classes face toface is not equal to the number of students who prefer totake classes online
Goodness-of-Fit Example (contd)} Step 2: Create the contingency tableObservedFrequenciesHypothesizedProportionsExpectedFrequenciesFace to Face 39 .50 50Online 61 .50 50} Step 3: Input the data into SPSS} Create a variable labeled DeliveryMethod} Assign values: 1 = Face to Face, 2 = Online} Enter the data (in one column): 39, 1s and 61, 2s
Goodness-of-Fit Example (contd)} Step 4: Run the Analysis} Analyze à <strong>Nonparametric</strong> à Legacy Dialogs àChi-square} Move the variable (DeliveryMethod) to the Test variable listbox} Under Expected Values, select All categories equal} Click Ok
Goodness-of-Fit Example (contd)
Goodness-of-Fit Example (contd)} Step 4: Make a decision regarding the null} X 2 = 4.84} df = 1 (Number of categories – 1)} p = .028} What is our decision regarding the null?
Goodness-of-Fit Example (contd)} Using the level of significance = .05, do we reject or fail toreject the null?} If p < .05, we reject the null} if p > .05, we fail to reject the null} According to SPSS, p = .028} .028 < .05, therefore, we reject the null!
Goodness-of-Fit Example (contd)} Step 5: Write up your results.} The null hypothesis stated that the number of students whoprefer to take classes face to face is equal to the number ofstudents who prefer to take classes online. A chi-squaregoodness-of-fit test revealed that significantly more studentsprefer to take courses online (61%) compared to face to face(39%, X 2 = 4.84, df = 1, p = .028). Consequently, the nullhypothesis was rejected.
Chi-Square Test of Independence} A test to see whether a relationship (or association)exists between two nominal variables} Similar to a bivariate correlation
Test of Independence Example} A professor is interested in whether there is arelationship between gender and preference for learningstatistics face to face or online. A poll was taken with 100students (50 males and 50 females) to determine theirpreference for learning.} Step 1: State the null and alternate hypotheses} H 0 : There is no relationship between gender and preferencefor learning statistics face to face or online} H a : There is a relationship between gender and preference forlearning statistics face to face or online
Test of Independence Example (contd)} Step 2: Create the contingency table} Step 3: Input the data into SPSS} Create 2 variables: Gender and DeliveryMethod} Assign values} Enter the data:Face to face} For Gender: 50, 1s and 50, 2sOnlineMales 20 30Females 30 20} For DeliveryMethod: 20 males and 30 females (face to face), 30 malesand 20 females (online)
Test of Independence Example (contd)} Step 4: Run the Analysis} Analyze à Descriptives à Crosstabs} Move Gender to the Row box and DeliveryMethod to theColumn box} Select Statistics then select Chi square and Phi andCramers V boxes, Click Continue} Select Cells then under Counts select Observed andExpected, Click Continue} Select Display clustered bar charts at the bottom left.} Click Ok
Test of Independence Example (contd)
Test of Independence Example (contd)
Test of Independence Example (contd)
Test of Independence Example (contd)} Step 4: Make a decision regarding the null} X 2 = 4.00} df = 1} (Number of categories in 1 st variable – 1)(Number of categories in 2 ndvariable – 1)} p = .046} What is our decision regarding the null?
Test of Independence Example (contd)} Using the level of significance = .05, do we reject or fail toreject the null?} If p < .05, we reject the null} if p > .05, we fail to reject the null} According to SPSS, p = .046} .046 < .05, therefore, we reject the null!
Test of Independence Example (contd)} Step 5: Write up your results.} The null hypothesis stated that there is no relationshipbetween gender and preference for learning statistics face toface or online. A chi-square test of independence revealed asignificant relationship between gender and preference forlearning statistics, X 2 (1, N = 100) = 4.00; p = .046.Consequently, the null hypothesis was rejected.
<strong>Nonparametric</strong> Tests for Nominal Data} The sign test} The binomial test} Fischers Exact Test} The chi-square test} McNemars test} Cochrans test
<strong>Nonparametric</strong> Tests for Ordinal Data} The Mann-Whitney U test} Analogous to independent samples t test} Wilcoxon signed-ranks test} Analogous to paired samples t test} The Kruskal-Walis one-way analysis of ranks} Analogous to a one-way ANOVA} The Friedmans ANOVA} Analogous to RM ANOVA} Spearmans rho} Analogous to Pearson correlation
<strong>Module</strong> 9 Summary} <strong>Nonparametric</strong> Tests} Parametric vs. <strong>Nonparametric</strong> Tests} Restrictions of <strong>Nonparametric</strong> Tests} One-Sample Chi-Square Test} Chi-Square Test of Independence} Other <strong>Nonparametric</strong> Tests
Review Activity} Please complete the review activities at the end of themodule.} You can complete the review activities and module asmany times as you like.} Upon completion of the review activities you will have anopportunity to print your Certificate of Completion,along with instructions for submitting your certificate tothe ARC.
Statistics PD Course <strong>Module</strong>s} <strong>Module</strong> 1: Introduction to Statistics} <strong>Module</strong> 2: Introduction to SPSS} <strong>Module</strong> 3: Descriptive Statistics} <strong>Module</strong> 4: Inferential Statistics} <strong>Module</strong> 5: Correlation} <strong>Module</strong> 6: t-Tests} <strong>Module</strong> 7: ANOVAs} <strong>Module</strong> 8: Linear Regression} <strong>Module</strong> 9: <strong>Nonparametric</strong> Procedures