Periodic Analysis of Exports of Drugs, Pharmaceuticals & Fine ...
Periodic Analysis of Exports of Drugs, Pharmaceuticals & Fine ...
Periodic Analysis of Exports of Drugs, Pharmaceuticals & Fine ...

Create successful ePaper yourself
Turn your PDF publications into a flip-book with our unique Google optimized e-Paper software.
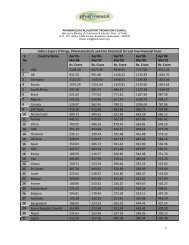
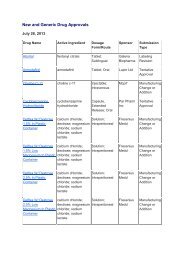
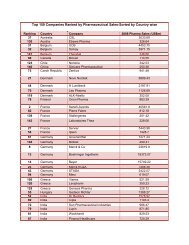
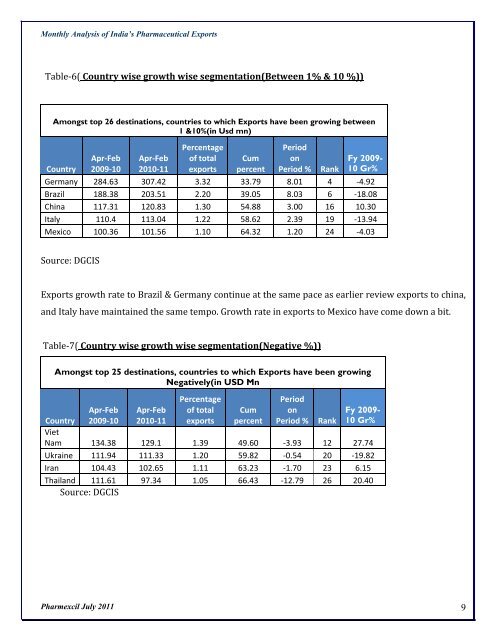
Monthly <strong>Analysis</strong> <strong>of</strong> India’s Pharmaceutical <strong>Exports</strong>Table‐6( Country wise growth wise segmentation(Between 1% & 10 %))Amongst top 26 destinations, countries to which <strong>Exports</strong> have been growing between1 &10%(in Usd mn)CountryApr‐Feb2009‐10Apr‐Feb2010‐11Percentage<strong>of</strong> totalexportsCumpercentPeriodonPeriod %RankFy 2009-10 Gr%Germany 284.63 307.42 3.32 33.79 8.01 4 ‐4.92Brazil 188.38 203.51 2.20 39.05 8.03 6 ‐18.08China 117.31 120.83 1.30 54.88 3.00 16 10.30Italy 110.4 113.04 1.22 58.62 2.39 19 ‐13.94Mexico 100.36 101.56 1.10 64.32 1.20 24 ‐4.03Source: DGCIS<strong>Exports</strong> growth rate to Brazil & Germany continue at the same pace as earlier review exports to china,and Italy have maintained the same tempo. Growth rate in exports to Mexico have come down a bit.Table‐7( Country wise growth wise segmentation(Negative %))Amongst top 25 destinations, countries to which <strong>Exports</strong> have been growingNegatively(in USD MnApr‐Feb2009‐10Apr‐Feb2010‐11Percentage<strong>of</strong> totalexportsCumpercentPeriodonPeriod %Fy 2009-10 Gr%CountryRankVietNam 134.38 129.1 1.39 49.60 ‐3.93 12 27.74Ukraine 111.94 111.33 1.20 59.82 ‐0.54 20 ‐19.82Iran 104.43 102.65 1.11 63.23 ‐1.70 23 6.15Thailand 111.61 97.34 1.05 66.43 ‐12.79 26 20.40Source: DGCISPharmexcil July 2011 9