MER December 2005 A3 - Bank of Sierra Leone
MER December 2005 A3 - Bank of Sierra Leone
MER December 2005 A3 - Bank of Sierra Leone
- No tags were found...

Create successful ePaper yourself
Turn your PDF publications into a flip-book with our unique Google optimized e-Paper software.
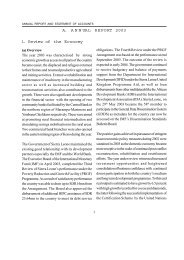
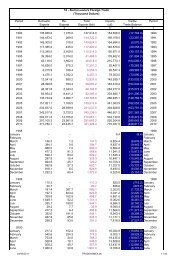
Page 4banks’ Time Deposits (Le13.88bn). Over the year, RM, M2 and M1increased by 19.60, 20.56 and 13.35 percent, respectively. Net Claimson Government by the banking system contracted by Le39.14bn (19.25%)to Le164.18bn, on account <strong>of</strong> the decline in Net Claims on Governmentby both the <strong>Bank</strong> <strong>of</strong> <strong>Sierra</strong> <strong>Leone</strong> (Le14.65bn) and commercial banks(Le24.49bn). The reduction in Net Claims by the <strong>Bank</strong> <strong>of</strong> <strong>Sierra</strong> <strong>Leone</strong>was due to the reduction in its holdings <strong>of</strong> the 3 months treasury bills byLe19.68bn coupled with the increase in government deposits at the<strong>Bank</strong> (Le14.36bn), which more than <strong>of</strong>fset the increase in the <strong>Bank</strong>’sholdings . <strong>of</strong> the 6 months (Le13.85bn) and the 12 months (Le5.54bn)treasury bills. Net Claims on Government by the commercial bankscontracted as a result <strong>of</strong> the reduction in their holdings <strong>of</strong> the 6 and 12months treasury bills in the magnitude <strong>of</strong> Le15.41bn and Le6.79bnrespectively, together with the increase in government deposits (Le8.03bn)at the banks, which was more than the increase in their holdings <strong>of</strong> the3 months treasury bills (Le4.94bn). Credit to the private sector by thecommercial banks increased by Le6.72bn (1.10%) to Le617.79bn inthe review month. Commercial banks’ average interest rates remainedrelatively stable during the period. The rates on the Savings, 3 months,6 months, 9 months and 12-months Time Deposits and 12-monthsTreasury Bonds stood at 6.32 percent, 8.87 percent, 9.45 percent, 9.25percent, 10.84 percent and 12.00 percent, respectively. The averageannual yield on the 3 months, 6 months and 12 months Treasury Billsincreased by 75, 173, and 11 basis points to 15.47 percent, 15.43 percentand 14.84 percent respectively, while the lending rate on overdraftremained stable at a range <strong>of</strong> 22-29 percent.Exchange Rates DevelopmentsThe monthly average exchange rate <strong>of</strong> the <strong>Leone</strong> to the United StatesDollar showed mixed trends during the month <strong>of</strong> February 2010. Theaverage exchange rate appreciated in most <strong>of</strong> the exchange channelsafter consistently deteriorating for the most part <strong>of</strong> 2009. On the buyingfront, the rate appreciated in all the exchange channels except for theparallel market where the rate at Le4,012.61/US$1 depreciated slightly by 0.01 percent. Therate for the bureaux at Le3,810.11/US$1appreciated the highest (3.72%), followed by thecommercial banks’ rate at Le3,818.80/US$1 (1.61%).The Official rate at Le3,854.90/US$1 appreciated the least (0.67%).On the selling front, the monthly average rates for the commercial banksat Le3,976.18/US$1 depreciated by 0.05 percent while that <strong>of</strong> parallelmarket at Le4,048.11/US$1 depreciated by 0.003 percent. The rate forthe auction market at Le3,652.54/US$1 and foreign exchange bureauxat Le3,891.06/US$1 however, appreciated by 4.24 percent and 4.00percent, respectively. The Official rate at Le3,932.78/US$1 againappreciated the least (0.54%). The premium between the Official andTable 9.Notes: n.a - Not Available* * - NilN/A - Not ApplicableR - Revised+ - ProvisionalMonthly Economic ReviewLe/US$4,100.003,900.003,700.003,500.003,300.003,100.002,900.00Feb-09Mar-09Apr-09May-09Chart 3. Exchange Rates DevelopmentJun-09Jul-09OfficialComm. <strong>Bank</strong>sBureauxParallel MktJan-09 Feb-09 Mar-09 Apr-09 May-09 Jun-09 Jul-09 Aug-09 Sep-09 Oct-09 Nov-09 Dec-09Total Imports o/w 44329.40 36544.85 35400.58 54602.32 40473.40 59603.67 41648.60 35519.97 35073.72 48213.07 53662.58 39830.89Rice 000$ 6211.95 3487.36 - 16976.28 3080.96 6573.25 3810.22 - 2689.30 4044.14 9720.33 3472.82Petroleum Products 000$ 10264.40 10038.20 8166.90 12708.40 11994.50 13302.30 7424.50 13657.30 7951.30 13369.00 5715.30 11867.30o/w Fuel 000$ 8690.55 8360.85 6751.49 10479.96 8300.23 10575.04 4676.87 11535.15 4068.56 13263.20 6743.81 11846.89Others 000$ 27853.05 23019.29 27233.68 24917.64 25397.94 39728.12 30413.88 21862.67 24433.12 30799.93 38226.95 24490.77Total Exports o/w 000$ 23955.80 16515.80 10771.80 15229.70 17301.90 23825.40 19152.80 13662.12 18956.19 24848.74 28698.28 17738.71Diamonds 000$ 3616.20 3611.60 4286.00 7625.80 6838.40 9907.40 9574.90 6154.68 6162.01 9118.07 6120.81 5358.09Bauxite 000$ 2311.90 1195.00 - 1291.80 1082.10 2201.40 2291.20 - 2390.44 1257.10 1312.99 2344.05Rutile 000$ 5795.30 5488.90 466.90 - 2894.80 5242.70 793.10 4757.10 526.70 700.00 4019.76 5235.09Gold 000$ 148.70 349.90 501.60 148.20 1137.90 80.00 564.10 204.55 304.70 250.35 317.30 756.75Illmenite 000$ - - - - - - 916.90 - - - - -Cocoa 000$ 6351.00 3875.50 1937.10 952.20 1399.90 455.80 443.30 311.71 3312.05 1200.92 140.61 164.49C<strong>of</strong>fee 000$ 133.10 847.50 1418.70 1381.00 612.00 3743.30 3269.80 839.70 416.36 462.10 - -Others 000$ 5529.50 854.00 1494.50 2210.40 3144.30 1561.00 918.30 1047.79 4601.77 908.19 9759.54 2744.72Re-exports 000$ 70.10 293.40 667.00 1620.30 192.50 633.80 381.20 346.59 1242.16 10952.01 7027.27 135.52Trade Balance 000$ -20373.60 -20029.05 -24628.78 -39372.62 -23171.50 -35778.27 -22495.80 -21857.85 -16117.53 -23364.33 -24964.30 -22092.18Vol. <strong>of</strong> ImportsRice M tons 16000.00 9000.00 - 43950.00 8000.00 17000.00 9914.42 - 7000.00 10700.00 25250.00 9000.00Petroleum Products (Fuel) M tons 19007.05 17093.97 16120.55 15532.43 13049.57 17396.07 6587.26 17094.94 5700.00 21276.11 6992.88 17775.26Vol. <strong>of</strong> ExportsDiamond 000carat 17.16 32.35 25.59 43.73 31.79 48.46 39.31 29.21 35.77 43.87 27.97 25.25C<strong>of</strong>fee M tons 80.50 487.00 938.73 690.50 306.00 1701.50 1595.00 990.00 175.72 172.80 1006.80 -Cocoa M tons 2749.37 1603.02 867.52 317.40 1583.50 412.50 170.50 - 2700.00 1835.35 3472.98 1000.00External Reserves $Mn 210.67 196.82 201.38 196.40 196.85 205.24 213.02 228.49 324.60 330.67 323.30 336.27Sources:Customs and Excise D epartm ent,Gold and Diamond D ep artm ent,B ank <strong>of</strong> <strong>Sierra</strong> <strong>Leone</strong>External TradeAug-09Periodparallel market buying rates widened from Le131.59/US$1 in January2010 to Le157.71/US$1 in February 2010. The monthly average exchangerate <strong>of</strong> the <strong>Leone</strong> to the US Dollar depreciated for the most part <strong>of</strong> 2009,especially during the second half <strong>of</strong> the year. This has been attributed toexcess demand factors coupled with low exports earnings and reducedmigrant remittance inflows. Agents taking speculative stance in theparallel market further exacerbated the situation. The rate has howevershowed some stability during the last three months especially duringthe month <strong>of</strong> February 2010, where it appreciated in most <strong>of</strong> the exchangechannels.International ReservesThe gross external reserves position <strong>of</strong> the <strong>Bank</strong> <strong>of</strong> <strong>Sierra</strong> <strong>Leone</strong> improvedslightly by US$1.04mn (0.30%) to US$345.50mn as at end-February2010, from US$344.46mn as at end-January 2010. This reflectedcumulative inflows <strong>of</strong> US$16.90mn, which outweighed total outflows <strong>of</strong>US$10.75mn. Major inflows during the month comprised US$15.49mn,being United Kingdom/Department for International Development (UK/DfID) disbursement in respect <strong>of</strong> Poverty Reduction Budget Support;US$4.30mn as interest earned on <strong>Bank</strong> <strong>of</strong> <strong>Sierra</strong> <strong>Leone</strong>’s foreigninvestments and other Government receipts and US$4.0mn in respect<strong>of</strong> fishing royalties, diamond license fees and exporters’ income tax.Major outflows were in respect <strong>of</strong> US$6.29mn, being the total amountutilized under the weekly foreign exchange auction for the month;US$0.94mn, being payments on Government travel and otherGovernment expenditure; US$0.72mn, as embassies/missionspayments; US$0.26mn, being fuel cost for electricity support; and totaldebt service payment <strong>of</strong> US$2.48m.123456789012345678901234567890121234567890123123456789012345678901234567890121234567890123Research DepartmentPublished April 2010123456789012345678901234567890121234567890123123456789012345678901234567890121234567890123123456789012345678901234567890121234567890123123456789012345678901234567890121234567890123123456789012345678901234567890121234567890123123456789012345678901234567890121234567890123123456789012345678901234567890121234567890123123456789012345678901234567890121234567890123123456789012345678901234567890121234567890123Sep-09Oct-0940118Dec-09Jan-10Feb-10Monthly Economic ReviewFebruary 2010Highlights<strong>Sierra</strong> <strong>Leone</strong>’s macroeconomic performance continued to showpositive trends, with the monthly fiscal balance for February 2010,registering an increase <strong>of</strong> Le13.72bn from a surplus <strong>of</strong> Le10.08bn inJanuary 2010. This is due mainly to significant improvement in bothdomestic revenue collections and external budget support inflowsduring the review month. The monthly average exchange rate <strong>of</strong> the<strong>Leone</strong> to the United States Dollar appreciated in almost all the foreignexchange channels during the reporting period, after consistentlydeteriorating for the most part <strong>of</strong> 2009 and January 2010. The month’saverage <strong>of</strong>ficial exchange rate <strong>of</strong> the <strong>Leone</strong> to the United StatesDollar marginally appreciated by 0.67 percent to Le3,854.90/US$1,up from Le3,880.71/US$1 in January 2010. Movements in monetaryaggregates were mixed during the month, with Narrow Money (M1)and Reserve Money (RM) expanding by 0.32 percent and 1.35percent, respectively. Broad Money (M2) contracted by 0.46 percent.The national year-on-year inflation rate however increased from 14.83percent in January 2010 to 16.11 percent in the reporting month,largely reflecting the continued first round effects <strong>of</strong> the recentlyintroduced Goods and Services Tax (GST) on prices, coupled withthe increase in domestic price <strong>of</strong> fuel per gallon in February 2010.Gross external reserves <strong>of</strong> the Central <strong>Bank</strong> slightly increased toUS$345.50mn as at end February 2010 from US$344.46mn as atend January 2010. Also, during the reporting month, the countrybenefited from various supports to augment its socio-economicperformance. The Government <strong>of</strong> <strong>Sierra</strong> <strong>Leone</strong>, on 9 th February 2010,signed a US$400million Memorandum <strong>of</strong> Understanding (MOU) witha Swiss-based energy corporation, the Addax & Oryx Groups, AddaxBio-energy, intended for the development <strong>of</strong> a greenfield integratedagricultural and renewable energy project, with the objective <strong>of</strong>producing fuel ethanol and electricity in the country. On 10 th February2010, Parliament approved a mining agreement signed between theGovernment <strong>of</strong> <strong>Sierra</strong> <strong>Leone</strong> and the London Mining Company, inline with its drive towards encouraging foreign investment andbroadening the revenue base <strong>of</strong> the country. Also, on 10 th February2010, Mercury International, a Freetown-based Lottery Company,made its first payment to the National Revenue Authority (NRA)under the Goods and Services Tax (GST), in the sum <strong>of</strong> Le231million,as an amount withheld from its ticket sales since the commencement<strong>of</strong> its operation in January 2010. In a bid to contribute towards thedevelopment <strong>of</strong> the education sector in the country, the Africell MobileCompany on 17 th February 2010, disbursed Le12.0mn in respect <strong>of</strong>scholarships awarded to sixty-three (63) pupils in the Junior andInflation Rates - National<strong>Bank</strong> <strong>of</strong> <strong>Sierra</strong> <strong>Leone</strong>website-www.bank<strong>of</strong>sierraleone-centralbank.orgVolume 12 Issue 2Senior Secondary School categories <strong>of</strong> the Saint Joseph’s ConventSecondary School, at Brookfields, Freetown. On 20 th February 2010,the Union Trust <strong>Bank</strong> opened its thirtieth (30 th ) Western Union (UTB/Western Union) outlet at 31 Stoke Road, in Pujehun Town, in theSouthern Region <strong>of</strong> <strong>Sierra</strong> <strong>Leone</strong>, thereby bringing banking servicesto the doorsteps <strong>of</strong> the community.Real SectorPerformance <strong>of</strong> the manufacturing sub-sector was less encouragingas the production levels <strong>of</strong> most products fell in February 2010. Theoutput levels <strong>of</strong> beer & stout and s<strong>of</strong>t drinks dropped by 7.54 thousandcartons (13.63%) to 47.76 thousand cartons and 15.53 thousandcrates (9.49%) to 148.14 thousand crates respectively over the month,due to shortage <strong>of</strong> raw materials, coupled with increased competitionfrom foreign brands. Similarly, the production level <strong>of</strong> cement wasdown by 3.92 thousand metric tons (16.38%) to 20.01 thousandmetric tons, while paint production dropped by 0.53 thousand gallonsPRODUCTIONFeb-09 Mar-09 Apr-09 May-09 Jun-09 Jul-09 Aug-09 Sep-09 Oct-09 Nov-09 Dec-09 Jan-10 Feb-10MineralDiamonds 32.35 25.59 43.73 31.79 48.46 39.30 29.21 35.77 43.88 27.97 25.14 24.85 45.91Industrial 10.33 11.77 30.87 29.20 20.66 16.22 9.64 17.17 16.92 10.59 9.22 13.33 24.66Gem 22.02 13.82 12.86 2.59 27.80 23.08 19.57 18.60 26.95 17.38 16.03 11.52 21.25Bauxite 99.83 110.88 109.89 71.46 ** ** ** ** 61.62 102.12 91.96 87.98 90.49Rutile 5.72 5.97 5.34 4.27 3.80 4.01 3.81 3.12 5.05 7.41 9.06 5.01 3.81Ilmenite 1.69 1.80 1.64 0.98 1.01 0.62 1.08 0.91 0.83 1.22 1.88 0.59 0.83Gold 443.83 684.70 212.06 847.30 100.69 760.71 256.64 384.50 292.38 352.41 820.23R 517.59 489.62AgricultureC<strong>of</strong>fee 487.00 938.73 690.50 306.00 1701.50 1595.00 160.50 175.72 172.80 1006.80 ** ** 110.08Cocoa 1603.02 867.52 317.40 1583.50 412.50 170.50 662.50 2255.00 1835.35 3472.98 3509.50 3181.02 2259.11Manufactured GoodsBeer and Stout 84.46 59.20 76.41 62.08 52.90 52.74 55.72 57.59 66.75 30.37 77.13 55.30 47.76Maltina 24.50 21.12 15.56 21.83 10.79 ** 15.82 10.66 21.60 10.67 26.79 10.78 14.44S<strong>of</strong>t drinks 89.80 103.34 119.60 131.85 111.69 136.08 64.46 120.83 159.56 163.53 232.79 163.67 148.14Cement 22.74 26.79 23.77 24.30 18.41 17.64 15.56 13.20 15.84 16.68 18.90 23.93 20.23Paint 12.69 12.74 12.88 6.51 19.33 15.56 12.53 13.22 11.96 16.86 2.99 22.44 21.91Acetylene 13.80 13.90 14.00 13.70 19.11 12.50 12.20 14.20 13.50 13.00 14.05 17.12 **Oxygen 19.10 19.50 20.00 19.80 21.21 19.50 20.20 20.10 22.30 20.50 22.10 23.36 **Confectionery 288.59 292.94 263.61 310.65 291.11 261.82 251.41 186.64 247.08 288.56 75.59 252.45 243.55Comm on Soap 10.35 58.83 65.20 90.38 6.72 66.45 45.23 52.29 17.89 50.40 78.87 1.21 30.74Flour 1.12 1.22 0.84 0.91 0.88 0.91 0.70 0.88 0.77 0.96 0.76 ** **Sources: Manufacturing Industries, Gold and Diam ond Departm entTable 2.Feb-09 Mar-09 Apr-09 May-09 Jun-09 Jul-09 Aug-09 Sep-09 Oct-09 Nov-09 Dec-09 Jan-10 Feb-10Monthly Inflation Rate % -0.38 0.66 0.45 1.10 1.74 1.45 1.58 0.94 0.17 -1.19 2.30 4.15 2.52Annual Inflation Rate (Yr-on-Yr) % 7.04 7.45 4.83 3.86 5.57 6.11 6.40 6.71 8.08 6.78 9.94 14.83 16.11Consumer Price Index 185.44 186.66 129.09 124.44 126.61 128.45 130.48 131.71 131.93 130.36 133.36 138.90 142.40Source: Statistics <strong>Sierra</strong> <strong>Leone</strong>(2.36%) to 21.91 thousand gallons in the same period. The loweroutput levels for cement and paint was attributed to stockpiles beingcarried over from the preceding month. A decrease was also recordedin the production <strong>of</strong> confectionery by 8.90 thousand pounds (3.53%)to 243.55 thousand pounds, explained by a reduction in the demandfor the product. The production <strong>of</strong> acetylene and oxygen gasestemporarily ceased during the review period, in order to facilitaterefurbishment <strong>of</strong> the factory. In contrast, increases were recorded inthe production levels for Maltina drink and common soap by 33.95percent to 14.44 thousand metric tons and by 29.52 thousand metrictons to 30.74 thousand metric tons, respectively. The increase, inrespect <strong>of</strong> Maltina drink was in response to a rise in consumer1715131197531-1-3Rates(%)Feb-09Mar-09Apr-09May-09Chart 1. Inflation RatesJun-09Annual Inflation Rate (Yr-on-Yr)Monthly Inflation RateJul-09Aug-09PeriodSep-09Oct-09Nov-09Dec-09Jan-10Feb-10
Page 2Monthly Economic ReviewVolume 12 Issue 2 Page 3T a b le 3Fe b-09 M ar-09 Apr-09 M ay-09 Jun-09 Jul-09 Aug-09 Sep-09 Oct-09 Nov-09 Dec-09 Jan-10 Fe b-10Total Revenue (Plus Grants ) Le Mn 40621 102168 55344 59408 64119 99911 119024 69790 61373 56500 190394 56544 110188Domestic Revenue Le Mn 40621 55558 54666 59408 63924 58595 59176 67095 53102 52989 75032 56544 44015Customs & Excise Le Mn 25375 30959 36090 41699 38884 39052 32940 35019 31631 31972 43418 21864 18961Inc om e T ax D ept Le Mn 10506 19932 12162 12658 17409 15725 15870 17148 15307 12824 24172 12462 12250Miscellenous Le Mn 4740 4667 6414 5051 7631 3818 10365 14928 6164 8193 7442 12649 3298Program m ed Funds (Grants) Le Mn ** 46610 678 ** 195 41316 59849 2695 8271 3511 115361 ** 66173Fund <strong>of</strong> w hichH IPC Le Mn ** 2198 678 ** 195 770 ** 2695 6749 ** 253 ** **O thers* Le Mn ** 44412 ** ** ** 40546 59849 **R 1522R 35111 115108 ** 66173Total Expenditure Le Mn 77070 60439 78411 74819 90975.81 97152.15 83030 132370 85586 89759 149768 46466 96465Pensions, Wages & Salaries Le Mn 35321 28065 28210 42401 37486 28060 30100 33044 35890 33321 42027 21522 27637Other Expenditures Le Mn 31457 27550 35962 27003 40239 50642 39291 87579 31875 48070 84147 13191 48176Debt Service Payment Le Mn 10292 4824 14239 5415 13250.81 18450.15 13639 11747 17821 8368 23594 11753 20652D om es tic Le Mn 9170 4824 5863 5415 8422.33 7756 8650 5862 9388 8209 16956 10793 7126F oreign Le Mn 1122 ** 8376 ** 4828.48 10694.15 4989 5885 8433 159 6637 960 13526Ove rall De ficit/Surplus Le Mn -36449 41729 -23067 -15411 -26856.81 2758.85 35995 -62580 -24213 -33259 40626 10078 13722Total Financing Le Mn 36449 -41729 23067 15411 26857.482 -2759 -35995 62580 24213 33259 -40626 -10078 -13722<strong>Bank</strong> Financing Le Mn 6376 12151 -7916 -306 23044 -9455.23 -12851 46544 24420 34652 -39771 -7191 -17514<strong>Bank</strong> <strong>of</strong> <strong>Sierra</strong> <strong>Leone</strong> Le Mn 5218 7782 6620 -2337 28374 -3847.63 -32185 51526 38157 70099 -29616 -2177 -245Commercial <strong>Bank</strong>s Le Mn 1158 4369 -14536 2031 -5330 -5607.6 19334 -4982 -13737 -35447 -10155 -5014 -17269Non-<strong>Bank</strong> Financing Le Mn -6375 -12151 7916 306 -1803 6689.7 -5625 -1483 -206 -1393 -13448 7190 17514Treasury Balance Le Mn 36448 -41729 -23067 15411 5616.4822 5.4613755 -17519 17519 -1 ** -26235 -10077 -13722Foreign Finance Le Mn ** ** ** ** ** ** ** ** ** ** 38826 ** **Sources: Customs and Excise Department, Income T ax Department, B ank <strong>of</strong> <strong>Sierra</strong> <strong>Leone</strong>*** - chinees e loan wrongly pos ted in S ept and revers ed in O c toberdemand during the review month, while the sharp rise (2,31.74%) incommon soap production in the month was in a bid to replenish stocksas there was virtually no production <strong>of</strong> the commodity during the precedingmonth. Shipment <strong>of</strong> cash crops in the period under review showed adownward trend, with the recorded volume <strong>of</strong> cocoa shipment decliningsignificantly by 28.98 percent to 2.26 thousand metric tons, while only amarginal volume <strong>of</strong> c<strong>of</strong>fee beans (0.11 thousand metric tons) was producedin the month. There was no production <strong>of</strong> c<strong>of</strong>fee in <strong>December</strong> 2009 andJanuary 2010. The decline in cocoa shipment was explained by periodbeing an <strong>of</strong>f-season for harvesting <strong>of</strong> the crop, while the drop in shipment<strong>of</strong> c<strong>of</strong>fee bean was attributed to the poor quality grade <strong>of</strong> the c r o pproduced during the month, coupled with limited farmingactivities. In the mining sub sector, the total volume <strong>of</strong>diamonds shipped during the month, as recorded and valuedby the Gold and Diamond Department (GDD), was up by amarked 84.75 percent to 45.91 thousand carats. The totalcomprised 24.66 thousand carats <strong>of</strong> industrial diamonds and 21.25thousand carats <strong>of</strong> gem diamonds, up from 13.33 thousand carats and11.52 thousand carats, shipped in January 2010. Similarly, the outputlevel for bauxite was up by 2.85 percent to 90.49 thousand metric tons inthe reporting period, while output <strong>of</strong> ilmenite (a bye-product <strong>of</strong> rutile) roseby 40.68 percent to 0.83 thousand metric tons. The significant increasein diamond shipment, as well as in the output levels for bauxite andilmenite was due to increased mining activities during the month. On theother hand, output levels for rutile and gold in the reporting month decreasedby 23.95 percent to 3.81 thousand metric tons and 5.40 percent to489.62 ounces, respectively. The national year-on-year Inflation rate(2007=100) increased by 1.28 percentage points from 14.83 percent inJanuary 2010 to 16.11 percent in February 2010. Similarly, the combinedmonthly Consumer Price Index (2007 = 100) increased from 138.90 inJanuary 2010 to 142.40 in February 2010, indicating an increase in themonthly inflation rate by 2.52 percent. The increase in the inflation ratewas reflected in increases in the indices for the following group items:food (2.61%), alcoholic beverage (4.1%), housing (1.78%), furniture &household equipment (4.99%), health (4.12%), transport (5.3%),recreation (2.69%), and miscellaneous goods & services (1.1%). ThereTable 4.G o v e rn m e n t F in a n c e swas a general increase in prices in all the major towns continuingfrom the inflationary situation experienced in January 2010, followingthe introduction <strong>of</strong> the Goods and Services Tax and the increase inthe domestic price per gallon <strong>of</strong> fuel. As a result, all centres recordeddouble digits in their year-on-year inflation rates during the month <strong>of</strong>February 2010. In Freetown, the year-on-year inflation rate,(2007=100) increased from 13.30 percent in January 2010 to 15.83percent in February 2010.Fiscal OperationsGovernment fiscal balance for February 2010 recorded a surplus <strong>of</strong>Le13.72bn, indicating an increase <strong>of</strong> 36.16 percent on the surplus<strong>of</strong> Le10.08bn for January 2010. It also reflected a markedimprovement on the overall deficit <strong>of</strong> Le36.45bn recorded for thecorresponding period in 2009 and Le16.38bn higher than theestimated deficit <strong>of</strong> Le2.66bn, in spite <strong>of</strong> the drop recorded in totaldomestic revenue and increase in aggregate expenditure in thereview month. The surplus mainly arose from the receipt <strong>of</strong> budgetarysupport in the sum <strong>of</strong> Le66.17bn from the Japanese Food Aid andthe United Kingdom/Department for International Development (UK/DfID). Total revenue (including grants) <strong>of</strong> Le110.19bn for FebruaryRates(%)252015105Feb-09Mar-09Apr-09May-09Jun-09Chart 2. Interest RatesJul-09Aug-09PeriodSep-09Treasury Bills (3-months)Treasury Bearer Bonds (1-year)SavingsLending (Prime)Feb-09 Mar-09 Apr-09 May-09 Jun-09 Jul-09 Aug-09 Sep-09 Oct-09 Nov-09 Dec-09 Jan-10 Feb-10Reserve Money (RM) Le Mn 454076 455262 451156 467138 457826.88 480394 462915 468204 504427 505410 563032 535852 543091Broad Money (M2) Le Mn 1372842 1360703 1387778 1357353 1359844 1418316 1452633 1498651 1601741 1642538 1684978 R 1662790 1655146Narrow Money (M1) Le Mn 695656 682087 684231 684266 662085 700461 697782 735062 760777 757846 808358 785879 788496Currency in Circulation Le Mn 337449 335046 323220 336123 323084 333161 334818 347070 363020 388072 420921 412913 407165Demand Deposits Le Mn 358207 347041 361011 348143 339001 367300 362964 387992 397757 369774 386559 R 372966 381330Net Claims on Government Le Mn 236078.04 208994.23 215859 192450 216604 189494 166121 238118 264453 280377 213264 203325 164184BSL^ Le Mn 26558.042 -424.7723 22206 37729.8 73073.53 63128 19094 91081 122628 188767 144030 132115 117465DMB Le Mn 209520 209419 193653 154720.5 143530.35 126348 147027 147037 141825 91610 69234 71210 46720Claims on Private Sector Le Mn 469811 480909 476120 484016 496652 509876 531432 556231 564095 592237 600982 621114 627249Of Which: Commercial <strong>Bank</strong>s** Le Mn 461405 472722 466202 473374 486708 499323 521644 546949 555479 584120 594073 611069 617787Net Foreign Assets Le Mn 792727 802345 818514 799429 806587 850547 1365127 1308660 1436345 1495632 1541759 1499838 1493824Other Items (Net) Le Mn 125774.04 131545.23 122715 118542 159999 131583 610047 604358 662152 725708 671027 661487 630111*Excludes Government Securities issued on behalf<strong>of</strong> BSL and HIPC Deposits** R evised to reflect definition <strong>of</strong>Claims on Private Sector given in the M onetary Survey which includes only Private enterprises and IndividualsSource:Returns from BSL & CommercialbankMonetary AggregatesOct-09Nov-09Dec-09Jan-10Feb-10Table 5.Interest R atesFeb-09 Mar-09 Apr-09 May-09 Jun-09 Jul-09 Aug-09 Sep-09 Oct-09 Nov-09 Dec-09 Jan-10 Feb-10Treasury Bills (3-months) % 9.39 9.29 9.41 9.72 9.72 9.504 9.85 10.75 11.88 12.79 13.99 14.72 15.47Treasury Bearer Bonds (1-yr.) % 12.26 11.24 11.70 12.04 12.06 11.89 11.95 12.32 14.08 14.38 14.33 14.73 14.84DepositsSavings % 6.37 6.35 6.35 6.35 6.35 6.35 6.35 6.32 6.31 6.32 6.32 6.32 6.321 - 3 month % 9.51 9.31 9.17 9.17 9.17 9.17 9.01 8.87 8.70 8.87 8.87 8.87 8.873 - 6 month % 10.04 9.88 9.73 9.73 9.73 9.73 9.61 9.45 9.42 9.45 9.45 9.45 9.456 - 9 month % 9.33 9.25 9.25 9.25 9.25 9.25 9.25 9.25 9.25 9.25 9.25 9.25 9.259 - 12 month % 10.72 11.46 11.21 11.21 11.21 11.21 11.05 10.82 10.77 10.84 10.84 10.84 10.84Lending (Prime) % 23-30 22-29 22-29 22-29 22-29 22-29 22-29 22-29 22-29 22-29 22-29 22-29 22-29Source: <strong>Bank</strong> <strong>of</strong> <strong>Sierra</strong> <strong>Leone</strong>2010 reflected significant increases <strong>of</strong> Le53.64bn (94.87%) and Le69.57bn(171.26%) on the January 2010 and February 2009 positions, respectively.It was also 29.45 percent higher than the period’s programme target <strong>of</strong>Le85.12bn. The marked increase in total revenue during the month wasdue to the receipt <strong>of</strong> budgetary support which was 74.11 percent higherthan the month’s programmed target. Domestic revenue collected duringthe month stood at Le 44.01bn. This amount was Le12.53bn (22.16%)and Le3.10bn (6.58%) respectively, below the preceding month’s positionand the programme target, which was mainly accounted for by a significantdecrease in customs & excise and miscellaneous receipts. Domesticrevenue was however 8.35 percent higher than the corresponding receiptsin 2009. Revenue from customs and excise payments amounting toLe18.96bn for the review month accounted for 43.08 percent <strong>of</strong> domesticrevenue and were also 13.28 percent and 25.28 percent respectively,lower than similar receipts in the preceding month (January 2010) and thecorresponding month (January 2009). It also reflected a shortfall <strong>of</strong> Le2.90bn(13.28%) in the month’s budget estimate. The underperformance from theCustoms & Excise department was attributed to the low volume <strong>of</strong> importsas part <strong>of</strong> the business community adopted a wait and see posture followingthe introduction <strong>of</strong> the Good and Services Tax. Aggregate income taxreceipts recorded Le12.25bn for the period under review, and accountedfor 27.83 percent <strong>of</strong> domestic revenue. The amount was also 1.70 percentlower than the January 2010 position <strong>of</strong> Le12.46bn. It was however 16.60percent higher than the total <strong>of</strong> Le10.51bn for February 2009. Goods andServices Tax receipts totaled Le9.51bn for the reporting period, contributing21.60 percent <strong>of</strong> domestic revenue and 0.66 percent below the Le9.57bnrecorded for January 2010. The total was also significantly (127.23%)higher than estimated target. Miscellaneous receipts, comprising royaltyfees, fishing licensing fees and dividends from parastatals amounted toLe3.30bn, accounting for 7.49 percent <strong>of</strong> total domestic revenue duringthe month. Relative to similar receipts for January 2010 and February2009, decreases <strong>of</strong> Le9.35bn (73.93%) and Le1.44bn (30.43%) respectively,were indicated. Aggregate government expenditures recorded Le96.47bnfor February 2010, reflecting increases <strong>of</strong> Le50.00bn (107.60%) andLe19.40bn (25.17%) on the fiscal outlays for January 2010 and February2009, respectively. It was however a 9.89 percent reduction on the monthlybudget target <strong>of</strong> Le87.78bn. The increase in total expenditure during thereview period, relative to both periods was largely accounted for by theincreases in expenditure on pensions and wages & salaries andother expenditures comprising mainly goods and services. Payments<strong>of</strong> wages & salaries increased over the month to Le27.64bn, 28.41percent higher than the preceding month’s position. “Other”expenditure mainly on goods and services more than tripled(Le34.99bn or 265.22%) to Le48.18bn in February 2010 and wasalso Le16.72bn (53.15%) and Le5.15bn (11.96%) abovecorresponding payments in February 2009 and the monthly target,respectively. Total debt servicing <strong>of</strong> Le20.65bn was Le8.90bn (75.72%)and Le10.36bn (100.66%) higher than both the preceding month’spayments and the corresponding month’s position in 2009,respectively. Foreign interest payments accounted for the bulk <strong>of</strong>interest payments at Le13.53bn, registering significant increaseson the corresponding payments <strong>of</strong> Le0.96bn and Le1.12bn forJanuary 2010 and February 2009, respectively. It also surpassedthe monthly budget target <strong>of</strong> Le0.83bn. Domestic interest payments<strong>of</strong> Le7.13bn were however 33.98 percent and 22.29 percent belowsimilar payments in January 2010 and February 2009, respectively.Monetary DevelopmentsDuring the month <strong>of</strong> February 2010, developments in monetaryaggregates were mixed with Narrow Money(M1) and Reserve Money (RM) expanding byLe2.54bn (0.32%) and Le7.24bn (1.35%) toLe788.50bn and Le543.09bn, respectively.Broad Money (M2) contracted by Le7.64bn(0.46%) to Le1,655.15bn. The rise in M1 wasas a result <strong>of</strong> the increase in Demand Deposits (Le8.36bn), whichwas more than the decline in Currency in Circulation (Le5.75bn).The increase in commercial banks’ Demand Deposits (Le4.82bn),particularly deposits <strong>of</strong> private enterprises and individuals, contributedgreatly to the increase in Demand Deposits. The <strong>Bank</strong> <strong>of</strong> <strong>Sierra</strong><strong>Leone</strong> issued less currency during the month, thus influencing theposition <strong>of</strong> Currency in Circulation. The expansion in Reserve Moneyemanated mainly from the increase in commercial banks’ depositswith the <strong>Bank</strong> <strong>of</strong> <strong>Sierra</strong> <strong>Leone</strong> (Le10.67bn), which more thanoutweighed the reduction in Currency Issued (Le6.98bn). The majorcontributing factor to the decline in M2 was the drop in commercialTable 6.EXCHANGE RATES (Average Monthly Buying)Feb-09 Mar-09 Apr-09 May-09 Jun-09 Jul-09 Aug-09 Sep-09 Oct-09 Nov-09 Dec-09 Jan-10 Feb-10<strong>Leone</strong> to DollarOfficial Le/$ 3031.72 3072.71 3123.37 3166.06 3220.88 3280.79 3461.25 3558.03 3662.70 3708.89 3845.97 3880.71 3854.90Comm. <strong>Bank</strong>s Le/$ 3016.76 3062.13 3126.18 3164.28 3236.35 3274.67 3486.91 3557.04 3665.81 3783.28 3823.90 3881.35 3818.80Bureaux Le/$ 2995.70 3007.96 3032.45 3023.95 3037.55 3132.24 3305.94 3700.70 3741.56 3792.76 3872.54 3957.24 3810.11Parallel Market Le/$ 3089.70 3145.09 3177.21 3219.52 3283.32 3432.87 3728.90 3905.19 3998.14 4079.88 3996.14 4012.30 4012.61<strong>Leone</strong> to PoundR Le/£ 4370.63 4354.07 4589.58 4864.94 5264.38 5460.51 5725.37 5816.69 5925.34 5965.55 6245.32 6266.17 6041.33Source: <strong>Bank</strong> <strong>of</strong> <strong>Sierra</strong> <strong>Leone</strong>Table 7.EXCHANGE RATES (Average Monthly Selling)Feb-09 Mar-09 Apr-09 May-09 Jun-09 Jul-09 Aug-09 Sep-09 Oct-09 Nov-09 Dec-09 Jan-10 Feb-10<strong>Leone</strong> to DollarAuction Le/$ 3106.51 3179.14 3249.14 3291.963 3317.13 3384.53 3556.77 3579.96 3607.35 3664.78 3793.24 3814.44 3652.54Official R Le/$ 3092.97 3134.78 3186.46 3230.02 3285.95 3244.68 3531.18 3629.91 3736.69 3857.26 3923.67 3954.01 3932.78Comm. <strong>Bank</strong>s Le/$ 3104.86 3156.95 3195.68 3245.13 3296.73 3373.74 3562.44 3655.35 3777.21 3937.78 3956.33 3974.33 3976.18Bureaux Le/$ 3072.99 3075.56 3122.2 3122.98 3153.75 3244.68 3444 3705.88 3806.86 3893.34 4031.46 4053.12 3891.06Parallel Mkt. Le/$ 3105.22 3166.56 3198.89 3263.24 3326.05 3467.70 3765.71 3931.00 4007.18 4144.93 4052.50 4048.00 4048.11<strong>Leone</strong> to Pound R Le/£ 4460.34 4443.4 4683.69 4964.64 5372.11 5445.01 5842.55 5935.78 6046.71 6087.77 6373.26 6388.51 6165.06Source; <strong>Bank</strong> <strong>of</strong> <strong>Sierra</strong> <strong>Leone</strong>T able 8.F OR E IGN E XCHANGE AU CT IONJan- 06 - 10 Jan-13-10 Jan-20-10 Jan-27-10MonthlyAverage Feb- 03 - 10 Feb- 10 - 10 Feb-17-10 Feb-24-10 MonthlyAverageA uct i o nR at es /W ei ght ed A vg. Le/$ 3854.85 3857.66 3812.85 3732.40 3814.44 3672.09 3664.82 3647.90 3625.36 3652.54Clearing R ate Le/$ 3800.00 3750.00 3500.00 - 3683.33 - - - - -S ource: B ank <strong>of</strong> S ierra <strong>Leone</strong>