Determining the Concentration of a Solution: Beer's Law - Vernier ...
Determining the Concentration of a Solution: Beer's Law - Vernier ...
Determining the Concentration of a Solution: Beer's Law - Vernier ...

You also want an ePaper? Increase the reach of your titles
YUMPU automatically turns print PDFs into web optimized ePapers that Google loves.
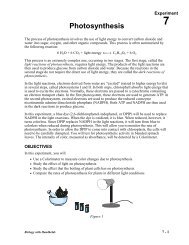
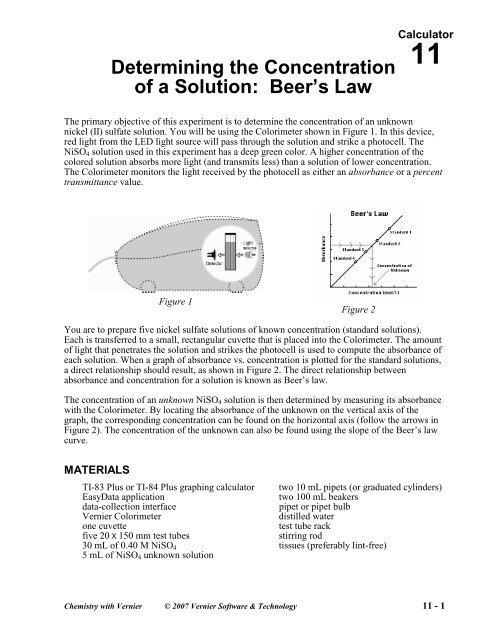
<strong>Determining</strong> <strong>the</strong> <strong>Concentration</strong><strong>of</strong> a <strong>Solution</strong>: Beer’s <strong>Law</strong>Calculator11The primary objective <strong>of</strong> this experiment is to determine <strong>the</strong> concentration <strong>of</strong> an unknownnickel (II) sulfate solution. You will be using <strong>the</strong> Colorimeter shown in Figure 1. In this device,red light from <strong>the</strong> LED light source will pass through <strong>the</strong> solution and strike a photocell. TheNiSO 4 solution used in this experiment has a deep green color. A higher concentration <strong>of</strong> <strong>the</strong>colored solution absorbs more light (and transmits less) than a solution <strong>of</strong> lower concentration.The Colorimeter monitors <strong>the</strong> light received by <strong>the</strong> photocell as ei<strong>the</strong>r an absorbance or a percenttransmittance value.Figure 1Figure 2You are to prepare five nickel sulfate solutions <strong>of</strong> known concentration (standard solutions).Each is transferred to a small, rectangular cuvette that is placed into <strong>the</strong> Colorimeter. The amount<strong>of</strong> light that penetrates <strong>the</strong> solution and strikes <strong>the</strong> photocell is used to compute <strong>the</strong> absorbance <strong>of</strong>each solution. When a graph <strong>of</strong> absorbance vs. concentration is plotted for <strong>the</strong> standard solutions,a direct relationship should result, as shown in Figure 2. The direct relationship betweenabsorbance and concentration for a solution is known as Beer’s law.The concentration <strong>of</strong> an unknown NiSO 4 solution is <strong>the</strong>n determined by measuring its absorbancewith <strong>the</strong> Colorimeter. By locating <strong>the</strong> absorbance <strong>of</strong> <strong>the</strong> unknown on <strong>the</strong> vertical axis <strong>of</strong> <strong>the</strong>graph, <strong>the</strong> corresponding concentration can be found on <strong>the</strong> horizontal axis (follow <strong>the</strong> arrows inFigure 2). The concentration <strong>of</strong> <strong>the</strong> unknown can also be found using <strong>the</strong> slope <strong>of</strong> <strong>the</strong> Beer’s lawcurve.MATERIALSTI-83 Plus or TI-84 Plus graphing calculator two 10 mL pipets (or graduated cylinders)EasyData applicationtwo 100 mL beakersdata-collection interfacepipet or pipet bulb<strong>Vernier</strong> Colorimeterdistilled waterone cuvettetest tube rackfive 20 X 150 mm test tubesstirring rod30 mL <strong>of</strong> 0.40 M NiSO 4 tissues (preferably lint-free)5 mL <strong>of</strong> NiSO 4 unknown solutionChemistry with <strong>Vernier</strong> © 2007 <strong>Vernier</strong> S<strong>of</strong>tware & Technology 11 - 1
Calculator 11PROCEDURE1. Obtain and wear goggles! CAUTION: Be careful not to ingest any NiSO 4 solution or spillany on your skin. Inform your teacher immediately in <strong>the</strong> event <strong>of</strong> an accident.2. Add about 30 mL <strong>of</strong> 0.40 M NiSO 4 stock solution to a 100 mL beaker. Add about 30 mL <strong>of</strong>distilled water to ano<strong>the</strong>r 100 mL beaker.3. Label four clean, dry, test tubes 1–4 (<strong>the</strong> fifth solution is <strong>the</strong> beaker <strong>of</strong> 0.40 M NiSO 4 ). Pipet2, 4, 6, and 8 mL <strong>of</strong> 0.40 M NiSO 4 solution into Test Tubes 1–4, respectively. With a secondpipet, deliver 8, 6, 4, and 2 mL <strong>of</strong> distilled water into Test Tubes 1–4, respectively.Thoroughly mix each solution with a stirring rod. Clean and dry <strong>the</strong> stirring rod betweenstirrings. Keep <strong>the</strong> remaining 0.40 M NiSO 4 in <strong>the</strong> 100 mL beaker to use in <strong>the</strong> fifth trial.Volumes and concentrations for <strong>the</strong> trials are summarized below:Trialnumber0.40 M NiSO4(mL)Distilled H2O(mL)<strong>Concentration</strong>(M)1 2 8 0.082 4 6 0.163 6 4 0.244 8 2 0.325 ~10 0 0.404. Turn on <strong>the</strong> calculator. Connect <strong>the</strong> Colorimeter, data-collection interface, and calculator.5. Prepare a blank by filling an empty cuvette ¾ full with distilled water. Seal <strong>the</strong> cuvette with alid. To correctly use a Colorimeter cuvette, remember:• All cuvettes should be wiped clean and dry on <strong>the</strong> outside with a tissue.• Handle cuvettes only by <strong>the</strong> top edge <strong>of</strong> <strong>the</strong> ribbed sides.• All solutions should be free <strong>of</strong> bubbles.• Always position <strong>the</strong> cuvette with its reference mark facing toward <strong>the</strong> white reference markat <strong>the</strong> right <strong>of</strong> <strong>the</strong> cuvette slot on <strong>the</strong> Colorimeter.6. Set up EasyData for data collection and calibrate <strong>the</strong> Colorimeter.a. Start <strong>the</strong> EasyData application, if it is not already running.b. Select from <strong>the</strong> Main screen, and <strong>the</strong>n select New to reset <strong>the</strong> application.c. Select from <strong>the</strong> Main screen, and <strong>the</strong>n select Events with Entry.d. Place <strong>the</strong> blank in <strong>the</strong> cuvette slot <strong>of</strong> <strong>the</strong> Colorimeter and close <strong>the</strong> lid.e. Set <strong>the</strong> wavelength on <strong>the</strong> Colorimeter to 635 nm, <strong>the</strong>n calibrate by pressing <strong>the</strong> CALbutton on <strong>the</strong> Colorimeter.7. You are now ready to collect absorbance-concentration data for <strong>the</strong> five standard solutions.a. Select from <strong>the</strong> Main screen.b. Empty <strong>the</strong> water from <strong>the</strong> cuvette. Using <strong>the</strong> solution in Test Tube 1, rinse <strong>the</strong> cuvettetwice with ~1 mL amounts and <strong>the</strong>n fill it 3/4 full. Wipe <strong>the</strong> outside with a tissue, place itin <strong>the</strong> Colorimeter, and close <strong>the</strong> lid.c. When <strong>the</strong> value displayed on <strong>the</strong> calculator screen has stabilized, select . Enter 0.080as <strong>the</strong> concentration in mol/L, <strong>the</strong>n select . The absorbance and concentration valueshave now been saved for <strong>the</strong> first solution.11 - 2 Chemistry with <strong>Vernier</strong>
<strong>Determining</strong> <strong>the</strong> <strong>Concentration</strong> <strong>of</strong> a <strong>Solution</strong>: Beer’s <strong>Law</strong>d. Discard <strong>the</strong> cuvette contents as directed by your instructor. Using <strong>the</strong> solution in TestTube 2, rinse <strong>the</strong> cuvette twice with ~1 mL amounts, and <strong>the</strong>n fill it 3/4 full. After closing<strong>the</strong> lid, wait for <strong>the</strong> value displayed on <strong>the</strong> calculator screen to stabilize and select .Enter 0.16 as <strong>the</strong> concentration in mol/L, and select .e. Repeat <strong>the</strong> procedure for Test Tube 3 (0.24 M) and Test Tube 4 (0.32M), as well as <strong>the</strong>stock 0.40 M NiSO 4 . Note: Wait until Step 8 to do <strong>the</strong> unknown.f. Select to stop data collection. The absorbance and concentration values have nowbeen saved for <strong>the</strong> standard solutions.g. Examine <strong>the</strong> data points along <strong>the</strong> curve on <strong>the</strong> displayed graph. As you move <strong>the</strong> cursorright or left, <strong>the</strong> concentration (X) and absorbance (Y) values <strong>of</strong> each data point aredisplayed above <strong>the</strong> graph. Record <strong>the</strong> absorbance values in your data table (round to <strong>the</strong>nearest 0.001).h. Select to return to <strong>the</strong> Main screen.8. Determine <strong>the</strong> absorbance value <strong>of</strong> <strong>the</strong> unknown NiSO 4 solution. To do this:a. Obtain about 5 mL <strong>of</strong> <strong>the</strong> unknown NiSO 4 in ano<strong>the</strong>r clean, dry, test tube. Record <strong>the</strong>number <strong>of</strong> <strong>the</strong> unknown in your data table.b. Rinse <strong>the</strong> cuvette twice with <strong>the</strong> unknown solution and fill it about 3/4 full. Wipe <strong>the</strong>outside <strong>of</strong> <strong>the</strong> cuvette, place it into <strong>the</strong> Colorimeter, and close <strong>the</strong> lid.c. Monitor <strong>the</strong> absorbance value displayed on <strong>the</strong> calculator. When this value has stabilized,record it in your data table (round to <strong>the</strong> nearest 0.001).d. Dispose <strong>of</strong> <strong>the</strong> remaining solution as directed by your instructor.9. Discard <strong>the</strong> solutions as directed by your instructor. Proceed directly to Steps 1–2 <strong>of</strong>Processing <strong>the</strong> Data.PROCESSING THE DATA1. To determine <strong>the</strong> concentration <strong>of</strong> <strong>the</strong> unknown NiSO 4 solution, plot a graph <strong>of</strong> absorbancevs. concentration with a linear regression curve displayed, <strong>the</strong>n interpolate along <strong>the</strong>regression line to convert <strong>the</strong> absorbance value <strong>of</strong> <strong>the</strong> unknown to concentration. To do this:a. Select from <strong>the</strong> Main screen.b. Select , <strong>the</strong>n Linear Fit. The linear-regression statistics for <strong>the</strong>se two lists aredisplayed for <strong>the</strong> equation in <strong>the</strong> formy = ax + bwhere y is absorbance, x is concentration, a is <strong>the</strong> slope, and b is <strong>the</strong> y-intercept.Note: One indicator <strong>of</strong> <strong>the</strong> quality <strong>of</strong> your data is <strong>the</strong> size <strong>of</strong> b. It is a very small value if<strong>the</strong> regression line passes through or near <strong>the</strong> origin. The correlation coefficient, r,indicates how closely <strong>the</strong> data points match up with (or fit) <strong>the</strong> regression line. A value <strong>of</strong>1.00 indicates a nearly perfect fit.c. To display <strong>the</strong> linear-regression curve on <strong>the</strong> graph <strong>of</strong> absorbance vs. concentration, select. This graph should indicate a direct relationship between absorbance andconcentration, a relationship known as Beer’s law. The regression line should closely fit<strong>the</strong> five data points and pass through (or near) <strong>the</strong> origin <strong>of</strong> <strong>the</strong> graph.d. To interpolate along <strong>the</strong> curve, press . A cursor is displayed on <strong>the</strong> regression line, alongwith its X and Y coordinates below <strong>the</strong> graph. Use or to move <strong>the</strong> cursor to anabsorbance value (Y value) that is closest to <strong>the</strong> absorbance reading you obtained inStep 8. The NiSO 4 concentration, in mol/L, will be equal to <strong>the</strong> corresponding X value.Record this value in your data table.Chemistry with <strong>Vernier</strong> 11 - 3
Calculator 112. Print a graph <strong>of</strong> absorbance vs. concentration, with a regression line and interpolatedunknown concentration displayed.DATA AND CALCULATIONSTrial <strong>Concentration</strong> (mol/L) Absorbance1 0.0802 0.163 0.244 0.325 0.406 Unknown number ____<strong>Concentration</strong> <strong>of</strong> unknownmol/L11 - 4 Chemistry with <strong>Vernier</strong>
Experiment11TEACHER INFORMATION<strong>Determining</strong> <strong>the</strong> <strong>Concentration</strong><strong>of</strong> a <strong>Solution</strong>: Beer’s <strong>Law</strong>1. The student pages with complete instructions for data-collection using LabQuest App,Logger Pro (computers), EasyData or DataMate (calculators), and DataPro (Palm handhelds)can be found on <strong>the</strong> CD that accompanies this book. See Appendix A for more information.2. The light source for <strong>the</strong> nickel (II) sulfate solution is <strong>the</strong> red LED (635 nm). Since <strong>the</strong> NiSO 4is green in color, <strong>the</strong> nearly monochromatic red light is readily absorbed by <strong>the</strong> solution.3. The 0.40 M NiSO 4 solution can be prepared by using 10.51 g <strong>of</strong> NiSO 4 •6H 2 O per 100 mL.HAZARD ALERT: Toxic; avoid dispersing this substance; dispense with care; Nickel dustis a possible carcinogen. Hazard Code: B—Hazardous.The hazard information reference is: Flinn Scientific, Inc., Chemical & Biological CatalogReference Manual, (800) 452-1261, www.flinnsci.com. See Appendix D <strong>of</strong> this book,Chemistry with <strong>Vernier</strong>, for more information.4. <strong>Solution</strong>s <strong>of</strong> Ni(NO 3 ) 2 also work well, and can be prepared by using 11.63 g <strong>of</strong> solidNi(NO 3 ) 2 •6H 2 O per 100 mL <strong>of</strong> solution.5. Unknowns can be prepared by doing dilutions starting with <strong>the</strong> 0.40 M NiSO 4 stock solution.For example, to prepare a 0.22 M unknown, use 55 mL <strong>of</strong> <strong>the</strong> standard plus 45 mL <strong>of</strong> water:(55 mL / 100 mL)(.40 M) = 0.22 M6. This experiment works well using solutions <strong>of</strong> green food coloring. A solution with anabsorbance similar to 0.40 M NiSO 4 can be prepared by dissolving 8–9 drops <strong>of</strong> greenSchilling Food Coloring in 1 liter <strong>of</strong> water. Check to see that <strong>the</strong> absorbance <strong>of</strong> this stocksolution falls in <strong>the</strong> range <strong>of</strong> 0.40 to 0.80. Assign this solution a concentration <strong>of</strong> 100%.Students will follow <strong>the</strong> same procedure to dilute <strong>the</strong> stock solution to 80%, 60%, 40%, and20%. If you use this method, have your students load <strong>the</strong> Exp 11b Colorimeter in <strong>the</strong>Experiment 11 folder in Chemistry with <strong>Vernier</strong>. This file has concentration scaled from 0 to100% on <strong>the</strong> horizontal axis.7. The cuvette must be from 55% to 100% full in order to get a valid absorbance reading. Ifstudents fill <strong>the</strong> cuvette 3/4 full, as described in <strong>the</strong> procedure, <strong>the</strong>y should easily be in thisrange. To avoid spilling solution into <strong>the</strong> cuvette slot, remind students not to fill <strong>the</strong> cuvette8. Since <strong>the</strong>re is some variation in <strong>the</strong> amount <strong>of</strong> light absorbed by <strong>the</strong> cuvette if it is rotated180°, you should use a water-pro<strong>of</strong> marker to make a reference mark on <strong>the</strong> top edge <strong>of</strong> one<strong>of</strong> <strong>the</strong> clear sides <strong>of</strong> all cuvettes. Students are reminded in <strong>the</strong> procedure to align this markwith <strong>the</strong> white reference mark at <strong>the</strong> top <strong>of</strong> <strong>the</strong> cuvette slot on <strong>the</strong> Colorimeter.8. The use <strong>of</strong> a single cuvette in <strong>the</strong> procedure is to eliminate errors introduced by slightvariations in <strong>the</strong> absorbance <strong>of</strong> different plastic cuvettes. If one cuvette is used throughout <strong>the</strong>experiment by a student group, this variable is eliminated. The two rinses done prior toadding a new solution can be accomplished very quickly.9. There are two models <strong>of</strong> <strong>Vernier</strong> Colorimeters. The first model (rectangular shape) has threewavelength settings, and <strong>the</strong> newest model (a rounded shape) has four wavelength settings.The 635 nm wavelength <strong>of</strong> ei<strong>the</strong>r model is used in this experiment. The newer model is anauto-ID sensor and supports automatic calibration (pressing <strong>the</strong> CAL button on <strong>the</strong>Chemistry with <strong>Vernier</strong>11 - 1 T
Experiment 11Colorimeter with a blank cuvette in <strong>the</strong> slot). If you have an older model Colorimeter, seewww.vernier.com/til/1665.html for calibration information.10. This experiment gives you a good opportunity to discuss <strong>the</strong> relationship between percenttransmittance and absorbance. At <strong>the</strong> end <strong>of</strong> <strong>the</strong> experiment, students can click <strong>the</strong>Absorbance vertical-axis label <strong>of</strong> <strong>the</strong> graph, and choose Transmittance. The graph shouldnow be transmittance vs. concentration. You can also discuss <strong>the</strong> ma<strong>the</strong>matical relationshipbetween absorbance and percent transmittance, as represented by ei<strong>the</strong>r <strong>of</strong> <strong>the</strong>se formulas:A = log(100 / %T) or A = 2 – log%TSAMPLE RESULTSTrial<strong>Concentration</strong>(mol / L)Absorbance1 xxxx xxxx2 xxxx xxxx3 xxxx xxxx4 xxxx xxxx5 xxxx xxxx6 xxxx xxxx<strong>Concentration</strong> <strong>of</strong> <strong>the</strong> unknownxxxx mol/LAbsorbance vs. concentration for NiSO 4with interpolation <strong>of</strong> <strong>the</strong> unknown displayed11 - 2 T Chemistry with <strong>Vernier</strong>