Yield Mapping and Use of Yield Map Data
Yield Mapping and Use of Yield Map Data
Yield Mapping and Use of Yield Map Data
- No tags were found...

You also want an ePaper? Increase the reach of your titles
YUMPU automatically turns print PDFs into web optimized ePapers that Google loves.
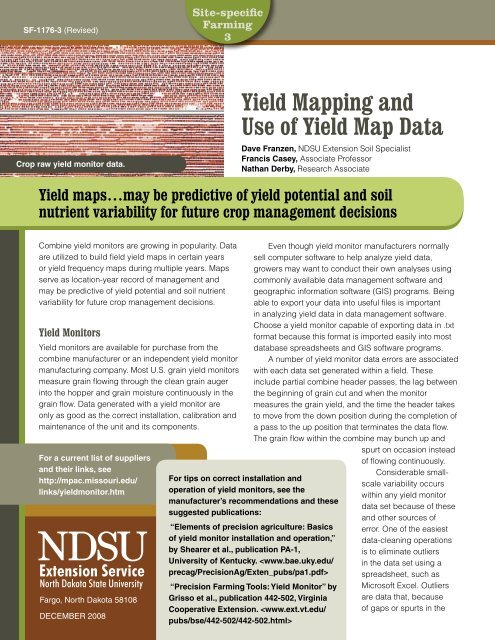
SF-1176-3 (Revised)Site-specificFarming3Crop raw yield monitor data.<strong>Yield</strong> <strong><strong>Map</strong>ping</strong> <strong>and</strong><strong>Use</strong> <strong>of</strong> <strong>Yield</strong> <strong>Map</strong> <strong>Data</strong>Dave Franzen, NDSU Extension Soil SpecialistFrancis Casey, Associate Pr<strong>of</strong>essorNathan Derby, Research Associate<strong>Yield</strong> maps…may be predictive <strong>of</strong> yield potential <strong>and</strong> soilnutrient variability for future crop management decisionsCombine yield monitors are growing in popularity. <strong>Data</strong>are utilized to build fi eld yield maps in certain yearsor yield frequency maps during multiple years. <strong>Map</strong>sserve as location-year record <strong>of</strong> management <strong>and</strong>may be predictive <strong>of</strong> yield potential <strong>and</strong> soil nutrientvariability for future crop management decisions.<strong>Yield</strong> Monitors<strong>Yield</strong> monitors are available for purchase from thecombine manufacturer or an independent yield monitormanufacturing company. Most U.S. grain yield monitorsmeasure grain fl owing through the clean grain augerinto the hopper <strong>and</strong> grain moisture continuously in thegrain fl ow. <strong>Data</strong> generated with a yield monitor areonly as good as the correct installation, calibration <strong>and</strong>maintenance <strong>of</strong> the unit <strong>and</strong> its components.For a current list <strong>of</strong> suppliers<strong>and</strong> their links, seehttp://mpac.missouri.edu/links/yieldmonitor.htmFargo, North Dakota 58108DECEMBER 2008Even though yield monitor manufacturers normallysell computer s<strong>of</strong>tware to help analyze yield data,growers may want to conduct their own analyses usingcommonly available data management s<strong>of</strong>tware <strong>and</strong>geographic information s<strong>of</strong>tware (GIS) programs. Beingable to export your data into useful fi les is importantin analyzing yield data in data management s<strong>of</strong>tware.Choose a yield monitor capable <strong>of</strong> exporting data in .txtformat because this format is imported easily into mostdatabase spreadsheets <strong>and</strong> GIS s<strong>of</strong>tware programs.A number <strong>of</strong> yield monitor data errors are associatedwith each data set generated within a fi eld. Theseinclude partial combine header passes, the lag betweenthe beginning <strong>of</strong> grain cut <strong>and</strong> when the monitormeasures the grain yield, <strong>and</strong> the time the header takesto move from the down position during the completion <strong>of</strong>a pass to the up position that terminates the data fl ow.The grain fl ow within the combine may bunch up <strong>and</strong>spurt on occasion instead<strong>of</strong> fl owing continuously.For tips on correct installation <strong>and</strong>operation <strong>of</strong> yield monitors, see themanufacturer’s recommendations <strong>and</strong> thesesuggested publications:“Elements <strong>of</strong> precision agriculture: Basics<strong>of</strong> yield monitor installation <strong>and</strong> operation,”by Shearer et al., publication PA-1,University <strong>of</strong> Kentucky. “Precision Farming Tools: <strong>Yield</strong> Monitor” byGrisso et al., publication 442-502, VirginiaCooperative Extension. Considerable smallscalevariability occurswithin any yield monitordata set because <strong>of</strong> these<strong>and</strong> other sources <strong>of</strong>error. One <strong>of</strong> the easiestdata-cleaning operationsis to eliminate outliersin the data set using aspreadsheet, such asMicros<strong>of</strong>t Excel. Outliersare data that, because<strong>of</strong> gaps or spurts in the
<strong>Yield</strong> <strong><strong>Map</strong>ping</strong> <strong>and</strong> <strong>Use</strong> <strong>of</strong> <strong>Yield</strong> <strong>Map</strong> <strong>Data</strong>Site-specificFarming3grain stream, are unreasonably low or high yields. Forexample, in a fi eld <strong>of</strong> spring wheat that varies from 20 to50 bushels per acre (bu/acre), some yield points may beas high as 150 bu/a. These actual yields most likely donot exist, so choosing a more reasonable maximum yieldis desirable.In fi elds with soluble salt problems, zero yield ispossible. Cleaning the lower end <strong>of</strong> the yield sort is morediffi cult. In this case, the area <strong>of</strong> actual zero yield wouldneed to be identifi ed within the data set <strong>and</strong> only thosedata not within the problem area should be consideredfor cleaning.In fi elds where actual grain yields are not zero,choosing some lower limit <strong>of</strong> yield also would berecommended. A data sort from high to low within aspreadsheet then can be conducted, <strong>and</strong> yields above<strong>and</strong> below the limits can be deleted from the dataset. Some precision-ag consultants have their ownproprietary cleaning s<strong>of</strong>tware. A public arena download<strong>of</strong> yield data-cleaning s<strong>of</strong>tware is available from theUSDA-ARS in Missouri (Suddoth, 2007) at www.ars.usda.gov/services/s<strong>of</strong>tware/download.htm?s<strong>of</strong>twareid=20.Since small spatial errors occur among yieldmeasurements, yield monitor data usually are displayedas maps in larger zones <strong>of</strong> varying yield ranges. Theseyield maps are useful to producers because they visuallyshow that yields vary throughout the fi eld <strong>and</strong> where theyields are high, low <strong>and</strong> in between without the clutter<strong>of</strong> individual dots that vary widely in value. For visualdisplay, choosing yield increments that make sense ishelpful. For example, in a corn fi eld, choosing displayranges <strong>of</strong> 30 bu/acre in a fi eld that averages 200 bu/acreis probably appropriate. Displaying ranges <strong>of</strong> 10 bu/acre increments would create a map that would be too“busy” <strong>and</strong> hard to interpret. In contrast, a spring wheatfi eld that averaged 40 bu/acre would need increments<strong>of</strong> about 10 bu/acre or less to be meaningful. Thirty bu/acre increments may not show important variation fromthe average.Although the yield map itself is a useful tool thatillustrates the management <strong>and</strong> climate results forthe current growing season, yield maps also may bepredictive <strong>of</strong> future yield potential <strong>and</strong> might be relatedto the availability <strong>of</strong> certain soil nutrients, such asnitrogen. Single-year yield maps for predictive purposeshave not been nearly as useful as multiyear yield maps.A multiyear yield map also is called a “yield frequencymap.”Whether a fi eld has had a history <strong>of</strong> a single cropor a diverse crop rotation, the same general procedureshould be followed to create a yield frequency map. Afi eld that has been in wheat continuously for 10 yearsmight average 80 bu/acre one year <strong>and</strong> 20 bu/acreanother year. The actual bushels for the fi eld thereforecannot be used when the data sets are combined. Ifthe fi eld was corn one year, soybeans the next, wheatthe next <strong>and</strong> then sunfl owers the year after, these yieldsobviously cannot be added to each other spatially withany meaning. The range <strong>of</strong> yields in any year thereforemust be “normalized.”Normalization is a simple mathematical exercise thatconverts bu/acre into relative yield. In the example year <strong>of</strong>high wheat yield with highest cleaned yield <strong>of</strong> 80 bu/acre,divide each yield by 80. The range <strong>of</strong> yields is thereforefrom 0 to 1. If the next year is canola <strong>and</strong> the highestcanola yield is 3,500 pounds/acre, divide each yield by3,500. The range <strong>of</strong> yields is from 0 to 1.Another way to normalize yield data is to normalizeit at the end <strong>of</strong> analysis <strong>and</strong> not at the beginning. Usingthe following fi gures as examples, fi rst impose a grid onthe yield data that makes some sense. A fi eld shouldhave at least 40 grids to produce a meaningful map at theend <strong>of</strong> the exercise. For example, a user might chooseto superimpose 40 1-acre grids over a 40-acre fi eld. Aquarter-section might have 2-acre grids. A 20-acre fi eldmight have ½-acre grids.To create the grids <strong>and</strong> the average yield within agrid, use a s<strong>of</strong>tware program such as Surfer (GoldenS<strong>of</strong>tware Co., Golden, Colo.) or ArcGIS (ESRI GISS<strong>of</strong>tware Co., Redl<strong>and</strong>s, Calif.) that can import spatialdata <strong>and</strong> then convert them to estimated values. Thisestimation feature usually is used for taking less densedata <strong>and</strong> estimating values at small distances. However, italso can be used to take densely sampled data, such asthe thous<strong>and</strong>s <strong>of</strong> points <strong>of</strong> yield data, <strong>and</strong> average themwithin a less dense grid <strong>of</strong> your choosing. In Surfer, theresulting grid fi le can be saved in an ASCI text fi le <strong>and</strong>then uploaded into a spreadsheet.Within the spreadsheet, the grid is given a +1, -1 or0 value, depending on whether the average <strong>of</strong> the grid isgreater than the fi eld average, less than the fi eld averageor within ½ bu/acre <strong>of</strong> the fi eld average. Giving the +1, -1or 0 is a normalization procedure. Then these normalizedgrids can be exported into a spreadsheet <strong>and</strong> summedby grid with other years <strong>of</strong> data that have been treated
An example <strong>of</strong> raw yield monitor datafrom a field <strong>of</strong> spring wheat in bu/acre.During the normalization process, agrid is superimposed over the data. Thes<strong>of</strong>tware recognizes the set boundaries foraveraging the data inside each grid box.The data are averaged within eachgrid box independently <strong>of</strong> the otherdata.If the data average within the grid is higher than average, the grid isgiven a +1. If average, it is given a value <strong>of</strong> 0. If the average within thegrid is lower than average, the grid is given a -1. Afterward, this datacan be exported into a spreadsheet for summing multiple years <strong>of</strong> yielddata that have been h<strong>and</strong>led similarly. The resulting summation can beimported into mapping s<strong>of</strong>tware to construct the yield frequency map.YEAR 1YEAR 2YEAR 3YEAR 4Each year’s data aresuperimposed withthe same grid. <strong>Yield</strong>sare averaged withineach grid. +1 is givento grids greater thanaverage for the field, -1for grids lower than theaverage <strong>and</strong> 0 for therare grid that is within ahalf-bushel <strong>of</strong> average.These grids then aresummed individuallywithin a spreadsheet<strong>and</strong> remapped into themapping s<strong>of</strong>tware.YEAR 5A series <strong>of</strong> five years <strong>of</strong> crop raw yieldmonitor data <strong>of</strong> the same field. Missing datacan be normalized by weighting yields byyears <strong>of</strong> data so the large area <strong>of</strong> missingdata in the third yield map is divided onlyby 4 instead <strong>of</strong> 5, or normalized by thesummation multiplied by 1.25, to comparefavorably with data from five years <strong>of</strong> mapsinstead <strong>of</strong> the four it has available.A visual depiction<strong>of</strong> the four years<strong>of</strong> individuallynormalized yieldssummed <strong>and</strong> mappedas a yield frequencymap (bottom map).
A yield frequency map depicting acorn <strong>and</strong> soybean rotation in Illinoisin a five-year period (from Franzen,2008). Each individual year did notshow all <strong>of</strong> these patterns. Meaningfullong-term trends in yield were revealedwith accompanying relationshipsto soil phosphorus, potassium <strong>and</strong>pH (acidity or alkalinity) levels onlyfollowing the combination <strong>of</strong> years.in the exact same manner. In this way, two years, threeyears or 20-plus years <strong>of</strong> data can be combined tocreate a more meaningful yield frequency map.The yield frequency map has been used as a zonelayer for revealing residual soil nitrate <strong>and</strong> other nutrientsin North Dakota. The yield frequency map also can helpreveal areas that require additional management, suchas a change in nitrogen application timing or a change indrainage if permitted. It can reveal the yield drag due tohedgerows, saline spots, compacted areas or locationscontaining harmful levels <strong>of</strong> sodium.The yield frequency map also can be usedconceivably to predict the relative performance <strong>of</strong> farms<strong>and</strong> evaluate future production potential for renting orpurchasing decisions. If the soils on a farm that youmanage have a certain level <strong>of</strong> productivity, this potentialproductivity probably also is possible on farms withinseveral miles <strong>of</strong> that farm. This information can helpdetermine whether a farm is worth renting or buying.The yield maps are a valuable archive <strong>of</strong> fi eldperformance <strong>and</strong> the changes that management mighthave had on the fi elds. These archived maps <strong>and</strong> datacan be shared with bankers to help secure loans <strong>and</strong>with future renters or purchasers <strong>of</strong> the l<strong>and</strong>. They canbe passed down to the next generation so that the thingsgrowers learn about their fi elds will not be lost to theheirs.Many growers also use a yield monitor to helpdevelop nutrient strategies on specifi c farms. Differentrates <strong>of</strong> nitrogen, for example, can be applied in stripsacross soils within a fi eld, <strong>and</strong> the yields can help thegrower determine what the best rate might be for a soilor the fi eld. In addition, new products can be tested ona small strip within the fi eld <strong>and</strong> the effi cacy <strong>of</strong> their use<strong>Yield</strong> frequencymap at Williston,N.D. (top), withlower yields onthe ridge slope(southeast tonorthwest direction)<strong>and</strong> higher yieldin the more levelareas above <strong>and</strong>below the ridgeslope (southwest<strong>and</strong> northeast)(elevation image onthe bottom).can be much more easily seen this way than by using aweigh wagon. The many data points <strong>of</strong> each strip alsolend themselves to the use <strong>of</strong> statistics <strong>of</strong>fered withinspreadsheets to provide confi dence to the growerthat the differences seen were statistically real or not.Variability within a fi eld can mask differences or createdifferences unless statistics are used to help eliminatethe clutter.ReferencesSuddoth, 2007. <strong>Yield</strong> editor s<strong>of</strong>tware. USDA-ARS. www.ars.usda.gov/services/s<strong>of</strong>tware/download.htm?s<strong>of</strong>twareid=20Franzen, 2008. Summary <strong>of</strong> forty years <strong>of</strong> grid sampling in twoIllinois fi elds. NDSU Technical Report.The NDSU Extension Service does not endorse commercial productsor companies even though reference may be made to tradenames,trademarks or service names.This publication may be copied for noncommercial, educational purposesin its entirety with no changes. Requests to use any portion <strong>of</strong> thedocument (including text, graphics or photos) should be sent to NDSU.permission@ndsu.edu. Include exactly what is requested for use <strong>and</strong>how it will be used.For more information on this <strong>and</strong> other topics, see: www.ag.ndsu.eduCounty commissions, North Dakota State University <strong>and</strong> U.S. Department <strong>of</strong> Agriculture cooperating. North Dakota State University does not discriminateon the basis <strong>of</strong> race, color, national origin, religion, sex, disability, age, Vietnam Era Veterans status, sexual orientation, marital status, or public assistancestatus. Direct inquiries to the Vice President for the Division <strong>of</strong> Equity, Diversity <strong>and</strong> Global Outreach, 205 Old Main, (701) 231-7708. This publication will bemade available in alternative formats for people with disabilities upon request, (701) 231-7881.1M-12-08