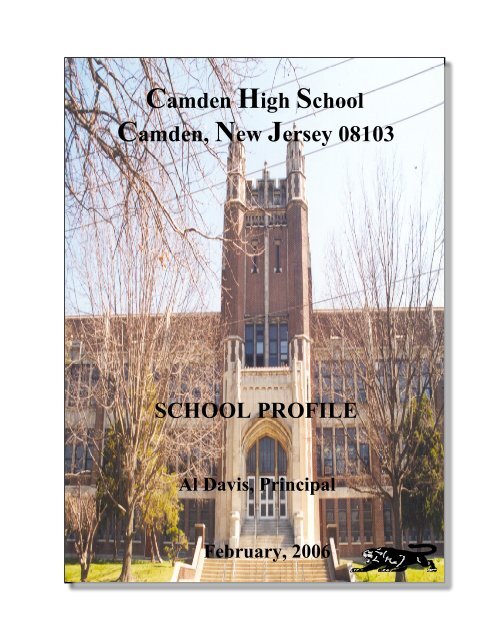
Camden High School Camden, New Jersey 08103 - Camden City ...
Camden High School Camden, New Jersey 08103 - Camden City ...
Camden High School Camden, New Jersey 08103 - Camden City ...

You also want an ePaper? Increase the reach of your titles
YUMPU automatically turns print PDFs into web optimized ePapers that Google loves.
STUDENT PERFORMANCE INDICATORSASSESSMENTS (HSPA)The statewide assessment system comprises state tests that are designed to measure student progress in theattainment of the Core Curriculum Content Standards. Under the No Child Left Behind Act of 2001(NCLB), all states are required to assess student progress in language arts and math in grades 3-8. <strong>High</strong>schools show assessment results from four administrations of the <strong>High</strong> <strong>School</strong> Proficiency Assessment(HSPA), the test that students must pass in order to graduate from high school.<strong>High</strong> <strong>School</strong> Proficiency Assessment(HSPA)LANGUAGE ARTS LITERACYYearAll Students<strong>School</strong> 2004-052003-042002-032001-02District 2004-052003-042002-032001-02DFG 2004-052003-042002-032001-02State 2004-052003-042002-032001-02Proficiency PercentagesNumberTested Partial Proficient Advanced207154206229503473525535118031173511200104959485890946883208450964.7%78.6%76.7%70.3%55.3%56.0%57.9%58.1%41.6%42.0%44.9%43.4%16.8%17.8%19.8%18.9%34.8%21.4%23.3%29.3%43.3%42.9%40.6%40.2%54.2%53.7%51.1%53%63.6%65.0%65%66.3%0.5%0.0%0%0.4%1.4%1.1%1.5%1.7%4.2%4.3%4%3.5%19.6%17.2%15.1%14.8%<strong>High</strong> <strong>School</strong> Proficiency Assessment(HSPA)MATHEMATICSYearAll Students<strong>School</strong> 2004-052003-042002-032001-02District 2004-052003-042002-032001-02DFG 2004-052003-042002-032001-02State 2004-052003-042002-032001-02Proficiency PercentagesNumberTested Partial Proficient Advanced194148197226478465509529115051165611134103299393990712881238403080.4%89.9%82.7%85%69.9%76.1%76.4%74.7%54.0%62.4%68.2%65.3%24.5%30.0%34.2%31.4%19.6%10.1%17.3%15%27.2%21.9%22.8%24.6%38.6%32.5%28.9%31.4%47.1%45.6%46.4%49.5%0%0%0%0%2.9%1.9%0.8%0.8%7.4%5.1%3%3.3%28.4%24.5%19.5%19.1%
OTHER PERFORMANCE MEASURESThese are the grade-level percentages of students on average who are present at school each day. They arecalculated by dividing the sum of days present in each grade level by the sum of possible days for allstudents in each grade. The school and state totals are calculated by the sum of days present in allapplicable grade levels divided by the total possible days for all students.ATTENDANCE RATES2004-2005 2003-2004 2002-2003 2001-2002Percentage of studentspresent on average each day.<strong>School</strong> State <strong>School</strong> State <strong>School</strong> State <strong>School</strong> StateGrade 9 76.3% 93.7% 68.8% 93.5% 77.1% 93.4% 73.7% 93.3%Grade 10 82.4% 93.7% 72.4% 93.6% 80.8% 93.5% 81.9% 93.5%Grade 11 82.9% 93.4% 77.8% 93.2% 83.8% 9.1% 81.4% 93.3%Grade 12 83.7% 92.1% 84.9% 92.0% 87.0% 91.9% 85.1% 91.9%Special Ed. (ungraded) 74.4% 91.3% 67.0% 90.9% 74.8% 91.0% 69.8% 90.9%Total <strong>School</strong> 78.6% 94.4% 71.7% 94.4% 79.4% 94.3% 77.2% 94.4%These are the percentages of students who dropped out of grades 9-12 presented by various subgroups. Thepercentages are calculated by dividing the number of students in grades 9 through 12 who dropped out ofschool during the period of July to June each school year by the October enrollment reported for grades 9through 12.DROPOUT RATESPercentage of students in grades9-12 who dropped out during theschool year.2004-2005 2003-2004 2002-2003 2001-2002<strong>School</strong> State <strong>School</strong> State <strong>School</strong> State <strong>School</strong> StateWhite 30.0% 1.2% 10.0% 1.0% 42.9% 1.2% 125.0% 1.5%Black 23.7% 3.4% 10.4% 3.4% 10.7% 3.2% 20.3% 5.3%Hispanic 23.4% 3.8% 26.3% 3.6% 17.1% 3.9% 24.9% 5.0%American Indian &Alaska Native 0.0% 4.9% 0.0% 4.9% 0.0% 2.8% 0.0% 2.3%Asian & Pacific Islander 200.0% 0.7% 0.0% 0.7% 0.0% 0.7% 50.0% 0.9%Male 26.7% 2.2% 19.4% 2.0% 13.6% 2.2% 28.7% 3.0%Female 21.2% 1.6% 11.9% 1.6% 12.7% 1.6% 17.2% 2.2%With Disabilities -- -- -- -- -- -- -- --Limited English Proficiency -- -- -- -- -- -- -- --Economically Disadvantaged -- -- -- -- -- -- -- --Total 23.8% 1.9% 15.4% 1.8% 13.1% 1.9% 22.3% 2.6%
OTHER PERFORMANCE MEASURESGraduation Rate<strong>School</strong> State AverageClass of 2005 (2004-05) 38.0% 91.3%Class of 2004 (2003-04) 28.7% 90.5%Class of 2003 (2002-03) 47.0% 89.5%Post-Graduation PlansPercentage of graduating seniors pursuing various selfreportedpost-high school plans.Intended Pursuits 2005 2004 2003Four-year College/University 26.1% 24.5% 34.8%Two-year College 47.0% 51.7% 39.5%Other CollegeOther Post-secondary <strong>School</strong> 12.2% 7.0% 2.9%Military 0.9% 0.7% 1.9%Full-time Employment 13.9% 4.2% 21.0%Part-time Employment -- -- --Undecided -- 11.9% --Other -- -- --Student SuspensionsPercentage of students who were suspended from the schoolduring the school year.<strong>School</strong>State Average2004-05 0.0% 13.6%2003-04 19.4% 14.9%2002-03 11.6% 14.4%Student ExpulsionsThe number of students who were expelled from the schoolduring the school year.<strong>School</strong>State Total2004-05 0 692003-04 0 1022002-03 1 82
STAFF INFORMATIONStudent/Administrator RatioNumbers of students per administrator.<strong>School</strong> State Average2004-05 132.8 182.32003-04 139.5 186.72002-03 255.0 189.6Student/Faculty RatioNumbers of students per faculty member.<strong>School</strong> State Average2004-05 8.0 11.42003-04 8.6 11.62002-03 11.7 11.6Faculty Attendance RatePercentage of faculty present on average each day.<strong>School</strong> State Average2004-05 95.7 96.32003-04 94.4 96.22002-03 95.6 96.1There are three essential components of ahighly qualified teacher in accordancewith the No Child Left Behind (NCLB)Act:Hold at least a bachelor's degree;Be fully certified/licensed by<strong>New</strong> <strong>Jersey</strong>; andDemonstrate competence in eachof the core academic subjects inwhich the teacher teaches.Teachers can demonstrate competence inthe subject(s) they teach by either:Passing a rigorous state test orcompleting an academic major,graduate degree, courseworkequivalent to an undergraduateacademic major, or nationalcertification or credentialing; ORMeeting the requirements of theNJ <strong>High</strong>, Objective UniformState Evaluation (HOUSE)Standard.Teacher InformationPercentage of teachers teaching withemergency or conditional certificates.2004-05<strong>School</strong> DistrictState2.5% 3.6% 1.6%Faculty and Administrator CredentialsPercentage of faculty and administrators possessing abachelor's, master's, or doctoral degree.BA/BS MA/MS PhD/EdD2004-05 68.2% 30.7% 1.1%2003-04 67.4% 31.4% 1.2%2002-03 69.0% 29.6% 1.4%Faculty Mobility Rate% of faculty who entered and left the school during the schoolyear.2004-052003-04<strong>School</strong>State Average0.0% 7.1%3.1% 6.9National Board CertificationNumber of teachers who have been certified bythe National Board for Professional TeachingStandards.<strong>School</strong> District State2004-05 0 0 982003-04 0 0 632002-03 0 0 16