
You also want an ePaper? Increase the reach of your titles
YUMPU automatically turns print PDFs into web optimized ePapers that Google loves.
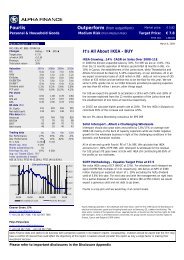
<strong>Fourlis</strong> (<strong>FRLr</strong>.<strong>AT</strong>)Holding Group (IKEA franchise)Reason for report: Quarterly Update<strong>Outperform</strong>(Unchanged)TP: EUR24.20from EUR17.00Share Price: EUR21.44ASE Index: 4,797.2728/06/07Valuation ratios 2005 2006 2007e 2008fP/E (x) 19.58 24.64 35.39 25.29P/CE (x) 14.14 19.23 28.36 20.10P/BV (x) 3.80 5.42 7.04 5.20EV/EBITDA (x) 10.99 14.83 21.53 15.75EV/Sales (x) 1.15 1.52 2.03 1.69RoE (%) 19.4% 22.0% 19.9% 20.6%RoIC (%) 13.6% 15.7% 14.7% 14.7%Note: Ratios are calculated on 'clean' figuresFundamentals 2005 2006 2007e 2008fTurnover 407.52 482.05 600.07 736.77EBITDA 42.83 60.10 63.47 89.91EBT 28.55 47.90 49.61 70.10Net profit 18.11 27.43 37.88 53.91EPS (EUR) 0.36 0.54 0.74 1.06'Clean' EPS (EUR) 0.36 0.49 0.61 0.85DPS (EUR) 0.15 0.18 0.22 0.31Shareholders funds 93.97 114.07 155.07 209.99Net debt 113.39 115.52 123.14 155.44Note: Amounts are in EUR mn unless otherwise statedMargins (%) 2005 2006 2007e 2008fGross profit 30.7% 29.5% 30.3% 32.1%EBITDA 10.5% 12.5% 10.6% 12.2%EBT 7.0% 9.9% 8.3% 9.5%'Clean' net profit 4.5% 5.2% 5.1% 5.9%Dividend yield 2.1% 1.5% 1.0% 1.4%Growth rates (%) 2005 2006 2007e 2008fSales 14.7% 18.3% 24.5% 22.8%EBITDA 14.6% 40.3% 5.6% 41.7%Net profit -42.3% 51.5% 38.1% 42.3%'Clean' net profit 148.6% 37.5% 23.1% 40.0%Share price data 1m 6m 12m Y-t-DRel. perf. vs GI 13.7% 26.1% 44.5% 22.3%Abs. perf. 10.9% 37.8% 97.1% 33.5%L-T growth 0.0% (for IKEA)WACC 8.5%12-month Price Target (EUR) 24.20 (SOTP)Target Market Cap. (Eur mn) 1,232.88Current Market Cap. (Eur mn) 1,092.43Outstanding shares (mn) 50.95Free float 83.7%Average daily volume (shares) 66,371200.00190.00180.00170.00160.00150.00140.00130.00120.00110.00100.0090.0080.0070.0026/06/0626/07/0626/08/0626/09/0626/10/0626/11/0626/12/0626/01/07Four l i s FTSE 40 ASE GI26/02/0726/03/0726/04/0726/05/0726/06/0712 Ikea Stores!What happened in the meantime<strong>Fourlis</strong> raised 2006 sales by 18.3% to EUR482.05mn, EBITDA by 40.3%to EUR60.10mn and net profit by 51.5% to EUR27.43mn. The group’soutstanding performance continued in 1Q07, with sales rising by 35.4% toEUR125.59mn, EBITDA soaring 121.0% to EUR20.49mn, and net profittripling to EUR12.02mn.2007 guidanceDuring its AGM, <strong>Fourlis</strong>’ management provided guidance for 2007 callingfor group sales of EUR EUR600mn (in line) and EBT of EUR50mn (belowJCF consensus for EUR55mn). In effect, these numbers translate tolesser contribution from the higher-margin IKEA franchise, as the 2 newIKEA stores will commence operations later than initially expected.Differences with consensusOn our new numbers, we lie below consensus EPS estimates for 2007(-10%) and 2008 (-19%) and in line on 2009 numbers. We lieconsiderably above on 2010-2012 forecasts, primarily because we nowlook for 12 IKEA stores by end 2011 compared to consensus estimatesfor 10. Our lower medium term estimates stem from the timing of newIKEA store rollouts and higher start-up costs.Sources of further upside/downsideWe employ conservative assumptions on a) the timing of new IKEA storerollouts, b) turnover per new store (the 2 existing stores perform wayabove the market’s estimates a few years ago), and c) operating margins.Better-than-expected performance from IKEA (or faster launches) willimmediately imply a higher fair value for the group. The oppositeconstitutes <strong>Fourlis</strong>’ major risk, along with the possibility of losing the IKEAfranchise (quite remote at the moment). We only incorporate IKEArollouts in Greece, Cyprus and Bulgaria. New franchise agreements in theBalkans could act as significant catalysts.Reiterate <strong>Outperform</strong> – New Target Price at EUR24.20We value <strong>Fourlis</strong> at EUR24.20/share, with IKEA accounting for 86% oftotal. Although <strong>Fourlis</strong> trades on demanding near term multiples, webelieve it still offers a unique story of visible and superior growth. Weexpect the group to raise recurring EPS by a 35% CAGR over 2006-2009, when current valuation would place it on a 17.8 P/E. By 2009, weestimate the group will start generating significant FCFE that will reachapproximately EUR100mn in 2012 (and this despite continuing highCAPEX for IKEA store rollouts). The excess liquidity could finance newbusiness ventures and licensing agreements (not in our forecasts).Comparable Companies<strong>Fourlis</strong> is the only listed franchisee of IKEA globally.Company Description<strong>Fourlis</strong> is a holding group consisting of 3 main divisions: Home Furnishingthrough the IKEA brand, Athletics retail through the Intersport brand, andWholesale of electric/electronic goods, representing General Electric,Samsung, and other international brands in Greece. The group sold in 2004 a21.5% stake of the leading electronics retailer Kotsovolos to Dixons, another10% in 2007 and retains an additional 10% with the option to sell it in 2008.<strong>Fourlis</strong> operates 2 IKEA stores in Athens and Thessaloniki and has announcedplans for 2 more by end 2007.John Arapoglou (+30 210 3354 367) ioannis.arapoglou@piraeus-sec.grRESEARCH DEPARTMENT, 10 STADIOU STR, 105 64 <strong>AT</strong>HENS, GREECE, TEL. +30 210 3354100, FAX +30 210 3354287WEB PAGE: www.piraeus-sec.gr, E-MAIL: info@piraeus-sec.grPlease read important disclosures at the end of the report
Piraeus Securities<strong>Fourlis</strong>1Q 2007 Results Review<strong>Fourlis</strong> Group, Quarterly performanceElectrics/electronics wholesale 1Q06 2Q06 3Q06 4Q06 1Q07 y-o-ySales 45.74 52.63 60.79 76.58 63.83 39.5%% of total 49.3% 48.7% 47.3% 50.1% 50.8%EBITDA 1.53 1.11 1.37 2.09 2.45 59.7%EBITDA margin 3.3% 2.1% 2.3% 2.7% 3.8%% of total 16.5% 10.0% 6.0% 12.5% 11.9%IKEA franchise 1Q06 2Q06 3Q06 4Q06 1Q07 y-o-ySales 38.60 43.31 56.11 62.85 50.27 30.2%% of total 41.6% 40.1% 43.7% 41.1% 40.0%EBITDA 7.26 8.74 10.05 13.94 10.70 47.3%EBITDA margin 18.8% 20.2% 17.9% 22.2% 21.3%% of total 78.3% 78.3% 43.8% 83.4% 52.2%Intersport franchise 1Q06 2Q06 3Q06 4Q06 1Q07 y-o-ySales 8.40 12.10 11.52 13.46 11.49 36.8%% of total 9.1% 11.2% 9.0% 8.8% 9.2%EBITDA 0.70 1.51 1.17 1.57 0.94 33.9%EBITDA margin 8.4% 12.5% 10.2% 11.6% 8.2%% of total 7.6% 13.5% 5.1% 9.4% 4.6%Parent/Other 1Q06 2Q06 3Q06 4Q06 1Q07 y-o-ySales 0.00 0.00 0.00 -0.03 0.00 naEBITDA -0.23 -0.19 10.34 -0.88 6.41 naEBITDA margin na na na na na% of total -2.4% -1.7% 45.1% -5.3% 31.3%<strong>Fourlis</strong> Group 1Q06 2Q06 3Q06 4Q06 1Q07 y-o-ySales 92.74 108.03 128.41 152.87 125.59 35.4%EBITDA 9.27 11.17 22.94 16.71 20.49 121.0%EBITDA margin 10.0% 10.3% 17.9% 10.9% 16.3%Depreciation 1.72 1.70 1.76 1.86 1.82Financial expenses 1.02 1.62 1.78 0.73 1.86EBT 6.53 7.85 19.40 14.12 16.82 157.5%EBT margin 7.0% 7.3% 15.1% 9.2% 13.4%Tax 2.38 3.71 6.69 7.84 4.79Effective tax rate 36.5% 47.3% 34.5% 55.5% 28.5%Minorities 0.03 -0.09 -0.12 0.02 0.01Net profit 4.12 4.23 12.83 6.26 12.02 192.2%Net margin 4.4% 3.9% 10.0% 4.1% 9.6%Sources: Company, Piraeus Sec.<strong>Fourlis</strong> staged an impressive performance in the first quarter of the year, with group net profit rising by 192.2% y-o-y to EUR12.02mn, courtesy of:a) robust top line growth across all business units,b) a significant EBITDA margin improvement in the IKEA franchise,c) contained SG&A expenses - as a % of sales - for the group, andd) a EUR7.01mn other operating income booked by the parent company.The latter relates to the sale of a 10% stake of Kotsovolos to DSG (Dixons Group) for EUR22.3mn and boosted after tax earnings by EUR5.26mnor EUR43.7%. Excluding this capital gain, group net profit rose by 64% y-o-y to EUR6.76mn.Intersport and the Wholesale division delivered combined revenues of EUR75.32mn or 60% of total. Their EBITDA contribution stood at a muchlower 16.5% (EUR3.39mn). With the parent company accounting for a net EBITDA contribution of EUR6.41mn (capital gain minus operatingexpenses), the remaining 52.2% of group EBITDA was fuelled by the usual suspect: IKEA.The first IKEA store in Thessaloniki is in its 6 th year of full operations, while the second (and last up to now) IKEA store in Athens is in its thirdyear. This makes the 30.2% top line growth achieved in the quarter even more spectacular.Please read important disclosures at the end of the report Page 2
Piraeus Securities<strong>Fourlis</strong>Forecasts<strong>Fourlis</strong> Group, Earnings BreakdownEUR mn FY05 FY06 FY07e FY08f FY09f FY10f FY11f FY12fElectrics/electronics wholesaleSales 197.24 235.74 272.28 285.89 300.19 315.20 330.96 347.51y-o-y -1.7% 19.5% 15.5% 5.0% 5.0% 5.0% 5.0% 5.0%% of total 48.4% 48.9% 45.4% 38.8% 33.6% 30.7% 28.9% 27.6%EBITDA 5.71 6.11 7.62 8.01 8.41 8.83 9.27 9.73y-o-y -64.3% 7.0% 24.9% 5.0% 5.0% 5.0% 5.0% 5.0%% of total 13.3% 10.2% 12.0% 8.9% 7.5% 7.0% 6.5% 5.8%EBITDA margin 2.9% 2.6% 2.8% 2.8% 2.8% 2.8% 2.8% 2.8%Intersport franchiseSales 31.69 45.48 58.50 69.73 79.85 87.33 91.69 96.28y-o-y 10.7% 43.5% 28.6% 19.2% 14.5% 9.4% 5.0% 5.0%% of total 7.8% 9.4% 9.7% 9.5% 8.9% 8.5% 8.0% 7.6%EBITDA 3.21 4.95 6.73 8.37 9.98 11.35 11.92 12.52y-o-y 21.3% 54.2% 35.8% 24.4% 19.3% 13.7% 5.0% 5.0%% of total 7.5% 8.2% 10.6% 9.3% 9.0% 9.0% 8.3% 7.5%EBITDA margin 10.1% 10.9% 11.5% 12.0% 12.5% 13.0% 13.0% 13.0%IKEA franchiseSales 178.60 200.86 269.28 381.14 512.40 625.61 722.10 815.23y-o-y 41.7% 12.5% 34.1% 41.5% 34.4% 22.1% 15.4% 12.9%% of total 43.8% 41.7% 44.9% 51.7% 57.4% 60.8% 63.1% 64.8%EBITDA 34.85 40.00 43.81 64.54 87.81 107.52 123.73 145.90y-o-y 75.7% 14.8% 9.5% 47.3% 36.1% 22.4% 15.1% 17.9%% of total 81.4% 66.5% 69.0% 71.8% 78.8% 85.3% 86.4% 87.7%EBITDA margin 19.5% 19.9% 16.3% 16.9% 17.1% 17.2% 17.1% 17.9%Parent/Other (incl. intra-group)EBITDA -0.94 9.04 5.31 9.00 5.31 -1.71 -1.71 -1.71% of total -2.2% 15.0% 8.4% 10.0% 4.8% -1.4% -1.2% -1.0%<strong>Fourlis</strong> GroupSales 407.52 482.05 600.07 736.77 892.44 1,028.13 1,144.75 1,259.01y-o-y 14.7% 18.3% 24.5% 22.8% 21.1% 15.2% 11.3% 10.0%EBITDA 42.83 60.10 63.47 89.91 111.51 125.99 143.21 166.44y-o-y 14.6% 40.3% 5.6% 41.7% 24.0% 13.0% 13.7% 16.2%EBITDA margin 10.5% 12.5% 10.6% 12.2% 12.5% 12.3% 12.5% 13.2%Depreciation 7.03 7.06 7.65 11.14 13.36 14.20 16.35 16.80Financial income, net -7.26 -5.48 -6.55 -9.00 -8.34 -8.25 -8.65 -8.85Income from participations 0.00 0.33 0.33 0.33 0.33 0.33 0.33 0.33EBT 28.55 47.90 49.61 70.10 90.14 103.87 118.55 141.13EBT margin 7.0% 9.9% 8.3% 9.5% 10.1% 10.1% 10.4% 11.2%Tax charge 10.31 20.62 11.89 16.42 20.75 27.85 27.26 32.35Effective tax rate 36.1% 43.1% 24.0% 23.4% 23.0% 26.8% 23.0% 22.9%Minority rights 0.13 -0.16 -0.16 -0.23 0.99 1.75 1.97 3.11Net profit 18.11 27.43 37.88 53.91 68.40 74.27 89.32 105.67Net profit margin 4.4% 5.7% 6.3% 7.3% 7.7% 7.2% 7.8% 8.4%Dividend 7.64 9.17 11.29 15.80 22.44 28.64 32.66 38.63Dividend payout 42.2% 33.4% 29.8% 29.3% 32.8% 38.6% 36.6% 36.6%Shares, adjusted 50.95 50.95 50.95 50.95 50.95 50.95 50.95 50.95EPS 0.36 0.54 0.74 1.06 1.34 1.46 1.75 2.07y-o-y -42.3% 51.5% 38.1% 42.3% 26.9% 8.6% 20.3% 18.3%'Clean' EPS 0.36 0.49 0.61 0.85 1.20 1.54 1.75 2.07y-o-y 148.6% 37.5% 23.1% 40.0% 42.1% 27.6% 14.0% 18.3%DPS 0.15 0.18 0.22 0.31 0.44 0.56 0.64 0.76y-o-y 50.0% 20.0% 23.1% 40.0% 42.1% 27.6% 14.0% 18.3%Sources: Company, Piraeus Sec.Please read important disclosures at the end of the report Page 3
Piraeus Securities<strong>Fourlis</strong>We expect <strong>Fourlis</strong> to raise organic EPS by a 35% CAGR to EUR1.20 over 2006-2009f. The IKEA franchise will remain the primary growth engine,with the number of stores rising from 2 at the moment to 8 by end 2009. We expect IKEA to generate net profit of EUR54.38mn in 2009f or 79% ofgroup net profit, after staging a robust 44% bottom line CAGR (IKEA’s net profit stood at EUR18.40mn in 2006). We look for mid single-digitgrowth for wholesale revenues (electric/electronic devices) and a thin 1.3% net profit margin, while we expect Intersport to increase sales and netprofits to EUR79.85mn and EUR5.96mn (net profit margin of 7.5%) respectively.From 2009 onwards, we expect <strong>Fourlis</strong> to roll out another 4 IKEA stores (2 in Bulgaria, 1 in Athens and 1 more in one of Greece’s provinces) andmaintain its growth stimuli. We look for a 2009f-2012f group EPS CAGR of 20%. In all, group EPS should rise by a 27% CAGR over 2006-2012f,with risk lying on the upside given a conservative set of assumptions on the turnover and the operating margins of the new IKEA stores.<strong>Fourlis</strong>' IKEA franchiseEUR mn FY05 FY06 FY07e FY08f FY09f FY10f FY11f FY12fTarget Population1st IKEA in Thessaloniki, Greece (4Q2001) 1.50 1.50 1.50 1.50 1.50 1.50 1.50 1.502nd IKEA in Athens, East (2Q2004) 5.00 5.00 5.00 5.00 5.00 5.00 5.00 5.003rd IKEA in Nicosia, Cyprus (3Q2007) 1.10 1.10 1.10 1.10 1.10 1.104th IKEA in Athens, West (4Q2007)5th IKEA in Giannena, Greece (4Q2008) 0.75 0.75 0.75 0.75 0.756th IKEA in Sofia, Bulgaria (4Q2008) 1.50 1.50 1.50 1.50 1.507th IKEA in Larisa, Greece (1Q2009) 0.75 0.75 0.75 0.758th IKEA in Crete, Greece (4Q2009) 0.70 0.70 0.70 0.709th IKEA /2nd in Bulgaria (1Q2010) 1.00 1.00 1.0010th IKEA /3rd in Athens (4Q2010)11th IKEA /3rd in Bulgaria (4Q2011) 1.00 1.0012th IKEA /4th in Greek province (4Q2011) 0.70 0.70Target Population (mn) 6.50 6.50 7.60 9.85 11.30 12.30 14.00 14.00y-o-y 0% 0% 17% 30% 15% 9% 14% 0%Visitors*1st IKEA in Thessaloniki, Greece (4Q2001) 1.63 1.76 1.92 1.94 1.97 1.97 1.97 1.972nd IKEA in Athens, East (2Q2004) 2.27 2.46 2.77 1.93 1.93 1.93 1.93 1.933rd IKEA in Nicosia, Cyprus (3Q2007) 1.00 1.00 1.06 1.08 1.10 1.124th IKEA in Athens, West (4Q2007) 3.68 2.36 2.54 2.71 1.93 1.935th IKEA in Giannena, Greece (4Q2008) 0.79 0.87 0.95 0.98 1.026th IKEA in Sofia, Bulgaria (4Q2008) 1.58 1.73 1.89 1.97 2.057th IKEA in Larisa, Greece (1Q2009) 0.79 0.87 0.95 0.988th IKEA in Crete, Greece (4Q2009) 0.74 0.77 0.81 0.859th IKEA /2nd in Bulgaria (1Q2010) 1.05 1.16 1.2610th IKEA /3rd in Athens (4Q2010) 1.93 1.93 1.9311th IKEA /3rd in Bulgaria (4Q2011) 1.05 1.1612th IKEA /4th in Greek province (4Q2011) 0.74 0.77Visitors (mn) 3.90 4.22 9.36 9.59 11.61 15.13 16.49 16.95y-o-y 22% 8% 122% 3% 21% 30% 9% 3%*annualizedPenetration*1st IKEA in Thessaloniki, Greece (4Q2001) 31.1% 33.6% 36.5% 37.0% 37.5% 37.5% 37.5% 37.5%2nd IKEA in Athens, East (2Q2004) 13.0% 14.0% 15.8% 11.0% 11.0% 11.0% 11.0% 11.0%3rd IKEA in Nicosia, Cyprus (3Q2007) 26.0% 26.0% 27.5% 28.0% 28.5% 29.0%4th IKEA in Athens, West (4Q2007) 21.0% 13.5% 14.5% 15.5% 11.0% 11.0%5th IKEA in Giannena, Greece (4Q2008) 30.0% 33.0% 36.0% 37.5% 39.0%6th IKEA in Sofia, Bulgaria (4Q2008) 30.0% 33.0% 36.0% 37.5% 39.0%7th IKEA in Larisa, Greece (1Q2009) 30.0% 33.0% 36.0% 37.5%8th IKEA in Crete, Greece (4Q2009) 30.0% 31.5% 33.0% 34.5%9th IKEA /2nd in Bulgaria (1Q2010) 30.0% 33.0% 36.0%10th IKEA /3rd in Athens (4Q2010) 11.0% 11.0% 11.0%11th IKEA /3rd in Bulgaria (4Q2011) 30.0% 33.0%12th IKEA /4th in Greek province (4Q2011) 30.0% 31.5%Penetration 17.1% 18.5% 35.2% 27.8% 29.4% 35.2% 33.6% 34.6%*penetration is calculated on 3.5 visits per annumPlease read important disclosures at the end of the report Page 4
Piraeus Securities<strong>Fourlis</strong><strong>Fourlis</strong>' IKEA franchise (continued)EUR mn FY05 FY06 FY07e FY08f FY09f FY10f FY11f FY12fCustomers1st IKEA in Thessaloniki, Greece (4Q2001) 0.79 0.86 0.96 0.98 1.00 1.00 1.00 1.002nd IKEA in Athens, East (2Q2004) 1.20 1.32 1.49 1.03 1.03 1.03 1.03 1.033rd IKEA in Nicosia, Cyprus (3Q2007) 0.50 0.45 0.50 0.52 0.53 0.554th IKEA in Athens, West (4Q2007) 1.84 1.18 1.29 1.38 0.98 0.985th IKEA in Giannena, Greece (4Q2008) 0.39 0.44 0.49 0.51 0.536th IKEA in Sofia, Bulgaria (4Q2008) 0.79 0.88 0.98 1.02 1.067th IKEA in Larisa, Greece (1Q2009) 0.39 0.44 0.49 0.518th IKEA in Crete, Greece (4Q2009) 0.37 0.39 0.40 0.429th IKEA /2nd in Bulgaria (1Q2010) 0.53 0.59 0.6610th IKEA /3rd in Athens (4Q2010) 0.96 0.96 1.0011th IKEA /3rd in Bulgaria (4Q2011) 0.53 0.5912th IKEA /4th in Greek province (4Q2011) 0.37 0.39Customers (mn) 1.99 2.18 4.78 4.83 5.92 7.73 8.43 8.73y-o-y 26% 9% 120% 1% 23% 31% 9% 4%Conversion ratio 51.1% 51.6% 51.1% 50.3% 51.0% 51.1% 51.1% 51.5%Average Basket1st IKEA in Thessaloniki, Greece (4Q2001) 70.00 72.17 74.70 77.31 80.02 82.82 85.71 88.712nd IKEA in Athens, East (2Q2004) 100.01 103.01 106.61 110.34 114.21 118.20 122.34 126.623rd IKEA in Nicosia, Cyprus (3Q2007) 122.61 121.38 125.63 130.02 134.58 139.294th IKEA in Athens, West (4Q2007) 101.28 104.83 108.50 112.29 116.22 120.295th IKEA in Giannena, Greece (4Q2008) 77.31 80.02 82.82 85.71 88.716th IKEA in Sofia, Bulgaria (4Q2008) 38.65 40.01 41.41 42.86 44.367th IKEA in Larisa, Greece (1Q2009) 80.02 82.82 85.71 88.718th IKEA in Crete, Greece (4Q2009) 97.65 101.06 104.60 108.269th IKEA /2nd in Bulgaria (1Q2010) 41.41 42.86 44.3610th IKEA /3rd in Athens (4Q2010) 112.29 116.22 120.2911th IKEA /3rd in Bulgaria (4Q2011) 42.86 44.3612th IKEA /4th in Greek province (4Q2011) 77.14 79.84Average Basket (EUR/customer)* 89.63 92.22 56.32 78.95 86.53 80.95 85.69 93.39y-o-y 12% 3% -39% 40% 10% -6% 6% 9%*includes total revenues per customer (including money spent in the IKEA restaurants)Effective sales surface1st IKEA in Thessaloniki, Greece (4Q2001) 20,000 20,000 20,000 20,000 20,000 20,000 20,000 20,0002nd IKEA in Athens, East (2Q2004) 25,000 25,000 25,000 25,000 25,000 25,000 25,000 25,0003rd IKEA in Nicosia, Cyprus (3Q2007) 7,667 23,000 23,000 23,000 23,000 23,0004th IKEA in Athens, West (4Q2007) 2,083 25,000 25,000 25,000 25,000 25,0005th IKEA in Giannena, Greece (4Q2008) 2,250 18,000 18,000 18,000 18,0006th IKEA in Sofia, Bulgaria (4Q2008) 3,125 25,000 25,000 25,000 25,0007th IKEA in Larisa, Greece (1Q2009) 16,500 18,000 18,000 18,0008th IKEA in Crete, Greece (4Q2009) 2,250 18,000 18,000 18,0009th IKEA /2nd in Bulgaria (1Q2010) 22,917 25,000 25,00010th IKEA /3rd in Athens (4Q2010) 3,125 25,000 25,00011th IKEA /3rd in Bulgaria (4Q2011) 3,125 25,00012th IKEA /4th in Greek province (4Q2011) 2,250 18,000Effective sales surface 45,000 45,000 54,750 98,375 154,750 198,042 227,375 265,000y-o-y 16% 0% 22% 80% 57% 28% 15% 17%Please read important disclosures at the end of the report Page 5
Piraeus Securities<strong>Fourlis</strong><strong>Fourlis</strong>' IKEA franchise (continued)EUR mn FY05 FY06 FY07e FY08f FY09f FY10f FY11f FY12fSales1st IKEA in Thessaloniki, Greece (4Q2001) 56.22 63.00 72.56 76.83 81.34 84.15 87.06 90.072nd IKEA in Athens, East (2Q2004) 122.38 137.86 160.34 116.09 120.09 124.22 128.50 132.923rd IKEA in Nicosia, Cyprus (3Q2007) 0.00 0.00 20.79 55.68 64.18 68.28 72.62 77.204th IKEA in Athens, West (4Q2007) 0.00 0.00 15.59 124.83 141.41 156.34 115.10 119.105th IKEA in Giannena, Greece (4Q2008) 0.00 0.00 0.00 3.87 35.85 41.20 44.38 47.736th IKEA in Sofia, Bulgaria (4Q2008) 0.00 0.00 0.00 3.84 35.65 41.00 44.18 47.537th IKEA in Larisa, Greece (1Q2009) 0.00 0.00 0.00 0.00 29.34 37.09 42.62 45.918th IKEA in Crete, Greece (4Q2009) 0.00 0.00 0.00 0.00 4.55 39.50 42.79 46.259th IKEA /2nd in Bulgaria (1Q2010) 0.00 0.00 0.00 0.00 0.00 20.20 25.55 29.3610th IKEA /3rd in Athens (4Q2010) 0.00 0.00 0.00 0.00 0.00 13.64 112.87 121.4111th IKEA /3rd in Bulgaria (4Q2011) 0.00 0.00 0.00 0.00 0.00 0.00 2.85 26.4312th IKEA /4th in Greek province (4Q2011) 0.00 0.00 0.00 0.00 0.00 0.00 3.61 31.31IKEA sales 178.60 200.86 269.28 381.14 512.40 625.61 722.10 815.23y-o-y 42% 12% 34% 42% 34% 22% 15% 13%Same stores sales 178.60 200.86 232.90 373.43 478.51 591.77 715.64 815.23Same stores sales growth 262% 12% 16% 60% 28% 24% 21% 14%EBITDA1st IKEA in Thessaloniki, Greece (4Q2001) 11.81 13.23 15.24 16.14 17.08 17.67 18.28 18.912nd IKEA in Athens, East (2Q2004) 23.05 26.77 31.13 22.54 23.32 24.12 24.95 25.813rd IKEA in Nicosia, Cyprus (3Q2007) 0.00 0.00 3.95 10.58 12.19 12.97 13.80 14.674th IKEA in Athens, West (4Q2007) 0.00 0.00 2.49 19.97 22.63 25.02 18.42 19.065th IKEA in Giannena, Greece (4Q2008) 0.00 0.00 0.00 0.73 6.81 7.83 8.43 9.076th IKEA in Sofia, Bulgaria (4Q2008) 0.00 0.00 0.00 0.58 5.35 6.15 6.63 7.137th IKEA in Larisa, Greece (1Q2009) 0.00 0.00 0.00 0.00 5.57 7.05 8.10 8.728th IKEA in Crete, Greece (4Q2009) 0.00 0.00 0.00 0.00 0.86 7.50 8.13 8.799th IKEA /2nd in Bulgaria (1Q2010) 0.00 0.00 0.00 0.00 0.00 3.03 3.83 4.4010th IKEA /3rd in Athens (4Q2010) 0.00 0.00 0.00 0.00 0.00 2.18 18.06 19.4311th IKEA /3rd in Bulgaria (4Q2011) 0.00 0.00 0.00 0.00 0.00 0.00 0.43 3.9612th IKEA /4th in Greek province (4Q2011) 0.00 0.00 0.00 0.00 0.00 0.00 0.69 5.95IKEA EBITDA 34.85 40.00 43.81 64.54 87.81 107.52 123.73 145.90y-o-y 76% 15% 10% 47% 36% 22% 15% 18%Start-up costs 0.00 0.70 9.00 6.00 6.00 6.00 6.00 0.00IKEA EBITDA ex-start up costs 34.85 40.70 52.81 70.54 93.81 113.52 129.73 145.90EBITDA margin1st IKEA in Thessaloniki, Greece (4Q2001) 21% 21% 21% 21% 21% 21% 21% 21%2nd IKEA in Athens, East (2Q2004) 19% 19% 19% 19% 19% 19% 19% 19%3rd IKEA in Nicosia, Cyprus (3Q2007) 19% 19% 19% 19% 19% 19%4th IKEA in Athens, West (4Q2007) 16% 16% 16% 16% 16% 16%5th IKEA in Giannena, Greece (4Q2008) 19% 19% 19% 19% 19%6th IKEA in Sofia, Bulgaria (4Q2008) 15% 15% 15% 15% 15%7th IKEA in Larisa, Greece (1Q2009) 19% 19% 19% 19%8th IKEA in Crete, Greece (4Q2009) 19% 19% 19% 19%9th IKEA /2nd in Bulgaria (1Q2010) 15% 15% 15%10th IKEA /3rd in Athens (4Q2010) 16% 16% 16%11th IKEA /3rd in Bulgaria (4Q2011) 15% 15%12th IKEA /4th in Greek province (4Q2011) 19% 19%IKEA EBITDA margin 19.5% 19.9% 16.3% 16.9% 17.1% 17.2% 17.1% 17.9%IKEA EBITDA margin ex-start up costs 19.5% 20.3% 19.6% 18.5% 18.3% 18.1% 18.0% 17.9%Please read important disclosures at the end of the report Page 6
Piraeus Securities<strong>Fourlis</strong>ValuationWe value <strong>Fourlis</strong> through a sum-of-the-parts model, separately accounting for the group’s: a) IKEA franchise, b) wholesale activities, c) Intersportbrand license, d) parent activities, e) land in Piraeus Avenue (previously targeted to ‘host’ the second IKEA store in Athens), and, f) remainingstake in Kotsovolos (10%).Our notional fair value for the group stands at EUR24.20 per share and together with the expected dividend distributions suggests a total expectedreturn of 15.4%. We believe that <strong>Fourlis</strong> will continue to outperform the market and thus reinstate an <strong>Outperform</strong> medium-term rating on the stock.Apart from being the only listed franchisee of the Swedish IKEA globally, we consider that <strong>Fourlis</strong> portrays high visibility on earnings and a uniquegrowth outlook. Moreover, we consider risk on our estimates and valuation lying on the upside (we are below consensus estimates) – especially inthe longer-term horizon (above consensus at the moment).<strong>Fourlis</strong> Group, Sum-of-the-Parts Valuation ModelEquity Value Value/Share ValuationPart EUR mn % of total EUR MethodIKEA 1,063.89 86.29% 20.88 DCFWholesale 38.57 3.13% 0.76 10x 2008f EPSIntersport 83.78 6.80% 1.64 2007 PEG of 1.0Parent -5.21 -0.42% -0.10 Net debt & OpExReal estate (land) 29.55 2.40% 0.58 Book value10% stake in Kotsovolos 22.30 1.81% 0.44 based on last trancheImplied fair value 1232.88 100.00% 24.20No. of shares 50.95Current price (EUR) 21.44Upside 12.9%2006 Dividend yield 1.5%2007 Dividend yield 1.0%Total expected return 15.4%Source: Piraeus Sec.IKEAOn our estimates, IKEA accounts for 86% of the group’s valuation. We value IKEA through a DCF model with explicit forecasts up to 2012f and aperpetuity stage. On a total of 12 IKEA stores by end 2011 in Greece (8), Cyprus (1) and Bulgaria (3), we expect the IKEA franchise to post a 31%EPS CAGR over 2006-2012f. We discount IKEA’s FCFF with a WACC of 8.50% on a beta of 1.0x, a market risk premium of 7.0% (high enough toaccount for execution risks relating to new store rollouts) and a risk free rate of 4.0%. We apply a target debt/equity ratio of 35%/65%. To err onthe conservative side, we assume 0% growth going forward to perpetuity.IKEA franchise - DCF Valuation ModelEUR mn FY05 FY06 FY07e FY08f FY09f FY10f FY11f FY12fSales 178.60 200.86 269.28 381.14 512.40 625.61 722.10 815.23EBIT 30.19 35.52 38.87 56.40 77.74 96.83 111.07 132.97EBIT margin 16.9% 17.7% 14.4% 14.8% 15.2% 15.5% 15.4% 16.3%Depreciation 4.66 4.47 4.95 8.14 10.08 10.68 12.66 12.93Working capital change -9.24 -4.65 3.26 0.56 0.84 0.80 0.57 0.69Tax paid -3.03 -15.24 -9.66 -8.35 -11.61 -16.59 -24.77 -24.19CAPEX 0.06 -2.73 -39.00 -84.00 -21.45 -16.00 -52.00 -7.00FCFF 22.64 17.37 -1.59 -27.25 55.58 75.73 47.53 115.39Discounted Free Cash Flows 51.23 64.33 37.21 83.27PV of Free Cash Flows 236.03PV of Horizon Value 979.60Enterprise Value 1,215.63Minus:Minorities -0.07PV of additional minorities (Bulgaria) 51.27Net debt 84.03PV of additional debt (Bulgaria) 19.46Plus:Non-core assets 2.95Equity value 1,063.89 …. or EUR 20.88 per <strong>Fourlis</strong>' shareImplied P/E 31.40 21.60 16.91 14.80 12.24Implied PEG 0.69 0.78 1.19 0.71Source: Piraeus Sec.Please read important disclosures at the end of the report Page 7
Piraeus Securities<strong>Fourlis</strong>Perhaps the major risk concerning <strong>Fourlis</strong> investment case relates to the loss of the license to operate IKEA stores in Greece and Cyprus. It is ourunderstanding that <strong>Fourlis</strong>’ license is valid for at least 10 years from the opening of each store. We believe that the aforementioned risk is bothremote at this stage and also small given the success of <strong>Fourlis</strong> in managing the license, as well as, IKEA franchisee/franchisor relations in othercountries. The risk is further reduced by the new shareholding agreement between <strong>Fourlis</strong> and IKEA in Bulgaria. We therefore believe that there isterminal value for <strong>Fourlis</strong>’ IKEA franchise and we choose to prudently estimate it on a 0% perpetuity growth rate. On our new estimates, IKEA isworth EUR1,062.62mn or EUR20.85 per <strong>Fourlis</strong>’ share.Electrics/electronics wholesale & IntersportWe value the wholesale business using a spot market 2008f P/E multiple of 10.0x. We value Intersport at a target 2007e PEG of 1.0. Note thatthe value of Intersport’s operations in the Balkans is no longer included under the wholesale division, since <strong>Fourlis</strong> reports them under Intersportas of the start of 2006.Based on company guidance, Intersport is targeted to achieve total sales of EUR100.00mn in the next couple of years and operate on an EBTmargin of 10%. Our current estimates call for 2008f Intersport sales of EUR69.73mn (including Bulgaria, Romania, and Cyprus) and an EBTmargin of 9.2%.Non core assetsWe value <strong>Fourlis</strong>’ real estate at cost (EUR29.55mn) – no capital gains to arise, and the remaining 10% stake in Kotsovolos at the price capturedfor the stake sold in 2Q07 (EUR22.30mn). Given that <strong>Fourlis</strong> has the option to sell the stake in September 2008 and that the price will bedetermined on 2007 performance, we believe there is upside risk on our targeted price (Kotsovolos’ performance is quite strong y-t-d). Weestimate the total capital gains to be booked in FY08 and FY09 at EUR10.71mn and EUR7.01mn respectively (as it was the case with theprevious stake sale in FY06 and FY07). Finally, we subtract from the group’s equity value EUR5.21mn to account for the parent company’s netdebt and operating expenses.Risks on our estimates and valuationOur earnings and cash flow estimates (hence the notional fair value of the group) are subject to industry/sector specific risks, financial, economic,political, management and execution risks.We highlight the following major risks for <strong>Fourlis</strong>:• Losing the IKEA license• Keeping the license on worse terms (regarding procurement of merchandise and royalties on sales)• Delaying the rollout of new IKEA stores or failing to get respective building permits at all• Further margin erosion in wholesale operations• Tax charges on previous fiscal years• Working capital overshootingPotential for further earnings upgradesSigns of continuing strength in IKEA performance (rising sales and improving margins), a transformation of the athletics retail andelectric/electronic equipment wholesale activities, as well as faster introduction of new (let alone more) IKEA stores would justify further earningsupgrades and higher valuation for the group, in our view. New business ventures and/or licensing agreements could be the major catalysts in themedium term.Please read important disclosures at the end of the report Page 8
Piraeus Securities<strong>Fourlis</strong>Financial Statements<strong>Fourlis</strong> Group, Profit & Loss Statements<strong>Fourlis</strong> Group, Cash Flow StatementsEUR mn 2005 2006 2007e 2008f 2009f EUR mn 2005 2006 2007e 2008f 2009fSales 407.52 482.05 600.07 736.77 892.44 EBT 28.55 47.90 49.61 70.10 90.14COGS 282.52 339.93 418.34 500.48 600.28 Depreciation 7.03 7.06 7.65 11.14 13.36Gross profit 124.99 142.12 181.72 236.28 292.16 Other non-cash items 5.27 -7.90 0.00 0.00 0.00Gross margin 30.7% 29.5% 30.3% 32.1% 32.7% Tax paid -6.17 -16.90 -16.57 -13.99 -18.43Other OpEx 89.19 89.08 125.90 157.51 194.01 Cash earnings 34.67 30.15 40.69 67.25 85.06EBIT 35.81 53.05 55.83 78.77 98.15 Working capital -64.89 -11.22 -19.44 -23.56 -26.08EBIT margin 8.8% 11.0% 9.3% 10.7% 11.0% % of sales -15.9% -2.3% -3.2% -3.2% -2.9%Depreciation 7.03 7.06 7.65 11.14 13.36 Operating cash flows -30.22 18.93 21.24 43.69 58.98EBITDA 42.83 60.10 63.47 89.91 111.51 CAPEX -3.11 -12.94 -42.00 -87.00 -54.00EBITDA margin 10.5% 12.5% 10.6% 12.2% 12.5% Proceeds from asset sales 1.44 0.62 22.30 22.30 29.55Financial income/(expense) -7.26 -5.15 -6.22 -8.67 -8.01 FCFE -31.88 6.61 1.54 -21.01 34.53EBT 28.55 47.90 49.61 70.10 90.14 FCFE yield -8.9% 1.1% 0.1% -1.9% 3.2%EBT margin 7.0% 9.9% 8.3% 9.5% 10.1% New debt 12.63 18.21 7.22 55.22 -21.78Tax 10.31 20.62 11.89 16.42 20.75 New capital 0.00 0.00 0.00 0.00 0.00Minorities 0.13 -0.16 -0.16 -0.23 0.99 Shares bought-back 0.00 0.00 0.00 0.00 0.00Net profit 18.11 27.43 37.88 53.91 68.40 Dividend paid -5.27 -7.67 -9.17 -11.29 -15.80Net margin 4.4% 5.7% 6.3% 7.3% 7.7% Net change in cash -24.52 17.15 -0.41 22.92 -3.05EPS 0.36 0.54 0.74 1.06 1.34 Cash, beginning 32.91 8.40 25.54 25.14 48.06DPS 0.15 0.18 0.22 0.31 0.44 Cash, end 8.40 25.54 25.14 48.06 45.02'Clean' EPS 0.36 0.49 0.61 0.85 1.20 Cash per share (EUR) 0.16 0.50 0.49 0.94 0.88<strong>Fourlis</strong> Group, Ratio analysis<strong>Fourlis</strong> Group, Balance SheetsEUR mn 2005 2006 2007e 2008f 2009f EUR mn 2005 2006 2007e 2008f 2009fShare price (EUR)1 7.01 12.13 21.44 21.44 21.44 Fixed assets 139.78 155.75 180.10 245.96 257.06Market Cap. 357.25 618.14 1,092.43 1,092.43 1,092.43 Participations 0.50 1.08 1.08 1.08 1.08Target Price 24.20 24.20 24.20 24.20 24.20 Other long term receivables 7.70 7.80 7.80 7.80 7.80Target Cap. 1,232.88 1,232.88 1,232.88 1,232.88 1,232.88 Total fixed assets 147.98 164.63 188.98 254.84 265.94P/E (x) 19.6x 24.6x 35.4x 25.3x 17.8x Inventory 76.13 73.00 89.84 107.47 128.90P/E on TP (x) 67.6x 49.1x 39.9x 28.5x 20.1x Trade receivables 63.29 79.23 98.62 121.09 146.67'Clean' EPS growth (%) 148.6% 37.5% 23.1% 40.0% 42.1% Other receivables 35.14 44.07 53.49 64.40 76.82PEG 0.52 1.07 0.89 0.60 0.64 Cash & cash equivalents 8.40 25.54 25.14 48.06 45.02PEG on Target Price 1.80 2.13 1.00 0.68 0.73 Total assets 330.94 386.47 456.06 595.86 663.35P/BV (x) 3.8x 5.4x 7.0x 5.2x 4.2x Share capital 50.95 50.95 50.95 50.95 50.95P/CE (x) 14.1x 19.2x 28.4x 20.1x 14.6x Reserves 43.02 63.11 104.12 159.04 211.64P/FCFE (x) -11.2x 93.5x 708.0x -52.0x 31.6x Shareholders funds 93.97 114.07 155.07 209.99 262.59EV/EBITDA (x) 11.0x 14.8x 21.5x 15.8x 11.8x Minority rights 0.38 0.13 -0.02 -0.25 0.74EV/Sales (x) 1.2x 1.5x 2.0x 1.7x 1.4x Total equity 94.35 114.20 155.05 209.74 263.33RoCE 11.1% 12.3% 12.6% 13.5% 17.1% Long term debt 61.05 103.41 110.63 166.85 145.08RoIC 13.6% 15.7% 14.7% 14.7% 17.1% Other long term liabilities 3.28 6.56 6.56 6.56 6.56RoE 19.4% 22.0% 19.9% 20.6% 23.4% Short term debt 60.74 37.65 37.65 36.65 36.65g 11.2% 14.6% 14.0% 14.5% 15.7% Trade payables 104.05 113.61 139.81 167.26 200.62RoA 5.5% 6.5% 6.8% 7.3% 9.3% Other payables 7.48 11.05 6.37 8.80 11.12Earnings yield 5.1% 4.1% 2.8% 4.0% 5.6% Total liabilities 236.59 272.27 301.02 386.12 400.02FCFE Yield -8.9% 1.1% 0.1% -1.9% 3.2% Total liabilities & equity 330.94 386.47 456.07 595.86 663.35Dividend Yield 2.1% 1.5% 1.0% 1.4% 2.1% Net fixed assets 106.47 108.52 142.88 218.74 259.38Spread -11.1% -0.4% -0.9% -3.4% 1.1% Working capital 63.05 71.64 95.76 116.90 140.66Net debt to equity (x) 1.20x 1.01x 0.79x 0.74x 0.52x Invested capital 169.51 180.16 238.64 335.63 400.04Net debt to market cap. (x) 0.32x 0.19x 0.11x 0.14x 0.13x Plus: Assets for sale 38.23 49.55 39.55 29.55 0.00Net Debt/ EBITDA (x) 2.65x 2.34x 2.18x 1.96x 1.31x Net debt 113.39 115.52 123.14 155.44 136.71Interest charge coverage (x) 4.9x 7.7x 7.5x 7.6x 10.9x Equity 94.35 114.20 155.05 209.74 263.33Average prices are used for previous fiscal years - Ratios are calculated on 'clean' figuresPlease read important disclosures at the end of the report Page 9
Piraeus Securities<strong>Fourlis</strong>IMPORTANT DISCLOSURESPiraeus Securities S.A. is the brokerage division of Piraeus Bank (‘The Firm’), which does and seeks to do business with companies covered in its researchreports. As a result, investors should be aware that the Firm may have a conflict of interest that could affect the objectivity of this report. Investors shouldconsider this report as only a single factor in making their investment decision. Piraeus Securities S.A. certifies that the current organizational andadministrative structure is proof of conflicts of interest and dissemination of any kind of information between the departments and also certifies that it does notrelate to any kind of interest or conflict of interest with a) any other legal entity or person that might participate in the preparation of this research report and b)with any other legal entity or person that might not participate in the preparation of this research report but had access to the research report before itspublication.Piraeus Securities seeks to update covered companies on a quarterly basis or else on any material upcoming events.ANALYST CERTIFIC<strong>AT</strong>ION: The analyst identified in this report certifies that his/her views about the company/ies and securities analysed in this report a)accurately reflect his/her personal views and b) do not directly or indirectly relate to any kind of compensation in exchange for specific recommendations orviews.Piraeus Securities Research StockRatingsCoverageUniverseRating DefinitionsInvestment Banking Activities within12-month period<strong>Outperform</strong> : 61.4%Total return (*) expected to be greater than 10%compared to the market’s return (**) over a 12--month periodNeutral: 25.6%Total return (*) expected to be between -10%/+10%compared to the market’s return (**) over a 12--month periodUnderperform: 1.0%Total return (*) expected to be below -10%compared to the market’s return (**)over a 12--month periodRestricted: 5.8%In certain circumstances that Piraeus SecuritiesS.A. policy or applicable law / regulations precludecertain types of communication and investment-recommendationsUnder Review: 6.1% Rating/TP may be subject to future revision -(*) Total return = Price appreciation + Dividend(**) Market return = Risk free rate + 5% (an approximation of equity risk premium)Investment ratings are determined by the ranges described above at the time of initiation of coverage, a change in rating, or a change in target price. At othertimes, the expected total returns may fall outside of these ranges because of price movement and/or volatility. Such interim deviations from specified rangeswill be permitted but will become subject to review by Research Management.RESEARCH piraeus.securities@piraeus-sec.gr +30 210 3354035Natasha RoumantziGeorge MinardosIoannis ArapoglouPantelis VoutirakisGeorge DoukasSALES/ TRADINGGeorge LinatsasThanos AdamantopoulosKostis NikolaidisConstantinos KoufopoulosMaria Mitsoulinroumantzi@piraeus-sec.grminardos.george@piraeus-sec.grioannis.arapoglou@piraeus-sec.grpantelis.voutirakis@piraeus-sec.grgdoukas@piraeus-sec.grglinatsas@piraeus-sec.grt.adamantopoulos@piraeus-sec.grconstantine.nicolaidis@piraeus-sec.grckoufopoulos@piraeus-sec.grmmitsouli@piraeus-sec.gr+30 210 3354354+30 210 3354083+30 210 3354367+30 210 3354049+30 210 3354093+30 210 3354144+30 210 3354238+30 210 3354336+30 210 3354042+30 210 3354234CAUTION - DISCLAIMER This document has been issued by Piraeus Securities S.A. (“Piraeus Securities”), a member of the Athens Exchange supervised by the Hellenic CapitalMarket Committee. Piraeus Securities has based this document on information obtained from sources it believes to be reliable, but it has not independently verified all theinformation presented in this document. Accordingly, no representation or warranty, express or otherwise implied, is made as to the fairness, accuracy,completeness, or correctness of the information and opinions contained in this document, or otherwise arising in connection therewith. Expressions of opinionherein are those of the Research Department only and are subject to change without notice. This document does not constitute or form part of any offer for sale or subscription, or solicitation to buy or subscribe to any securities, nor shall it or anypart of it form the basis of, in part or in whole, any contract or commitment whatsoever. This document was produced by the Research Department of Piraeus Securities and is for distribution only to persons of the kind described in Article II (3)of the financial Services Act 1986 (Investment Advertisements) (Exemptions) Order 1996. It is being supplied to you solely for your information, and may notbe reproduced, redistributed or passed on to any other person, or published, in whole or in part, for any purpose. Additional note to our U.S. readers: This document may be distributed in the United States solely to “major US institutional investors” as defined in Rule15a-6 under the US Securities Exchange Act of 1934. Each person that receives a copy, by acceptance thereof, represents and agrees that he/she will notdistribute or otherwise make available this document to any other person. The distribution of this document in other jurisdictions may be restricted by law, and persons who come into possession of this document should informthemselves about and observe any such restrictions.Please read important disclosures at the end of the report Page 10