Enzyme Action: Testing Catalase Activity - Vernier Software ...
Enzyme Action: Testing Catalase Activity - Vernier Software ...
Enzyme Action: Testing Catalase Activity - Vernier Software ...

Create successful ePaper yourself
Turn your PDF publications into a flip-book with our unique Google optimized e-Paper software.
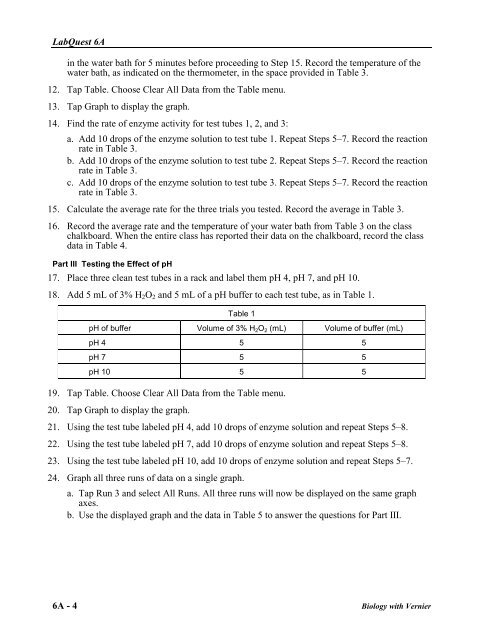
LabQuest 6Ain the water bath for 5 minutes before proceeding to Step 15. Record the temperature of thewater bath, as indicated on the thermometer, in the space provided in Table 3.12. Tap Table. Choose Clear All Data from the Table menu.13. Tap Graph to display the graph.14. Find the rate of enzyme activity for test tubes 1, 2, and 3:a. Add 10 drops of the enzyme solution to test tube 1. Repeat Steps 5–7. Record the reactionrate in Table 3.b. Add 10 drops of the enzyme solution to test tube 2. Repeat Steps 5–7. Record the reactionrate in Table 3.c. Add 10 drops of the enzyme solution to test tube 3. Repeat Steps 5–7. Record the reactionrate in Table 3.15. Calculate the average rate for the three trials you tested. Record the average in Table 3.16. Record the average rate and the temperature of your water bath from Table 3 on the classchalkboard. When the entire class has reported their data on the chalkboard, record the classdata in Table 4.Part III <strong>Testing</strong> the Effect of pH17. Place three clean test tubes in a rack and label them pH 4, pH 7, and pH 10.18. Add 5 mL of 3% H 2 O 2 and 5 mL of a pH buffer to each test tube, as in Table 1.Table 1pH of buffer Volume of 3% H 2 O 2 (mL) Volume of buffer (mL)pH 4 5 5pH 7 5 5pH 10 5 519. Tap Table. Choose Clear All Data from the Table menu.20. Tap Graph to display the graph.21. Using the test tube labeled pH 4, add 10 drops of enzyme solution and repeat Steps 5–8.22. Using the test tube labeled pH 7, add 10 drops of enzyme solution and repeat Steps 5–8.23. Using the test tube labeled pH 10, add 10 drops of enzyme solution and repeat Steps 5–7.24. Graph all three runs of data on a single graph.a. Tap Run 3 and select All Runs. All three runs will now be displayed on the same graphaxes.b. Use the displayed graph and the data in Table 5 to answer the questions for Part III.6A - 4Biology with <strong>Vernier</strong>