OFFERING MEMORANDUM - REDI-net.com
OFFERING MEMORANDUM - REDI-net.com
OFFERING MEMORANDUM - REDI-net.com

Create successful ePaper yourself
Turn your PDF publications into a flip-book with our unique Google optimized e-Paper software.
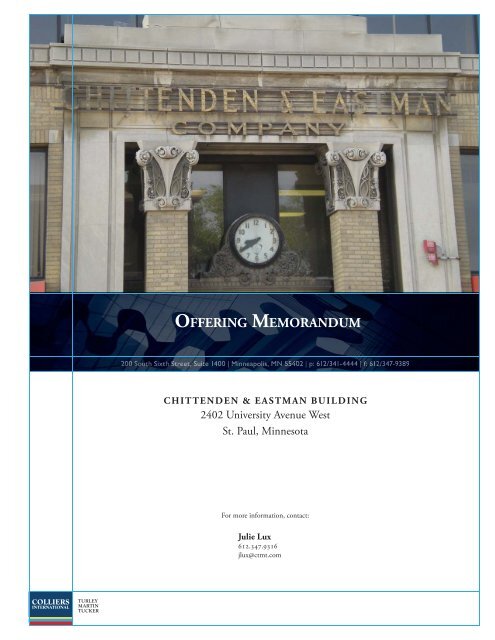
EXECUTIVE SUMMARY2402 University Ave.St. Paul, MNThe Minneapolis office of Colliers Turley Martin Tucker (Colliers) is pleased present this purchaseopportunity for the Chittenden & Eastman Building located at 2402-2414 University Avenue Westlocated just west of the Raymond Avenue LRT station on the Central Corridor Line in Saint Paul,Minnesota (Subject Property).The Central Corridor Light Rail Transit Project will link downtown St. Paul and downtown Minneapolisalong Washington and University avenues via the state Capitol and University of Minnesota.Construction will begin in 2010 on the planned 11-mile Central Corridor line, with service beginning in2014. The line will connect with the Hiawatha LRT line at the Metrodome station in Minneapolis and thesoon-to be opened Northstar <strong>com</strong>muter rail line at the new Minneapolis Multimodal Station.
EXECUTIVE SUMMARY2402 University Ave.St. Paul, MNThe Opportunity• Architecturally significant historic building constructed in 1917• Located in the University-Raymond Commercial Historic District• B-3 Zoning allows for a wide variety of uses, including mixed use-multifamily and retail• All tenants are on month to month leases• On-site parking• Located steps from the Raymond Avenue LRT station• Offering Price - $3,700,000 ($28.00/sf)
PROPERTY OVERVIEW2402 University Ave.St. Paul, MNLocation Map
PROPERTY OVERVIEW2402 University Ave.St. Paul, MNAerial Photograph
PROPERTY OVERVIEW2402 University Ave.St. Paul, MN
PROPERTY OVERVIEW2402 University Ave.St. Paul, MNLocation:Building Size:Basement:Main 1 st -7 th Floors:Annex 1 st & 2 nd Floors:Total GBA:Total Above Ground:2402-2414 University Avenue WestSt. Paul, Minnesota2,000 Sq. Ft. (Approx.)114,625 Sq. Ft. (16,375 Sq. Ft./Floor)23,155 Sq. Ft. (11,577.28 Sq. Ft/Floor)139,780 Sq. Ft.137,780 Sq. Ft.The main area of the building is 164’ x 100’ in dimension, equal sizeson each floor. Two story annex on the south side of the buildingmeasures 114’ x 101’ on each floor. The basement is used only forutility and boiler room.Land:PID:47,468 Sq. Ft or 1.09 AcresMain Parcel:29-29-23-34-006229-29-23-34-006329-29-23-34-006829-29-23-34-0075Year Built:Zoning:1917 – 87 yearsB-3 (see allowed uses chart in this section)Construction: Concrete foundation, wood and concrete frame. Floor structure –wood I-beams with plywood flooring. Original wooden floors overplywood deck. Quarry tile in building entrance with concrete stairwayto second floor.Wall Heights: 12’Elevators:Utilities:Three – one passenger elevator and one freight elevator serving theseven stories. One small freight elevator serving the annex.Electric: Excel EnergyGas: Excel EnergySewer: MunicipalWater: MunicipalStorm: Municipal
PROPERTY OVERVIEW2402 University Ave.St. Paul, MNParking:Environmental Factors:Roof:Electrical:Sprinklers:HVAC:12 parking stalls on the west side of the building49 parking stalls on the south side of the building including onehandicapped stall.Phase I report has been <strong>com</strong>pleted. To the best of owner’sknowledge, all asbestos has either been removed or encapsulated.Flat roof supported by wood joists. Pitch and gravel, main roofreplaced in 1996. Annex roof age unknown.250 amp with four 100 amp boxesEntire building has sprinkler systemPartial building a/c, boiler radiant heat throughout
Sec. 66.421. Principal uses.Table 66.421, principal uses in business districts, lists all permitted and conditional usesin the OS--B5 business districts, and notes applicable development standards andconditions.Table 66.421. Principal Uses in Business DistrictsTABLE INSET:UseResidential UsesDwellingsOne-family dwellingTwo-family dwellingTownhouseMultiple-family dwellingOS B1 BC B2 B3 B4 B5 DevelopmentstandardsPPPP P P PCarriage house dwellingHousing for the elderly P P P PMixed Commercial-Residential UsesHome occupation P P P P P P PLive-work unitMixed residential and<strong>com</strong>mercial useCongregate LivingFoster home, freestandingfoster care homeCommunity residentialfacility, licensed humanserviceCommunity residentialfacility, licensedcorrectionalCommunity residentialfacility, health departmentlicensedCPP P P P P P PP P P P P P PP P P P P P PC C C C CC C C C C
Emergency housingfacilityOvernight shelterShelter for batteredpersonsTransitional housingfacilitySober houseC C C C CCP/C P/C P/C P/CP P PP/C P/C P/C P/CP P PP/C P/C P/C P/C P/C P/C P/CRoominghouse,boardinghouseNursing home, boardingcare home, assistedlivingHospice C CC P PC P PP/CC P P PDormitoryP/CPPFraternity, sororityP/CCivic and InstitutionalUsesEducational FacilitiesDay care P P P P P P PSchool, grades K-12 P P P P P P PCollege, university,seminary, etc.Trade school, arts school,dance school, etc.Social, Cultural, andRecreational FacilitiesClub, fraternalorganization, lodge hallP P P P P P PP P P P P P PP P P PMuseum P PPublic library P P P P P P P
Public and private park,playgroundRecreation,non<strong>com</strong>mercialReligious InstitutionsChurch, chapel,synagogue, place ofworshipP P P P P P PP P P P P P PP P P P P P PRectory, parsonage P P P P P P PConvent, monastery,religious retreatPublic Services andUtilitiesAntenna, cellulartelephoneElectric transformer orgas regulator substationMunicipal building orusePublic utility heating orcooling plantUtility or public servicebuildingCommercial UsesOfficesP P P P P P PP/C P/C P/C P/C P/C P/C P/CC C C P P PP P P P P P PC P P P P P PAdministrative office P P P P P P PArtist, photographerstudio, etc.P P P P P P PInsurance office, realestate office, sales office P P P P P P PPProfessional office P P P P P P PMedical FacilitiesClinic, medical or dentalP P P P P P PHospital P P P
Medical laboratory P P P P P P PVeterinary clinic P P P PRetail Sales and ServicesGeneral retail P P P P P PBank, credit union P P P P P P PBusiness sales andservicesP P PCurrency exchange C P PDrive-through sales andservices, primary andaccessoryDry cleaning, <strong>com</strong>merciallaundryFood and related goodssalesC C C P P PP P P P P PP P P P P PFood shelf P P P P P P PGarden center, outdoor C C PGreenhouseLaundromat, self-serviceP P P P P PLiquor store P P P P P PMassage center P P P P P P PMortuary, funeral home P P POutdoor uses,<strong>com</strong>mercialOutdoor uses, <strong>com</strong>mercialsales of consumerfireworksPackage delivery serviceCCCP P PPawn shop C P PPhotocopying P P P P P P PPost office P P P P P P
Service business P P P P P P PService business withshowroom or workshopP P P P PSmall appliance repair P P P PSmall engine repair,automotive bench workP P PTattoo shop P P P P PTobacco shop P P P P P PFood and BeveragesBrew on premises store P P P PCatering P P P PCoffee kiosk P P P PCoffee shop, tea houseP/CP P P PRestaurant P P P PRestaurant, carry-out,deliRestaurant, fast-foodP P P P PP/CP/CRestaurant, outdoor P P P PCommercial Recreation,Entertainment andLodgingBed and breakfastresidenceP P P PBingo hall, auction hall C P P PHealth/sports club P P P PHotel, inn, motel P P PIndoor recreation C P P PReception hall P P P PSteam room/bathhousefacilityTheater, assembly hall,concert hallP P P P PPPP P P P
Adult EntertainmentAdult use C C CAutomobile ServicesAuto convenience marketC C PAuto service station C C PAuto speciality store C C PAuto repair station C PAuto sales, indoor P P PAuto sales and rental,outdoorCar washParking FacilitiesParking facility,<strong>com</strong>mercialTransportationBus or railroad passengerstationCCPPP P PHelistop C C CRailroad right-of-way C C C C C P PLimited Production,Processing and StorageFinishing shop P PLimited production andprocessingMail order house P P P P PMalt liquormanufacturingPlastic productsPrinting and publishingPPP P P PP/CPP P PRecycling collectioncenterP
Recycling drop-offstationToiletries and cosmeticmanufacturingWarehousing and storageWholesale establishmentP P P P PPPP P PAccessory UsesAccessory use P P P P P P P(C.F. No. 05-441, § 4, 8-24-05; C.F. No. 07-633, § 2, 8-15-07; C.F. No. 07-1148, § 2, 1-9-08; C.F. No. 08-640, § 5, 7-9-08)
MARKET OVERVIEW2402 University Ave.St. Paul, MNTwin Cities Multi-Family MarketThe 2008 Twin Cities apartment market continued its decrease in vacancies for the third straight year.Overall vacancies are at 3.9%, down from 4.2% one year ago and 4.7% two years ago. Two drivingfactors for the lower vacancy rates are the continued housing struggles and lack of new construction in2008 and limited new units in the pipeline through 2011.There are several reasons why the market isn’t seeing much new construction.• To support new stick-frame construction, a developer will need to achieve rents in the$1.60/sf range, and for mid- to high-rise projects closer to $2.25/sf. Rents in the markethaven’t increased enough to justify new construction, except in high-demand urban infilllocations or in transit-oriented districts. The lack of available urban infill and well-locatedsuburban apartment sites has frustrated developers eager to meet the rental needs in thoseareas, many of which have vacancy rates in the 2 to 3% range.• Municipalities have favored “for sale” or mixed-use developments versus “rental housing”,which inspires neighborhood opposition to high-density development and hampers theentitlement process. With stabilized local occupancy and little new construction, occupancyrates should remain steady with small rental rate increases.• Year-to-date cap rates for apartments have remained stable because of the lack ofinvestment-grade multifamily product on the market and continued investor demand. Caprates for newer properties have ranged from the mid-5.0% to low-6.0%, 1990’s-vintageproperties have averaged from 6.0% to mid-6% cap rate and pre-1980 properties havemoved into the mid-6.0% to mid-7.0% cap rate range.
colliers TURLEY MARTIN TUCKER | MINNEAPOLIS-saint PAULMarket ResearchMULTI-FAMILY | first Quarter | 2009Multifamily Housing Remains a Bright SpotMinneapolisSt. PaulMarket IndicatorsQ1 09ActualQ2 09EstimatedVacancy RATE k gNet Absorption g gConstruction m mRental Rate g gsignificant transactionThe Minneapolis-Saint Paul multifamilymarket continues to outpace the nationin occupancy, rental rate stability, becauseof lack of supply in the pipeline, earningit the reputation as one of the top marketstargeted for acquisition by institutionaland private equity buyers today.Increased activity from outside investors,as well as lenders seeking investment opportunitiesin our market, should serve tomitigate cap rate increases as <strong>com</strong>pared tonational trends through the first quarterof the year.The crisis in confidence has created an environmentwhere almost everyone seems tobe waiting for the financial uncertainty tohit home, yet overall market indicators continueto be stable, albeit with some fluctuationon a year-over-year basis, especially insub-markets outside the I-494/I-694 loop.Across the market occupancy is still hoveringat 95% and, for the most part, has heldsteady since September 2007.Three trends contributing to the stabilityof the Minneapolis-Saint Paul marketare:1.2.3.The virtual halt of new developmentfor projects to be delivered in 2009and 2010 because of the lack of constructionfinancing. Most developmentsdo not make economic senseto move forward with at this time.The lack of significant shadow market<strong>com</strong>petition (ie. condo rentals) <strong>com</strong>paredto many national markets.The lack of distressed assets acrossthe metro area. Assets reflected inthe chart below.These favorable fundamentals appeal toinvestors seeking shelter from the volatilityexperienced in coastal markets, leadingthem to diversify their portfolio exposureacross the country. This has brought institutional,national, and regional private investorsback to the Midwest, particularly to thePotentially troubled & distressed assets of 12/31/08Riverview at Upper LandingSaint Paul, MNBuyer: Intercontinental Real EstateCorporationSeller: Prudential Real Estate InvestorsPrice: $126,453/UnitSize: 344 UnitsYear Built: 2005SectorUNITSSURveyedunitsvacantaverage rent Vacancy Rate VacancyChange09/07 09/08 09/07 09/08Anoka County 6,100 273 $837 $836 6.0% 4.5% -1.5%Dakota County 16,647 785 $906 $911 3.9% 4.7% 0.8%Minneapolis 15,527 553 $868 $929 2.8% 3.6% 0.8%Northeast 12,046 531 $805 $824 3.6% 4.4% 0.8%Northwest 10,699 501 $766 $802 3.6% 4.7% 1.1%Scott County 1,040 54 $940 $957 6.4% 5.2% -1.2%Saint Paul 17,711 696 $933 $954 3.2% 3.9% 0.7%Southwest 11,703 353 $860 $876 4.3% 3.0% -1.3%Washington County 4,703 252 $1,003 $1,004 4.7% 5.4% 0.7%West 17,772 726 $973 $1,003 3.7% 4.1% 0.4%Twin Cities Metro 113,212 4,673 $890 $922 3.6% 4.1% 0.5%Source: GVA Marquette AdvisorsColliers turley martin tucker 10
minneapolis-saint paul industrial MULTI-FAMILY first Quarter | 2007 2009Minneapolis - Saint Paul metro area, whichhas been identified as one of the top marketsin the country for multifamily acquisitions.Despite the local markets’ resiliency to date,continued job loss will impact multifamilyvacancy rates and rents. This could presenta problem unless the job market stabilizes.Nationally, the unemployment numbers andthe effects on vacancy track even closer together.Historically, as the graph below depicts,vacancy climbs with a decline in thenumber of jobs.The pipeline for new product is still belowaverage, yet several new projects have beenannounced since the first of the year. Withdebt markets still locked up, time will tell ifthese projects will be delivered as proposed.Much of the Minneapolis–Saint Paul metroarea’s stability is due to a diverse economicbase and a lack of new units delivered in2008 and proposed for 2009. Changes inthis area could affect performance movingforward but will likely not impact fundamentalsuntil 2010.293 offices in 61 countrieson 6 continentsAmericas 136Asia Pacific 62EMEA 95$73 billion in annualtransaction volume868 million square feetunder management11,048 ProfessionalsContact informationUnited StatesPERCENTemployment vs. vacancy rates12%10%8%6%4%2%2000 2001 2002 2003 2004 2005 2006 2007 2008National UnemploymentNational Apartment VacancySource: ColliersTwin Cities UnemploymentTwin Cities Apartment VacancySelected first Quarter multi-family Sale TransactionsProperty Name City, State units $/units Year BuiltRiverview at Upper Landings Saint Paul, MN 344 $126,453 2005Stonehill Minneapolis, MN 225 $99,111 1987Irving Place Minneapolis, MN 40 $71,250 1967740 River Drive Saint Paul, MN 163 N/A 1961Source: ColliersMinneapolis-Saint PaulColliers Turley Martin Tucker200 South Sixth StreetSuite 1400Minneapolis, MN 55402Tel: 612-341-4444Fax: 612-347-9389Researcher’s information:Jim MaylandEmail: jmayland@ctmt.<strong>com</strong>Tel: 612-347-9311Julie Lux, CCIMEmail: jlux@ctmt.<strong>com</strong>Tel: 612-347-9316Gina Dingman, CCIMEmail: gdingman@ctmt.<strong>com</strong>Tel: 612-347-9331This report and other research materials may befound on our website at www.ctmt.<strong>com</strong>. This isa research document of Colliers Turley MartinTucker – Minneapolis/St. Paul. Questions relatedto information herein should be directed to theResearch Department at 612-347-9311. Informationcontained herein has been obtained fromsources deemed reliable and no representationis made as to the accuracy thereof. As new, correctedor updated information is obtained, it isincorporated into both current and historicaldata, which may invalidate <strong>com</strong>parison to previouslyissued reports.www.ctmt.<strong>com</strong>11Colliers turley martin tuckerColliers turley martin tucker 11
MARKET OVERVIEW2402 University Ave.St. Paul, MNMultifamily Submarket AnalysisThe Chittenden & Eastman Building is located in Saint Paul, Minnesota in the Saint Anthony Parkneighborhood. The future redevelopment would be considered a Class A apartment <strong>com</strong>munity withinits <strong>com</strong>petitive market, known as the “St. Paul non-downtown” submarket.The St. Paul non-downtown rental market (specifically north of I-94) currently has a total of 2,978 units.The overall vacancy rate in this submarket as of the 2nd Quarter 2009 was 4.9%, a slightly highervacancy than the overall market vacancy rate of 6.0%. The vacancy for the entire St. Paul market iscurrently 5.3% , with an overall average rent of $863.Rents in the non-downtown St. Paul submarket have increased slightly over the past year, averaging$840, up from $824 per unit at this time last year. This is slightly lower than the overall average marketrent of $904 (entire metro area).Twin Cities Apartment Submarkets
MARKET OVERVIEW2402 University Ave.St. Paul, MNThis property as an attractive historical building located on the future Central Corridor light rail line inthe University-Raymond Commercial Historic District. The University-Raymond Commercial HistoricDistrict is significant as the <strong>com</strong>mercial core of the Saint Paul Midway, which developed in the earlytwentieth century as the city's largest industrial area and a national transportation center. Nearly all ofthe properties in the district are related to some aspect of the activities of the railroad lines betweenthe Twin Cities or the early years of the trucking industry.The Central Corridor Light Rail Transit Project will link downtown St. Paul and downtown Minneapolisalong Washington and University avenues via the state Capitol and University of Minnesota.Construction will begin in 2010 on the planned 11-mile Central Corridor line, with service beginning in2014. The line will connect with the Hiawatha LRT line at the Metrodome station in Minneapolis and thesoon-to be opened Northstar <strong>com</strong>muter rail line at the new Minneapolis Multimodal Station.
MARKET OVERVIEW2402 University Ave.St. Paul, MN
MARKET OVERVIEW2402 University Ave.St. Paul, MN
Minneapolis35W6594555.00 MilesSt. AnthonyRoseville3.00 MilesLauderdale280Falcon Heights1.00 Mile280l94513536St. PauLat: 44.9641 Lon: -93.1979 Zoom: 11 mi Logos are for identification purposes only and may be trademarks of their respective <strong>com</strong>panies.LilydaleWest S0 1 2MilesMendota HeightsMendota©2009, SITES USA Inc., Chandler, AZ (480) 491-1112. All Rights Reserved.2402 University AveSaint Paul, MinnesotaSeptember 2009This map was produced using data from private and government sources deemed to be reliable. The information herein is provided without representation or warranty.
DEMOGRAPHIC PROFILE COMPLETE1990 - 2000 Census, 2007 Estimates & 2012 ProjectionsCalculated using Proportional Block GroupsLat/Lon: 44.964119/-93.1979052402 University AveSaint Paul, MinnesotaSeptember 20091.00 mi radius 3.00 mi radius5.00 mi radiusRF9PopulationEstimated Population (2007) 7,612 156,218 438,943Census Population (1990) 7,394 157,066 437,698Census Population (2000) 7,393 161,539 450,780Projected Population (2012) 7,804 154,214 434,616Forecasted Population (2017) 8,030 150,076 425,436Historical Annual Change (1990-2000) -1 0.0% 4,473 0.3% 13,081 0.3%Historical Annual Change (2000-2007) 219 0.4% -5,320 -0.5% -11,836 -0.4%Projected Annual Change (2007-2012) 192 0.5% -2,004 -0.3% -4,327 -0.2%Est. Population Density (2007) 2,556.87 psm 5,707.23 psm 5,811.82 psmTrade Area Size 2.98 sq mi 27.37 sq mi 75.53 sq miHouseholdsEstimated Households (2007) 3,569 62,715 190,250Census Households (1990) 3,332 63,247 189,201Census Households (2000) 3,410 64,380 193,035Projected Households (2012) 3,709 62,397 190,409Forecasted Households (2017) 3,873 61,221 188,746Historical Annual Change (1990-2000) 78 0.2% 1,133 0.2% 3,835 0.2%Projected Annual Change (2000-2012) 299 0.7% -1,983 -0.3% -2,626 -0.1%Average Household In<strong>com</strong>eEst. Average Household In<strong>com</strong>e (2007) $65,730 $57,539 $56,445Census Average Hhld In<strong>com</strong>e (1990) $35,899 $32,861 $32,550Census Average Hhld In<strong>com</strong>e (2000) $56,754 $50,831 $50,116Proj. Average Household In<strong>com</strong>e (2012) $70,484 $62,440 $61,239Historical Annual Change (1990-2000) $20,855 5.8% $17,971 5.5% $17,566 5.4%Projected Annual Change (2000-2012) $13,729 2.0% $11,609 1.9% $11,123 1.8%Median Household In<strong>com</strong>eEst. Median Household In<strong>com</strong>e (2007) $50,273 $47,790 $47,918Census Median Hhld In<strong>com</strong>e (1990) $28,348 $26,854 $26,374Census Median Hhld In<strong>com</strong>e (2000) $42,397 $39,942 $39,839Proj. Median Household In<strong>com</strong>e (2012) $55,430 $52,838 $53,129Historical Annual Change (1990-2000) $14,049 5.0% $13,088 4.9% $13,465 5.1%Projected Annual Change (2000-2012) $13,032 2.6% $12,896 2.7% $13,290 2.8%Per Capita In<strong>com</strong>eEst. Per Capita In<strong>com</strong>e (2007) $32,804 $25,120 $26,401Census Per Capita In<strong>com</strong>e (1990) $16,177 $13,232 $14,070Census Per Capita In<strong>com</strong>e (2000) $26,150 $20,140 $21,332Proj. Per Capita In<strong>com</strong>e (2012) $35,755 $27,660 $29,122Historical Annual Change (1990-2000) $9,973 6.2% $6,908 5.2% $7,261 5.2%Projected Annual Change (2000-2012) $9,605 3.1% $7,520 3.1% $7,791 3.0%Other In<strong>com</strong>eEst. Median Disposable In<strong>com</strong>e (2007) $42,558 $40,265 $40,442Proj. Median Disposable In<strong>com</strong>e (2012) $46,274 $43,992 $44,279Est. Median Household Net Worth (2007) $463,922 $433,076 $416,997This report was produced using data from private and government sources deemed to be reliable. The information herein is provided without representation or warranty.©2009, Sites USA, Chandler, Arizona, 480-491-1112 - 1 of 9 - Demographic Source: Applied Geographic Solutions / TIGER Geography 08/07
DEMOGRAPHIC PROFILE COMPLETE1990 - 2000 Census, 2007 Estimates & 2012 ProjectionsCalculated using Proportional Block GroupsLat/Lon: 44.964119/-93.1979052402 University AveSaint Paul, MinnesotaSeptember 20091.00 mi radius 3.00 mi radius5.00 mi radiusRF9Household In<strong>com</strong>e Distribution (2007)HH In<strong>com</strong>e $200,000 or More 174 4.9% 2,123 3.4% 5,797 3.0%HH In<strong>com</strong>e $150,000 to 199,999 104 2.9% 1,934 3.1% 5,230 2.7%HH In<strong>com</strong>e $125,000 to 149,999 126 3.5% 2,175 3.5% 6,211 3.3%HH In<strong>com</strong>e $100,000 to 124,999 208 5.8% 3,937 6.3% 11,767 6.2%HH In<strong>com</strong>e $75,000 to 99,999 452 12.7% 7,028 11.2% 21,299 11.2%HH In<strong>com</strong>e $50,000 to 74,999 712 19.9% 11,272 18.0% 35,983 18.9%HH In<strong>com</strong>e $35,000 to 49,999 512 14.3% 9,303 14.8% 29,586 15.6%HH In<strong>com</strong>e $25,000 to 34,999 370 10.4% 7,340 11.7% 23,143 12.2%HH In<strong>com</strong>e $15,000 to 24,999 435 12.2% 7,648 12.2% 22,979 12.1%HH In<strong>com</strong>e $10,000 to 14,999 192 5.4% 3,368 5.4% 9,959 5.2%HH In<strong>com</strong>e $0 to 9,999 285 8.0% 6,586 10.5% 18,296 9.6%HH In<strong>com</strong>e $35,000+ 2,287 64.1% 37,773 60.2% 115,873 60.9%HH In<strong>com</strong>e $50,000+ 1,776 49.7% 28,470 45.4% 86,287 45.4%HH In<strong>com</strong>e $75,000+ 1,064 29.8% 17,198 27.4% 50,304 26.4%Race & Ethnicity (2007)Total Population 7,612 156,218 438,943White 6,069 79.7% 108,434 69.4% 293,221 66.8%Black or African American 719 9.4% 20,813 13.3% 67,008 15.3%American Indian & Alaska Native 63 0.8% 2,708 1.7% 6,142 1.4%Asian 452 5.9% 12,281 7.9% 33,257 7.6%Hawiian & Pacific Islander 6 0.1% 159 0.1% 428 0.1%Other Race 95 1.2% 5,422 3.5% 19,542 4.5%Two or More Races 208 2.7% 6,401 4.1% 19,346 4.4%Not Hispanic or Latino Population 7,190 94.5% 143,544 91.9% 392,261 89.4%Non Hispanic: White 5,737 79.8% 101,516 70.7% 268,383 68.4%Non Hispanic: Black or African American 668 9.3% 17,854 12.4% 54,329 13.9%Non Hispanic: Amer Indian & AK Native 59 0.8% 2,076 1.4% 4,833 1.2%Non Hispanic: Asian 426 5.9% 10,972 7.6% 28,854 7.4%Non Hispanic: Hawiian & Pacific Islander 6 0.1% 154 0.1% 378 0.1%Non Hispanic: Other Race 95 1.3% 5,389 3.8% 19,229 4.9%Non Hispanic: Two or More Races 199 2.8% 5,584 3.9% 16,254 4.1%Hispanic or Latino Population 422 5.5% 12,674 8.1% 46,683 10.6%Hispanic: White 332 78.6% 6,919 54.6% 24,837 53.2%Hispanic: Black or African American 51 12.1% 2,959 23.3% 12,678 27.2%Hispanic: American Indian & Alaska Native 4 0.8% 633 5.0% 1,309 2.8%Hispanic: Asian 26 6.3% 1,309 10.3% 4,403 9.4%Hispanic: Hawiian & Pacific Islander 0 - 5 0.0% 50 0.1%Hispanic: Other Race 0 - 33 0.3% 313 0.7%Hispanic: Two or More Races 9 2.1% 816 6.4% 3,091 6.6%Not of Hispanic Origin Population (1990) 7,244 98.0% 153,538 97.8% 427,124 97.6%Hispanic Origin Population (1990) 150 2.0% 3,528 2.2% 10,575 2.4%Not Hispanic or Latino Population (2000) 7,085 95.8% 152,342 94.3% 417,348 92.6%Hispanic or Latino Population (2000) 308 4.2% 9,197 5.7% 33,432 7.4%Not Hispanic or Latino Population 5yr (2012) 7,291 93.4% 139,200 90.3% 378,993 87.2%Hispanic or Latino Population 5yr (2012) 513 6.6% 15,014 9.7% 55,623 12.8%Historical Annual Change (1990-2000) 158 10.5% 5,668 16.1% 22,857 21.6%Projected Annual Change (2000-2012) 205 5.6% 5,817 5.3% 22,191 5.5%This report was produced using data from private and government sources deemed to be reliable. The information herein is provided without representation or warranty.©2009, Sites USA, Chandler, Arizona, 480-491-1112 - 2 of 9 - Demographic Source: Applied Geographic Solutions / TIGER Geography 08/07
DEMOGRAPHIC PROFILE COMPLETE1990 - 2000 Census, 2007 Estimates & 2012 ProjectionsCalculated using Proportional Block GroupsLat/Lon: 44.964119/-93.1979052402 University AveSaint Paul, MinnesotaSeptember 20091.00 mi radius 3.00 mi radius5.00 mi radiusRF9Age Distribution (2007)Total Population 7,612 156,218 438,943Age 0 to 4 yrs 378 5.0% 9,899 6.3% 28,885 6.6%Age 5 to 9 yrs 312 4.1% 7,954 5.1% 23,973 5.5%Age 10 to 14 yrs 344 4.5% 7,672 4.9% 22,809 5.2%Age 15 to 19 yrs 392 5.2% 15,204 9.7% 31,724 7.2%Age 20 to 24 yrs 823 10.8% 21,717 13.9% 45,702 10.4%Age 25 to 29 yrs 709 9.3% 12,244 7.8% 37,793 8.6%Age 30 to 34 yrs 606 8.0% 11,143 7.1% 35,055 8.0%Age 35 to 39 yrs 532 7.0% 10,276 6.6% 31,600 7.2%Age 40 to 44 yrs 562 7.4% 10,478 6.7% 30,962 7.1%Age 45 to 49 yrs 669 8.8% 11,147 7.1% 31,740 7.2%Age 50 to 54 yrs 582 7.6% 9,884 6.3% 28,571 6.5%Age 55 to 59 yrs 456 6.0% 7,794 5.0% 23,216 5.3%Age 60 to 64 yrs 308 4.0% 5,402 3.5% 17,277 3.9%Age 65 to 69 yrs 175 2.3% 3,716 2.4% 12,075 2.8%Age 70 to 74 yrs 156 2.0% 2,906 1.9% 9,705 2.2%Age 75 to 79 yrs 157 2.1% 2,579 1.7% 8,987 2.0%Age 80 to 84 yrs 140 1.8% 2,505 1.6% 8,119 1.8%Age 85 yrs plus 311 4.1% 3,697 2.4% 10,749 2.4%Median Age 36.7 yrs 32.2 yrs 34.0 yrsAge 19 yrs or less 1,426 18.7% 40,730 26.1% 107,391 24.5%Age 20 to 64 years 5,247 68.9% 100,085 64.1% 281,917 64.2%Age 65 years Plus 939 12.3% 15,404 9.9% 49,635 11.3%Female Age Distribution (2007)Female Population 3,868 50.8% 79,642 51.0% 220,079 50.1%Age 0 to 4 yrs 193 5.0% 4,830 6.1% 13,997 6.4%Age 5 to 9 yrs 153 3.9% 3,917 4.9% 11,522 5.2%Age 10 to 14 yrs 168 4.3% 3,696 4.6% 10,942 5.0%Age 15 to 19 yrs 184 4.8% 7,996 10.0% 16,059 7.3%Age 20 to 24 yrs 406 10.5% 10,725 13.5% 22,788 10.4%Age 25 to 29 yrs 356 9.2% 6,001 7.5% 18,497 8.4%Age 30 to 34 yrs 296 7.6% 5,462 6.9% 16,618 7.6%Age 35 to 39 yrs 253 6.5% 4,969 6.2% 14,635 6.7%Age 40 to 44 yrs 274 7.1% 5,135 6.4% 14,561 6.6%Age 45 to 49 yrs 328 8.5% 5,628 7.1% 15,412 7.0%Age 50 to 54 yrs 276 7.1% 4,977 6.2% 14,179 6.4%Age 55 to 59 yrs 216 5.6% 4,052 5.1% 11,839 5.4%Age 60 to 64 yrs 161 4.2% 2,837 3.6% 9,012 4.1%Age 65 to 69 yrs 91 2.4% 1,998 2.5% 6,460 2.9%Age 70 to 74 yrs 84 2.2% 1,587 2.0% 5,411 2.5%Age 75 to 79 yrs 94 2.4% 1,534 1.9% 5,388 2.4%Age 80 to 84 yrs 89 2.3% 1,624 2.0% 5,137 2.3%Age 85 yrs plus 245 6.3% 2,673 3.4% 7,622 3.5%Female Median Age 37.9 yrs 33.3 yrs 35.2 yrsAge 19 yrs or less 698 18.0% 20,439 25.7% 52,520 23.9%Age 20 to 64 years 2,566 66.3% 49,787 62.5% 137,540 62.5%Age 65 years Plus 604 15.6% 9,416 11.8% 30,019 13.6%This report was produced using data from private and government sources deemed to be reliable. The information herein is provided without representation or warranty.©2009, Sites USA, Chandler, Arizona, 480-491-1112 - 3 of 9 - Demographic Source: Applied Geographic Solutions / TIGER Geography 08/07
DEMOGRAPHIC PROFILE COMPLETE1990 - 2000 Census, 2007 Estimates & 2012 ProjectionsCalculated using Proportional Block GroupsLat/Lon: 44.964119/-93.1979052402 University AveSaint Paul, MinnesotaSeptember 20091.00 mi radius 3.00 mi radius5.00 mi radiusRF9Male Age Distribution (2007)Male Population 3,744 49.2% 76,577 49.0% 218,864 49.9%Age 0 to 4 yrs 185 4.9% 5,069 6.6% 14,888 6.8%Age 5 to 9 yrs 160 4.3% 4,037 5.3% 12,451 5.7%Age 10 to 14 yrs 176 4.7% 3,977 5.2% 11,868 5.4%Age 15 to 19 yrs 208 5.6% 7,208 9.4% 15,665 7.2%Age 20 to 24 yrs 417 11.1% 10,991 14.4% 22,914 10.5%Age 25 to 29 yrs 353 9.4% 6,243 8.2% 19,296 8.8%Age 30 to 34 yrs 310 8.3% 5,681 7.4% 18,438 8.4%Age 35 to 39 yrs 278 7.4% 5,308 6.9% 16,964 7.8%Age 40 to 44 yrs 288 7.7% 5,343 7.0% 16,402 7.5%Age 45 to 49 yrs 341 9.1% 5,518 7.2% 16,328 7.5%Age 50 to 54 yrs 306 8.2% 4,907 6.4% 14,392 6.6%Age 55 to 59 yrs 241 6.4% 3,742 4.9% 11,377 5.2%Age 60 to 64 yrs 147 3.9% 2,565 3.3% 8,265 3.8%Age 65 to 69 yrs 83 2.2% 1,719 2.2% 5,615 2.6%Age 70 to 74 yrs 72 1.9% 1,319 1.7% 4,294 2.0%Age 75 to 79 yrs 63 1.7% 1,045 1.4% 3,599 1.6%Age 80 to 84 yrs 51 1.4% 881 1.2% 2,981 1.4%Age 85 yrs plus 66 1.8% 1,024 1.3% 3,127 1.4%Male Median Age 35.5 yrs 31.3 yrs 32.9 yrsAge 19 yrs or less 728 19.5% 20,291 26.5% 54,871 25.1%Age 20 to 64 years 2,681 71.6% 50,298 65.7% 144,377 66.0%Age 65 years Plus 335 8.9% 5,987 7.8% 19,616 9.0%Males per 100 Females, Male % Pop (2007)Overall Comparison 97 96 99Age 0 to 4 yrs 96 48.9% 105 51.2% 106 51.5%Age 5 to 9 yrs 105 51.1% 103 50.8% 108 51.9%Age 10 to 14 yrs 105 51.2% 108 51.8% 108 52.0%Age 15 to 19 yrs 113 53.0% 90 47.4% 98 49.4%Age 20 to 24 yrs 103 50.7% 102 50.6% 101 50.1%Age 25 to 29 yrs 99 49.8% 104 51.0% 104 51.1%Age 30 to 34 yrs 105 51.2% 104 51.0% 111 52.6%Age 35 to 39 yrs 110 52.3% 107 51.6% 116 53.7%Age 40 to 44 yrs 105 51.2% 104 51.0% 113 53.0%Age 45 to 49 yrs 104 51.0% 98 49.5% 106 51.4%Age 50 to 54 yrs 111 52.6% 99 49.6% 102 50.4%Age 55 to 59 yrs 111 52.7% 92 48.0% 96 49.0%Age 60 to 64 yrs 91 47.7% 90 47.5% 92 47.8%Age 65 to 69 yrs 91 47.7% 86 46.2% 87 46.5%Age 70 to 74 yrs 85 46.1% 83 45.4% 79 44.2%Age 75 to 79 yrs 66 39.8% 68 40.5% 67 40.0%Age 80 to 84 yrs 57 36.2% 54 35.2% 58 36.7%Age 85 yrs plus 27 21.3% 38 27.7% 41 29.1%Age 19 yrs or less 104 51.1% 99 49.8% 104 51.1%Age 20 to 39 yrs 104 50.9% 104 51.0% 107 51.7%Age 40 to 64 yrs 105 51.3% 98 49.4% 103 50.7%Age 65 years Plus 55 35.7% 64 38.9% 65 39.5%This report was produced using data from private and government sources deemed to be reliable. The information herein is provided without representation or warranty.©2009, Sites USA, Chandler, Arizona, 480-491-1112 - 4 of 9 - Demographic Source: Applied Geographic Solutions / TIGER Geography 08/07
DEMOGRAPHIC PROFILE COMPLETE1990 - 2000 Census, 2007 Estimates & 2012 ProjectionsCalculated using Proportional Block GroupsLat/Lon: 44.964119/-93.1979052402 University AveSaint Paul, MinnesotaSeptember 20091.00 mi radius 3.00 mi radius5.00 mi radiusRF9Household Type (2007)Total Households 3,569 62,715 190,250Households with Children 813 22.8% 17,296 27.6% 49,296 25.9%Average Household Size 2.03 2.23 2.16Est. Household Density 1,198.97 psm 2,291.22 psm 2,519.00 psmPopulation Family 4,401 57.8% 92,613 59.3% 271,090 61.8%Population Non-Family 2,829 37.2% 47,320 30.3% 138,932 31.7%Population Group Qtrs 382 5.0% 16,285 10.4% 28,922 6.6%Family Households 1,481 41.5% 29,411 46.9% 85,046 44.7%Married Couple Hhlds 1,143 77.1% 21,286 72.4% 59,966 70.5%Other Family Hhlds 339 22.9% 8,125 27.6% 25,080 29.5%Family Households With Children 803 54.2% 17,075 58.1% 48,623 57.2%Married Couple With Children 620 77.2% 12,229 71.6% 33,235 68.4%Other Family Hhlds With Children 183 22.8% 4,846 28.4% 15,388 31.6%Family Households No Children 678 45.8% 12,336 41.9% 36,423 42.8%Married Couple No Children 523 77.1% 9,058 73.4% 26,732 73.4%Other Family Households No Children 155 22.9% 3,279 26.6% 9,691 26.6%Average Family Household Size 2.97 3.15 3.19Average Family In<strong>com</strong>e $99,933 $79,685 $77,441Median Family In<strong>com</strong>e $76,473 $68,266 $67,376Non-Family Households 2,088 58.5% 33,304 53.1% 105,204 55.3%Non-Family Hhlds With Children 10 0.5% 221 0.7% 673 0.6%Non-Family Hhld No Children 2,078 99.5% 33,083 99.3% 104,532 99.4%N-F Hhld Lone Person No Children 1,536 73.6% 24,389 73.2% 81,576 77.5%Lone Male Householder 770 50.1% 11,629 47.7% 39,960 49.0%Lone Female Householder 766 49.9% 12,760 52.3% 41,615 51.0%N-F Hhld 2+ Persons No Children 542 26.0% 8,694 26.1% 22,956 21.8%Average Non-Family Hhld Size 1.35 1.42 1.32Marital Status (2007)(15 Years or Older) 6,577 130,282 362,834Never Married 2,899 44.1% 63,707 48.9% 165,074 45.5%Now Married 2,244 34.1% 41,741 32.0% 119,466 32.9%Previously Married 1,434 21.8% 24,833 19.1% 78,293 21.6%Separated 373 26.0% 7,519 30.3% 21,636 27.6%Widowed 445 31.0% 6,098 24.6% 20,103 25.7%Divorced 616 43.0% 11,216 45.2% 36,554 46.7%Educational Attainment (2007)Adult Population (25 Years or Older) 5,363 93,772 285,851Elementary (0 to 8) 83 1.6% 3,036 3.2% 10,917 3.8%Some High School (9 to 11) 200 3.7% 3,785 4.0% 13,635 4.8%High School Graduate (12) 876 16.3% 16,792 17.9% 57,636 20.2%Some College (13 to 16) 812 15.1% 15,416 16.4% 51,467 18.0%Associate Degree Only 294 5.5% 6,781 7.2% 21,763 7.6%Bachelor Degree Only 1,565 29.2% 26,744 28.5% 79,003 27.6%Graduate Degree 1,531 28.6% 21,218 22.6% 51,429 18.0%Any College + (Some College or higher 4,203 78.4% 70,159 74.8% 203,663 71.2%College Degree + (Bachelor Degree or higher 3,096 57.7% 47,963 51.1% 130,433 45.6%This report was produced using data from private and government sources deemed to be reliable. The information herein is provided without representation or warranty.©2009, Sites USA, Chandler, Arizona, 480-491-1112 - 5 of 9 - Demographic Source: Applied Geographic Solutions / TIGER Geography 08/07
DEMOGRAPHIC PROFILE COMPLETE1990 - 2000 Census, 2007 Estimates & 2012 ProjectionsCalculated using Proportional Block GroupsLat/Lon: 44.964119/-93.1979052402 University AveSaint Paul, MinnesotaSeptember 20091.00 mi radius 3.00 mi radius5.00 mi radiusRF9Housing (2007)Total Housing Units 3,903 68,369 208,675Housing Units, Occupied 3,569 91.4% 62,715 91.7% 190,250 91.2%Housing Units, Owner-Occupied 1,874 52.5% 34,363 54.8% 100,977 53.1%Housing Units, Renter-Occupied 1,696 47.5% 28,352 45.2% 89,273 46.9%Housing Units, Vacant 334 8.6% 5,654 8.3% 18,424 8.8%Total Housing Units (2000) 3,497 66,186 199,987Historical Annual Change (2000-2007) 407 1.7% 2,183 0.5% 8,688 0.6%Household Size (2007)Total Households 3,569 62,715 190,2501 Person Household 1,536 43.0% 24,389 38.9% 81,576 42.9%2 Person Households 1,117 31.3% 18,786 30.0% 55,336 29.1%3 Person Households 432 12.1% 8,346 13.3% 22,038 11.6%4 Person Households 293 8.2% 6,325 10.1% 16,718 8.8%5 Person Households 131 3.7% 2,782 4.4% 7,739 4.1%6 Person Households 32 0.9% 957 1.5% 2,975 1.6%7+ Person Households 29 0.8% 1,132 1.8% 3,869 2.0%Household Stability (2007)Total Households 3,569 62,715 190,250In current residence < 1 year 899 25.2% 15,238 24.3% 45,711 24.0%In current residence 1-2 years 961 26.9% 16,452 26.2% 51,419 27.0%In current residence 3-5 years 535 15.0% 9,428 15.0% 29,629 15.6%In current residence 6-10 years 342 9.6% 6,382 10.2% 20,089 10.6%In current residence > 10 years 832 23.3% 15,215 24.3% 43,403 22.8%Turnover (% Annual Residential Turnover) 25.2% 24.3% 24.0%Stability (% In Current Residence 5+ Years) 32.9% 34.4% 33.4%Median Years in Residence 3.1 yrs 3.6 yrs 3.6 yrsHousehold Vehicles (2007)Total Vehicles Available 5,546 97,980 286,085Household: 0 Vehicles Available 387 10.9% 7,340 11.7% 24,736 13.0%Household: 1 Vehicles Available 1,499 42.0% 26,309 41.9% 81,353 42.8%Household: 2 Vehicles Available 1,210 33.9% 20,206 32.2% 58,675 30.8%Household: 3+ Vehicles Available 473 13.3% 8,860 14.1% 25,487 13.4%Average Per Household 1.6 Vehicles 1.6 Vehicles 1.5 VehiclesOwner Occupied Hhlds Vehicles 3,517 63.4% 63,917 65.2% 187,208 65.4%Average Per Owner Household 1.9 Vehicles 1.9 Vehicles 1.9 VehiclesRenter Occupied Hhlds Vehicles 2,029 36.6% 34,063 34.8% 98,877 34.6%Average Per Renter Household 1.2 Vehicles 1.2 Vehicles 1.1 VehiclesTravel Time (2000)Worker Base (16 Years or Older) 4,590 91,413 248,768Travel to Work in 14 Minutes or Less 1,640 35.7% 30,394 33.2% 72,982 29.3%Travel to Work in 15 to 29 Minutes 1,920 41.8% 40,059 43.8% 114,120 45.9%Travel to Work in 30 to 59 Minutes 710 15.5% 15,094 16.5% 45,817 18.4%Travel to Work in 60 Minutes or More 133 2.9% 2,659 2.9% 7,844 3.2%Work at Home 188 4.1% 3,205 3.5% 8,004 3.2%Average Travel Time to Work 17.6 mins 18.5 mins 19.6 minsThis report was produced using data from private and government sources deemed to be reliable. The information herein is provided without representation or warranty.©2009, Sites USA, Chandler, Arizona, 480-491-1112 - 6 of 9 - Demographic Source: Applied Geographic Solutions / TIGER Geography 08/07
DEMOGRAPHIC PROFILE COMPLETE1990 - 2000 Census, 2007 Estimates & 2012 ProjectionsCalculated using Proportional Block GroupsLat/Lon: 44.964119/-93.1979052402 University AveSaint Paul, MinnesotaSeptember 20091.00 mi radius 3.00 mi radius5.00 mi radiusTransportation To Work (2000)Work Base 4,590 91,413 248,768Drive to Work Alone 3,085 67.2% 55,588 60.8% 156,766 63.0%Drive to Work in Carpool 407 8.9% 9,303 10.2% 27,436 11.0%Travel to Work - Public Transportation 495 10.8% 10,422 11.4% 31,477 12.7%Drive to Work on Motorcycle 11 0.2% 83 0.1% 250 0.1%Bicycle to Work 125 2.7% 2,249 2.5% 4,387 1.8%Walk to Work 272 5.9% 10,154 11.1% 19,190 7.7%Other Means 7 0.2% 408 0.4% 1,259 0.5%Work at Home 188 4.1% 3,205 3.5% 8,004 3.2%Daytime Demos (2007)Total Number of Businesses 1,201 7,721 24,576Total Number of Employees 18,124 168,727 446,446Company Headqtrs: Businesses 11 0.9% 56 0.7% 254 1.0%Company Headqtrs: Employees 954 5.3% 15,870 9.4% 48,438 10.8%Employee Population per BusinessResidential Population per BusinessEst. Adj. Daytime Demographics (Age16+)15.1 to 16.3 to 120,06521.9 to 120.2 to 1210,84718.2 to 117.9 to 1565,633Labor Force (2007)Labor: Population Age 16+ 6,500 128,536 357,918Unemployment Rate 4.1% 6.2% 5.8%Labor Force Total: Males 3,180 48.9% 62,560 48.7% 177,126 49.5%Male civilian employed 2,319 72.9% 44,382 70.9% 125,451 70.8%Male civilian unemployed 190 6.0% 3,974 6.4% 10,736 6.1%Males in Armed Forces 9 0.3% 30 0.0% 84 0.0%Males not in labor force 663 20.8% 14,173 22.7% 40,856 23.1%Labor Force Total: Females 3,320 51.1% 65,976 51.3% 180,792 50.5%Female civilian employed 2,231 67.2% 41,994 63.7% 113,149 62.6%Female civilian unemployed 76 2.3% 3,960 6.0% 9,991 5.5%Females in Armed Forces 0 - 10 0.0% 48 0.0%Females not in labor force 1,013 30.5% 20,012 30.3% 57,604 31.9%Employment Force Change (2000-2007) -34 -0.7% -5,007 -5.5% -10,046 -4.0%Male Change (2000-2007) -18 -0.8% -1,872 -4.0% -3,556 -2.8%Female Change (2000-2007) -15 -0.7% -3,135 -6.9% -6,490 -5.4%Occupation (2000)Occupation: Population Age 16+ 4,584 91,383 248,646Occupation Total: Males 2,337 51.0% 46,254 50.6% 129,007 51.9%Occupation Total: Females 2,246 49.0% 45,129 49.4% 119,639 48.1%Mgmt, Business, & Financial Operations 660 14.4% 10,954 12.0% 32,694 13.1%Professional and Related 1,801 39.3% 29,513 32.3% 70,521 28.4%Service 606 13.2% 14,639 16.0% 40,634 16.3%Sales and Office 912 19.9% 23,306 25.5% 63,836 25.7%Farming, Fishing, and Forestry 14 0.3% 145 0.2% 396 0.2%Construction, Extraction, & Maintenance 233 5.1% 3,978 4.4% 12,334 5.0%Production, Transport, & Material Moving 356 7.8% 8,848 9.7% 28,231 11.4%White Collar 73.6% 69.8% 67.2%Blue Collar 26.4% 30.2% 32.8%©2009, Sites USA, Chandler, Arizona, 480-491-1112 - 7 of 9 - Demographic Source: Applied Geographic Solutions / TIGER Geography 08/07RF9This report was produced using data from private and government sources deemed to be reliable. The information herein is provided without representation or warranty.
DEMOGRAPHIC PROFILE COMPLETE1990 - 2000 Census, 2007 Estimates & 2012 ProjectionsCalculated using Proportional Block GroupsLat/Lon: 44.964119/-93.1979052402 University AveSaint Paul, MinnesotaSeptember 20091.00 mi radius 3.00 mi radius5.00 mi radiusUnits In Structure (2000)Total Units 3,497 66,186 199,9871 Detached Unit 1,486 42.5% 31,697 47.9% 85,160 42.6%1 Attached Unit 130 3.7% 2,037 3.1% 6,512 3.3%2 Units 374 10.7% 6,080 9.2% 18,685 9.3%3 to 4 Units 283 8.1% 3,188 4.8% 10,252 5.1%5 to 9 Units 258 7.4% 3,301 5.0% 9,536 4.8%10 to 19 Units 541 15.5% 6,629 10.0% 20,773 10.4%20 to 49 Units 252 7.2% 5,290 8.0% 20,326 10.2%50 or more Units 168 4.8% 7,895 11.9% 28,117 14.1%Mobile Home or Trailer 5 0.1% 67 0.1% 563 0.3%Other Structure 0 - 3 0.0% 61 0.0%Homes Built By Year (2000)Homes Built 1999 to 2000 10 0.3% 216 0.3% 811 0.4%Homes Built 1995 to 1998 14 0.4% 569 0.9% 1,786 0.9%Homes Built 1990 to 1994 79 2.3% 1,116 1.7% 2,917 1.5%Homes Built 1980 to 1989 122 3.5% 3,806 5.8% 14,163 7.1%Homes Built 1970 to 1979 380 10.9% 7,365 11.1% 21,017 10.5%Homes Built 1960 to 1969 251 7.2% 6,720 10.2% 21,424 10.7%Homes Built 1950 to 1959 432 12.4% 6,234 9.4% 23,970 12.0%Homes Built 1940 to 1949 269 7.7% 5,148 7.8% 17,120 8.6%Homes Built Before 1939 1,940 55.5% 35,012 52.9% 96,778 48.4%Median Age of Homes 60.9 yrs 58.4 yrs 56.4 yrsHome Values (2000)Owner Specified Housing Units 1,349 28,144 77,472Home Values $1,000,000 or More 3 0.2% 17 0.1% 104 0.1%Home Values $750,000 or $999,999 4 0.3% 18 0.1% 87 0.1%Home Values $500,000 or $749,999 14 1.1% 95 0.3% 441 0.6%Home Values $400,000 to $499,999 16 1.2% 202 0.7% 652 0.8%Home Values $300,000 to $399,999 56 4.2% 680 2.4% 1,670 2.2%Home Values $250,000 to $299,999 69 5.1% 978 3.5% 1,925 2.5%Home Values $200,000 to $249,999 136 10.1% 1,834 6.5% 4,086 5.3%Home Values $175,000 to $199,999 126 9.3% 2,047 7.3% 4,408 5.7%Home Values $150,000 to $174,999 118 8.8% 2,554 9.1% 7,306 9.4%Home Values $125,000 to $149,999 225 16.7% 4,236 15.1% 13,243 17.1%Home Values $100,000 to $124,999 208 15.4% 5,354 19.0% 15,405 19.9%Home Values $90,000 to $99,999 115 8.5% 2,797 9.9% 7,667 9.9%Home Values $80,000 to $89,999 75 5.6% 2,597 9.2% 6,804 8.8%Home Values $70,000 to $79,999 69 5.1% 1,899 6.7% 5,220 6.7%Home Values $60,000 to $69,999 54 4.0% 1,341 4.8% 3,715 4.8%Home Values $50,000 to $59,999 38 2.8% 844 3.0% 2,548 3.3%Home Values $35,000 to $49,999 10 0.8% 472 1.7% 1,635 2.1%Home Values $25,000 to $34,999 10 0.7% 104 0.4% 340 0.4%Home Values $10,000 to $24,999 3 0.2% 75 0.3% 193 0.2%Home Values $0 to $9,999 0 - 0 - 22 0.0%Owner Occupied Median Home Value $146,025 $128,698 $127,959Renter Occupied Median Rent $498 $491 $517RF9This report was produced using data from private and government sources deemed to be reliable. The information herein is provided without representation or warranty.©2009, Sites USA, Chandler, Arizona, 480-491-1112 - 8 of 9 - Demographic Source: Applied Geographic Solutions / TIGER Geography 08/07
DEMOGRAPHIC PROFILE COMPLETE1990 - 2000 Census, 2007 Estimates & 2012 ProjectionsCalculated using Proportional Block GroupsLat/Lon: 44.964119/-93.1979052402 University AveSaint Paul, MinnesotaSeptember 20091.00 mi radius 3.00 mi radius5.00 mi radiusRF9Consumer Expenditure (Annual Total)Total Household Expenditure (2007)Total Non-Retail Expenditures (2007)Total Retail Expenditures (2007)Apparel (2007)Contributions (2007)Education (2007)Entertainment (2007)Food And Beverages (2007)Furnishings And Equipment (2007)Gifts (2007)Health Care (2007)Household Operations (2007)Miscellaneous Expenses (2007)Personal Care (2007)Personal Insurance (2007)Reading (2007)Shelter (2007)Tobacco (2007)Transportation (2007)Utilities (2007)$187,470,638 $2,988,629,112 $8,956,106,420$107,590,547 $1,714,856,750 $5,133,776,730$79,880,090 $1,273,772,370 $3,822,329,695$8,988,261 $143,382,304 $429,106,313$7,022,480 $110,334,198 $327,980,155$4,553,586 $72,345,954 $214,301,917$10,440,888 $166,099,060 $497,002,464$28,809,949 $460,990,671 $1,384,324,779$8,149,088 $129,347,219 $386,441,945$4,998,611 $78,966,128 $235,391,860$11,606,354 $185,388,106 $558,817,126$6,641,443 $105,311,680 $313,206,882$3,170,394 $50,593,207 $152,429,204$2,729,621 $43,498,194 $130,430,353$1,908,085 $30,208,753 $89,644,083$623,163 $9,876,328 $29,657,471$36,107,767 $575,825,579 $1,725,641,803$1,245,333 $20,034,568 $60,621,755$37,175,986 $593,732,281 $1,780,675,095$13,299,631 $212,694,908 $640,433,259Consumer Expenditure (per Household per Month)Total Household Expenditure (2007) $4,377 $3,971 $3,923Total Non-Retail Expenditures (2007) $2,512 57.4% $2,279 57.4% $2,249 57.3%Total Retail Expenditures (2007) $1,865 42.6% $1,693 42.6% $1,674 42.7%Apparel (2007) $210 4.8% $191 4.8% $188 4.8%Contributions (2007) $164 3.7% $147 3.7% $144 3.7%Education (2007) $106 2.4% $96 2.4% $94 2.4%Entertainment (2007) $244 5.6% $221 5.6% $218 5.5%Food And Beverages (2007) $673 15.4% $613 15.4% $606 15.5%Furnishings And Equipment (2007) $190 4.3% $172 4.3% $169 4.3%Gifts (2007) $117 2.7% $105 2.6% $103 2.6%Health Care (2007) $271 6.2% $246 6.2% $245 6.2%Household Operations (2007) $155 3.5% $140 3.5% $137 3.5%Miscellaneous Expenses (2007) $74 1.7% $67 1.7% $67 1.7%Personal Care (2007) $64 1.5% $58 1.5% $57 1.5%Personal Insurance (2007) $45 1.0% $40 1.0% $39 1.0%Reading (2007) $15 0.3% $13 0.3% $13 0.3%Shelter (2007) $843 19.3% $765 19.3% $756 19.3%Tobacco (2007) $29 0.7% $27 0.7% $27 0.7%Transportation (2007) $868 19.8% $789 19.9% $780 19.9%Utilities (2007) $311 7.1% $283 7.1% $281 7.2%This report was produced using data from private and government sources deemed to be reliable. The information herein is provided without representation or warranty.©2009, Sites USA, Chandler, Arizona, 480-491-1112 - 9 of 9 - Demographic Source: Applied Geographic Solutions / TIGER Geography 08/07