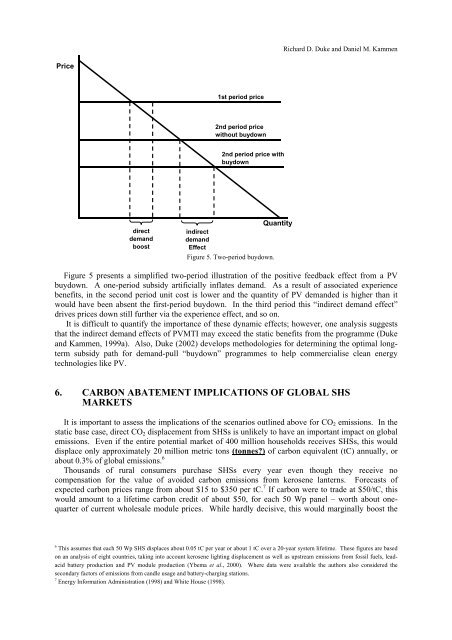
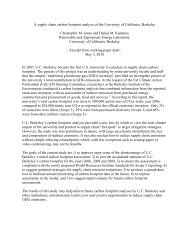
Richard D. Duke and Daniel M. KammenPrice1st period price2nd period pricewithout buydown2nd period price withbuydowndirectdemandboostQuantity<strong>in</strong>directdemandEffectFigure 5. Two-period buydown.Figure 5 presents a simplified two-period illustration of the positive feedback effect from a PVbuydown. A one-period subsidy artificially <strong>in</strong>flates demand. As a result of associated experiencebenefits, <strong>in</strong> the second period unit cost is lower and the quantity of PV demanded is higher than itwould have been absent the first-period buydown. In the third period this “<strong>in</strong>direct demand effect”drives prices down still further via the experience effect, and so on.It is difficult to quantify the importance of these dynamic effects; however, one analysis suggeststhat the <strong>in</strong>direct demand effects of PVMTI may exceed the static benefits from the programme (Dukeand Kammen, 1999a). Also, Duke (2002) develops methodologies <strong>for</strong> determ<strong>in</strong><strong>in</strong>g the optimal longtermsubsidy path <strong>for</strong> demand-pull “buydown” programmes to help commercialise clean energytechnologies like PV.6. CARBON ABATEMENT IMPLICATIONS OF GLOBAL SHSMARKETSIt is important to assess the implications of the scenarios outl<strong>in</strong>ed above <strong>for</strong> CO 2 emissions. In thestatic base case, direct CO 2 displacement from SHSs is unlikely to have an important impact on globalemissions. Even if the entire potential market of 400 million households receives SHSs, this woulddisplace only approximately 20 million metric tons (tonnes?) of carbon equivalent (tC) annually, orabout 0.3% of global emissions. 6Thousands of rural consumers purchase SHSs every year even though they receive nocompensation <strong>for</strong> the value of avoided carbon emissions from kerosene lanterns. Forecasts ofexpected carbon prices range from about $15 to $350 per tC. 7 If carbon were to trade at $50/tC, thiswould amount to a lifetime carbon credit of about $50, <strong>for</strong> each 50 Wp panel – worth about onequarterof current wholesale module prices. While hardly decisive, this would marg<strong>in</strong>ally boost the6 This assumes that each 50 Wp SHS displaces about 0.05 tC per year or about 1 tC over a 20-year system lifetime. These figures are basedon an analysis of eight countries, tak<strong>in</strong>g <strong>in</strong>to account kerosene light<strong>in</strong>g displacement as well as upstream emissions from fossil fuels, leadacidbattery production and PV module production (Ybema et al., 2000). Where data were available the authors also considered thesecondary factors of emissions from candle usage and battery-charg<strong>in</strong>g stations.7 <strong>Energy</strong> In<strong>for</strong>mation Adm<strong>in</strong>istration (1998) and White House (1998).
<strong>Energy</strong> <strong>for</strong> <strong>Development</strong>: <strong>Solar</strong> <strong>Home</strong> <strong>Systems</strong> <strong>in</strong> <strong>Africa</strong> and Global Carbon Emissionsnumber and size of SHSs <strong>in</strong>stalled s<strong>in</strong>ce the technology is already cost-effective <strong>in</strong> this application. 8Of course, the CDM can play a useful role only if the transaction costs <strong>in</strong>volved <strong>in</strong> certify<strong>in</strong>gemissions reductions <strong>for</strong> SHSs are kept to an absolute m<strong>in</strong>imum (Kaufman et al., 1999).In addition to direct carbon displacement, as noted every MWp of SHSs sold helps to lower theglobal market price <strong>for</strong> PV. As PV prices fall, sales <strong>in</strong> exist<strong>in</strong>g markets <strong>in</strong>creases and new nichemarkets open up. For example, at present, residential grid-connected PV systems are not economiceven <strong>in</strong> states with the most favourable comb<strong>in</strong>ation of high <strong>in</strong>solation and expensive retail rates. Ifmodule costs fall to $1.50/Wp, then rooftop systems would become cost-effective <strong>in</strong> about one-tenthof new s<strong>in</strong>gle-family homes constructed <strong>in</strong> the United States., or an annual market of about 500 MWp,i.e. twice the global level of PV module sales <strong>in</strong> 2000. At $1/Wp, the new home market <strong>in</strong>creases bya factor of four and large residential PV retrofit markets also become viable (Duke et al.,<strong>for</strong>thcom<strong>in</strong>g). Similar distributed grid PV markets exist globally.As noted above, <strong>in</strong>creased near-term SHSs sales could help to generate <strong>in</strong>direct demand effects <strong>in</strong>the global PV market. This substantially raises the carbon abatement value of SHS.7. CARBON ABATEMENT IMPLICATIONS OF AFRICAN SHSMARKETSAs of 1999, there are approximately 770 million people <strong>in</strong> <strong>Africa</strong>, of which 630 million are <strong>in</strong> sub-Saharan <strong>Africa</strong>. 9 [Can this figure be updated?] Precise estimates are unavailable, but less than halfof these people have access to grid electricity. That corresponds to a potential SHS market of 63million households (out of a global total of approximately 330 million). 10 A 50% penetration ratewith average system size grow<strong>in</strong>g to 50 Wp (as prices fall and rural <strong>in</strong>comes <strong>in</strong>crease) translates <strong>in</strong>toabout 1,600 MWp of total PV demand, or six times global PV sales <strong>in</strong> the year 2000. [So what wasthe actual figures <strong>in</strong> 2000?]There are, however, a number of unique aspects to the <strong>Africa</strong>n SHSs market that must beconsidered. Most importantly, the majority of the rural population <strong>in</strong> <strong>Africa</strong> lives <strong>in</strong> extreme poverty.This means that substantial subsidies and aggressive measures to reduce the “first-cost” barrier areparticularly important <strong>in</strong> the <strong>Africa</strong>n context. The fee-<strong>for</strong>-service programmes emerg<strong>in</strong>g <strong>in</strong> South<strong>Africa</strong> are encourag<strong>in</strong>g <strong>in</strong> this regard, but delays <strong>in</strong> disburs<strong>in</strong>g promised subsidies threaten tounderm<strong>in</strong>e their impact (Anderson and Duke, 2001).Moreover, especially <strong>in</strong> the South <strong>Africa</strong>n context, there are important political issues related toSHSs dissem<strong>in</strong>ation. Rural South <strong>Africa</strong>ns generally view SHSs as a second-best option relative toheavily subsidised grid connections that would provide them with considerably better service <strong>for</strong>similar or lower monthly payments. As it proceeds with its SHS ef<strong>for</strong>ts, the government of South<strong>Africa</strong> must there<strong>for</strong>e balance fiscal constra<strong>in</strong>ts on <strong>in</strong>creas<strong>in</strong>gly expensive grid-based electrificationwith the risk of be<strong>in</strong>g perceived as perpetuat<strong>in</strong>g a history of second-class electricity service <strong>for</strong> blackSouth <strong>Africa</strong>ns. 118. RENEWABLES SCENARIOS FOR AFRICAAs of 1995, <strong>Africa</strong> derived 16% of its grid electricity from renewable sources, and hydropoweraccounted <strong>for</strong> over 99% of this total. <strong>12</strong> As of 2002, 50-<strong>12</strong>5 MWp of off-grid PV had been <strong>in</strong>stalled <strong>in</strong>8 Note that the CDM would probably recognise carbon benefits only as they accrue. In that event, the stream of carbon abatement benefitsfrom each SHS would have to be discounted. At a 5% real discount rate, this lowers the present value to about US$25.9 www.prb.org/pubs/wpds99/wpds99a.htm.10 Assumes an unelectrified <strong>Africa</strong>n population of about 440 million <strong>in</strong> 2000 and an average rural household size of seven (derived fromWorld Resources Institute, 1998).11 For further <strong>in</strong><strong>for</strong>mation, an on-l<strong>in</strong>e documentary produced by Anderson and Duke (2001) is viewable at [www.pr<strong>in</strong>ceton.edu/duke].<strong>12</strong> World Resources Institute (1998). Total primary energy <strong>in</strong>cludes all conventional energy as well as traditional fuels def<strong>in</strong>ed as various<strong>for</strong>ms of animal and vegetable biomass.