Liquid Water Transport in Polymer Electrolyte Fuel Cells With Multi ...
Liquid Water Transport in Polymer Electrolyte Fuel Cells With Multi ...
Liquid Water Transport in Polymer Electrolyte Fuel Cells With Multi ...
- No tags were found...

You also want an ePaper? Increase the reach of your titles
YUMPU automatically turns print PDFs into web optimized ePapers that Google loves.
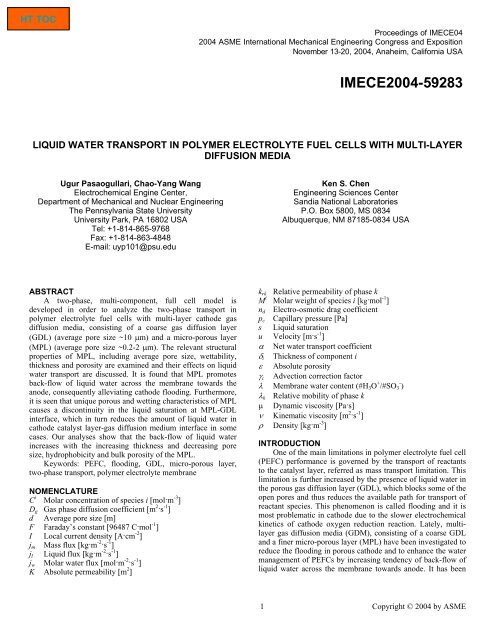
Proceed<strong>in</strong>gs of IMECE042004 ASME International Mechanical Eng<strong>in</strong>eer<strong>in</strong>g Congress and ExpositionNovember 13-20, 2004, Anaheim, California USAIMECE2004-59283LIQUID WATER TRANSPORT IN POLYMER ELECTROLYTE FUEL CELLS WITH MULTI-LAYERDIFFUSION MEDIAUgur Pasaogullari, Chao-Yang WangElectrochemical Eng<strong>in</strong>e Center,Department of Mechanical and Nuclear Eng<strong>in</strong>eer<strong>in</strong>gThe Pennsylvania State UniversityUniversity Park, PA 16802 USATel: +1-814-865-9768Fax: +1-814-863-4848E-mail: uyp101@psu.eduKen S. ChenEng<strong>in</strong>eer<strong>in</strong>g Sciences CenterSandia National LaboratoriesP.O. Box 5800, MS 0834Albuquerque, NM 87185-0834 USAABSTRACTA two-phase, multi-component, full cell model isdeveloped <strong>in</strong> order to analyze the two-phase transport <strong>in</strong>polymer electrolyte fuel cells with multi-layer cathode gasdiffusion media, consist<strong>in</strong>g of a coarse gas diffusion layer(GDL) (average pore size ~10 µm) and a micro-porous layer(MPL) (average pore size ~0.2-2 µm). The relevant structuralproperties of MPL, <strong>in</strong>clud<strong>in</strong>g average pore size, wettability,thickness and porosity are exam<strong>in</strong>ed and their effects on liquidwater transport are discussed. It is found that MPL promotesback-flow of liquid water across the membrane towards theanode, consequently alleviat<strong>in</strong>g cathode flood<strong>in</strong>g. Furthermore,it is seen that unique porous and wett<strong>in</strong>g characteristics of MPLcauses a discont<strong>in</strong>uity <strong>in</strong> the liquid saturation at MPL-GDL<strong>in</strong>terface, which <strong>in</strong> turn reduces the amount of liquid water <strong>in</strong>cathode catalyst layer-gas diffusion medium <strong>in</strong>terface <strong>in</strong> somecases. Our analyses show that the back-flow of liquid water<strong>in</strong>creases with the <strong>in</strong>creas<strong>in</strong>g thickness and decreas<strong>in</strong>g poresize, hydrophobicity and bulk porosity of the MPL.Keywords: PEFC, flood<strong>in</strong>g, GDL, micro-porous layer,two-phase transport, polymer electrolyte membraneNOMENCLATUREC i Molar concentration of species i [mol·m -3 ]D g Gas phase diffusion coefficient [m 2 ·s -1 ]d Average pore size [m]F Faraday’s constant [96487 C·mol -1 ]I Local current density [A·cm -2 ]j m Mass flux [kg·m -2 ·s -1 ]j l <strong>Liquid</strong> flux [kg·m -2 ·s -1 ]j w Molar water flux [mol·m -2 ·s -1 ]K Absolute permeability [m 2 ]k rkRelative permeability of phase kM i Molar weight of species i [kg·mol -1 ]n d Electro-osmotic drag coefficientp c Capillary pressure [Pa]s <strong>Liquid</strong> saturationu Velocity [m·s -1 ]α Net water transport coefficientδ i Thickness of component iε Absolute porosityγ c Advection correction factorλ Membrane water content (#H 3 O + /#SO - 3 )λ k Relative mobility of phase kµ Dynamic viscosity [Pa·s]ν K<strong>in</strong>ematic viscosity [m 2 ·s -1 ]ρ Density [kg·m -3 ]INTRODUCTIONOne of the ma<strong>in</strong> limitations <strong>in</strong> polymer electrolyte fuel cell(PEFC) performance is governed by the transport of reactantsto the catalyst layer, referred as mass transport limitation. Thislimitation is further <strong>in</strong>creased by the presence of liquid water <strong>in</strong>the porous gas diffusion layer (GDL), which blocks some of theopen pores and thus reduces the available path for transport ofreactant species. This phenomenon is called flood<strong>in</strong>g and it ismost problematic <strong>in</strong> cathode due to the slower electrochemicalk<strong>in</strong>etics of cathode oxygen reduction reaction. Lately, multilayergas diffusion media (GDM), consist<strong>in</strong>g of a coarse GDLand a f<strong>in</strong>er micro-porous layer (MPL) have been <strong>in</strong>vestigated toreduce the flood<strong>in</strong>g <strong>in</strong> porous cathode and to enhance the watermanagement of PEFCs by <strong>in</strong>creas<strong>in</strong>g tendency of back-flow ofliquid water across the membrane towards anode. It has been1 Copyright © 2004 by ASME
shown that highly hydrophobic MPLs usually exhibit betterperformance (Wilson et al. 1995, Qi and Kaufman 2002 andKong et al. 2002). Although the exact mechanisms are yet to befully elucidated, the performance enhancement is usuallyassociated with better water management capabilities of MPLs.The two ma<strong>in</strong> effects of improvement with MPLs are due toenhancement of water management by better humidify<strong>in</strong>g themembrane, consequently decreas<strong>in</strong>g the ohmic losses andreduc<strong>in</strong>g the flood<strong>in</strong>g <strong>in</strong> cathode, consequently improv<strong>in</strong>g thegas phase diffusion.Although several studies have been carried out to modelthe two-phase transport <strong>in</strong> PEFCs, only a few has discussed theeffects of MPL on water management and two-phase transport.Nam and Kaviany (2003) have modeled the two-phasetransport <strong>in</strong> multi-layered cathode GDM us<strong>in</strong>g the unsaturatedflow theory (UFT), which assumes the gas pressure <strong>in</strong> the GDLis constant, therefore neglects the gas flow counter to the liquidflow. They have optimized the MPL properties accord<strong>in</strong>g to thetotal liquid water <strong>in</strong> the cathode GDM, and concluded that thereis an optimum for thickness and porosity of the MPL. Mostrecently, Pasaogullari and Wang (2004a), elucidated the effectof MPL, us<strong>in</strong>g the more complete two-phase model i.e. M 2formulation, which relaxes the constant gas phase pressureassumption, hence accounts for the gas flow counter to thecapillarity-<strong>in</strong>duced liquid flow. It was <strong>in</strong>dicated for the firsttime that the build-up <strong>in</strong> liquid pressure <strong>in</strong> the cathode due tothe presence of MPL creates a hydraulic pressure differential todrive water flow back to the anode. This water back flow canbe controlled by the pore size and wettability of MPL follow<strong>in</strong>gthe capillary flow theory developed by Pasaogullari and Wang(2004b). In addition, the study of Pasaogullari and Wang(2004a) revealed a capillary-driven enhancement of oxygentransport once the two-phase zone is formed. This newenhancement mechanism is, however, over-dom<strong>in</strong>ated by the<strong>in</strong>crease <strong>in</strong> the diffusion resistance, yield<strong>in</strong>g an overallreduction <strong>in</strong> the oxygen transport limitation <strong>in</strong> most cases offlood<strong>in</strong>g. In a meet<strong>in</strong>g abstract, Weber and Newman (2003)also mentioned the positive role played by MPL to promotewater back flow through the membrane, improv<strong>in</strong>g thehumidification of the membrane as well as the anode catalystlayer, reduc<strong>in</strong>g the overall ohmic losses, hence improv<strong>in</strong>g theperformance.The aim of the present work is to present a two-phase flowmodel for the entire membrane-GDM assembly, based on theM 2 formulation (Wang and Cheng, 1997) and analyze the liquidwater transport <strong>in</strong> PEFCs with MPLs. The effects of porous andwett<strong>in</strong>g structure of MPL are also analyzed. The paper isorganized as follows: The development of the mathematicalmodel for multi-layered GDM and polymer electrolytemembrane (PEM) is presented based on the theory of liquidwater flow <strong>in</strong> hydrophobic gas diffusion layers presented byPasaogullari and Wang (2004a). Then, the liquid watertransport with MPL is compared with the conventional PEFCconfigurations and the effects of MPL properties are exam<strong>in</strong>ed.MATHEMATICAL MODELThe present study focuses on liquid water transport <strong>in</strong>porous gas diffusion anode and cathode and across themembrane. The cell is considered to be isothermal as a firstapproximation. The gas channels are excluded from themodel<strong>in</strong>g doma<strong>in</strong> by specify<strong>in</strong>g boundary conditions at the gasdiffusion media/channel <strong>in</strong>terfaces. Furthermore, catalyst layersare taken to be <strong>in</strong>f<strong>in</strong>itely th<strong>in</strong>; and hence the anode hydrogenoxidation reaction (HOR) and cathode oxygen reductionreaction (ORR) are assumed to take place at the PEM-GDM<strong>in</strong>terfaces. <strong>With</strong><strong>in</strong> these assumptions, the doma<strong>in</strong> considered isconf<strong>in</strong>ed to porous anode GDL, PEM and cathode GDM,consist<strong>in</strong>g of MPL and GDL, as shown <strong>in</strong> Figure 1 along withthe associated transport processes. Although the present modelis developed <strong>in</strong> 1-D, it can be readily implemented <strong>in</strong> a multidimensionalCFD model with the channel <strong>in</strong>corporated asshown <strong>in</strong> Pasaogullari and Wang (2004c).In this study, the multi-phase, mixture model (M 2 ) isemployed to describe the two-phase transport processes <strong>in</strong> theporous media. M 2 model is an exact reformulation of classicaltwo-phase, two-fluid models <strong>in</strong>to a s<strong>in</strong>gle equation. Unlike theunsaturated flow theory (UFT) utilized <strong>in</strong> some of the earliertwo-phase PEFC models (He et al. 2000 Nam and Kaviany2003) M 2 model does not require the assumption of a constantgas phase pressure across the porous medium, hence it alsoaccounts for the gas flow counter to the capillarity driven liquidflow. Furthermore, M 2 model<strong>in</strong>g does not require explicitlytrack<strong>in</strong>g of phase <strong>in</strong>terfaces; consequently simplifiesmathematical model<strong>in</strong>g of two-phase transport <strong>in</strong> porousmedium, where both s<strong>in</strong>gle- and two-phase regions coexist. Thereader is referred to Wang and Cheng (1997) for details of themultiphase mixture model and its applications to a number ofmultiphase transport problems <strong>in</strong> porous media.Mass conservation for the two-phase mixture <strong>in</strong> steadystateas given by M 2 formulation is:∇ ⋅ ( ρ u ) = 0(1)In the above equation; u is the superficial mixture velocity andρ is the mixture density and given as:ρ = ρl⋅ s + ρg⋅ ( 1−s)(2)where s is the liquid saturation and represents the fraction ofopen pore space of porous media occupied by liquid.When Eq. (1) is <strong>in</strong>tegrated along the GDM <strong>in</strong> steady-state: ρ u =(3)where jmj m<strong>in</strong>dicates the net mass flux through the porous media,and correspond<strong>in</strong>g expressions for each <strong>in</strong>dividual layers aregiven <strong>in</strong> Table 1.The species conservation equation of M 2 formulation, whenwritten <strong>in</strong> terms of molar concentrations is (Pasaogullari andWang, 2004a):⎡⎛i i⎞ ⎤ieff iC ∇ ⋅ ( ) = ∇ ⋅ ( i ,∇ ) − ∇ ⋅ ⎢⎜mflgγ− ⎟cuCDgCgjil ⎥(4)⎢⎣⎝ M ρg⎠ ⎥⎦where the advection correction factor is:⎧ ⎛H 2Oρ⎞⎪ ⎜λlCsat+ λ ⎟ for waterH O⎪H O g22C= ⎝ M ρ ⎠(5)gγi ⎨⎪ ρλg⎪for other species⎩ρ( 1−s)In Eq. (4), C i denotes the total molar concentration of species i<strong>in</strong> liquid and gas phases, def<strong>in</strong>ed as:ii iC = ( 1 − s) Cg+ sC(6)lThe gas-phase diffusion coefficient,i effD , is corrected forgtortuosity and reduction <strong>in</strong> the open pore space due to presenceof liquid water via Bruggeman correlation, i.e.:2 Copyright © 2004 by ASME
shown <strong>in</strong> Figure 2. Therefore, the membrane water content iscalculated by:23⎧1.4089+ 11.263a−18.768a+ 16.209a⎪H O(23)2λ = ⎨if C ≤ Csat⎪H2O⎩10.1129( 1−s)+ 16sif C > CsatIn Eq. (21), K mem is the membrane hydraulic permeability andn d is the electro-osmotic drag coefficient. When <strong>in</strong>tegratedalong the membrane thickness, Eq. (21) becomes:Kmemw w I − ∇pl− Dm∇Cm+ nd= j(24)H Owνl⋅ M 2FThe values reported <strong>in</strong> the literature for hydraulicpermeability of membrane show a great variation. It is reportedbetween 1.8·10 -18 m 2 (Bernardi and Verbrugge, 1992) to 2·10 -20m 2 (Meier and Eigenberger, 2004), for Nafion® basedmembranes humidified with liquid water. In this work, we usethe latest available data from Meier and Eigenberger, which is2·10 -20 m 2 for a membrane fully humidified with liquid water at80ºC (i.e. λ=16).Here, the diffusion coefficient of water <strong>in</strong> the membrane istaken from Motupally et. al. (2000) and is given as:−70.28λ−1346 / T⎪⎧w3.1⋅10λ( e −1)e 0 < λ ≤ 3D = ⎨(25)m−8−λ−1346 / T⎪⎩ 4.17⋅10λ( 1+161e) e 3 ≤ λ < 17<strong>in</strong> m 2 /s.Boundary ConditionsIn this work, we assume that the gas channels are free ofliquid water. Furthermore, gas diffusion media for both anodeand cathode are saturated with water vapor; therefore the waterconcentration at the GDM-gas channel <strong>in</strong>terface is equal to thesaturation concentration, therefore the liquid saturation at these<strong>in</strong>terfaces is zero.s ( x = 0 ) = s A −GC/ GDL= 0(26)s( x = δMEA) = s C −GC/ GDL= 0(27)Consequently, the capillary pressures at these <strong>in</strong>terfaces arealso zero, and the gas phase pressure is equal to the channelpressure.p x = 0 = p(28)gg( )A( xMEA) pCp = δ =(29)Numerical ProcedureThe given model is solved for three different regions,namely anode GDL, PEM and cathode GDM, simultaneously.As shown <strong>in</strong> Table 1, the fluxes are all function of net watertransport coefficient, α, which is not known <strong>in</strong>itially. Therefore,an iterative procedure is used to determ<strong>in</strong>e α. An <strong>in</strong>itial guess isprovided for α, and this guess is improved <strong>in</strong> consecutiveiterations us<strong>in</strong>g bisection method until water content of themembrane converges to the given accuracy. A relative errormarg<strong>in</strong> of 10 -7 <strong>in</strong> water content is set for convergence criteria,which requires around 25 iterations for obta<strong>in</strong><strong>in</strong>g α up to 8-digit accuracy. The govern<strong>in</strong>g equations of water transport arenon-l<strong>in</strong>ear ord<strong>in</strong>ary differential equations, which are solvedus<strong>in</strong>g a 4 th order adaptive step Runge-Kutta method.RESULTS AND DISCUSSIONEffect of Micro-Porous LayerIn order to analyze the effect of MPL on liquid watertransport <strong>in</strong> PEFC, four different GDM configurations areanalyzed. These configurations are achieved by vary<strong>in</strong>g theanode and cathode GDM. Both of the anode and cathode GDLproperties are selected from values of carbon paper. Two of theconfigurations have hydrophobic GDL <strong>in</strong> the anode (wetproofed,θ c =110º), and the other two have hydrophilic GDL(not wet-proofed, θ c =70º). In all cases, cathode GDL is wetproofedand <strong>in</strong> two of the cases cathode GDL is coated withMPL. The MPL properties used here are taken from the basecase, as well as for the analyses <strong>in</strong> the next sections. Theproperties of the materials used here are given <strong>in</strong> Table 2, alongwith the associated transport parameters.In Figure 3, the variation of net water transport coefficientwith current density is given for all these cases. Note that, netwater transport coefficient, α is def<strong>in</strong>ed as the number of watermolecules transported per proton across the membrane,therefore when α is positive, the net water transport across themembrane is towards cathode.Hj 2 Omem⋅ Fα =(30)IIt is seen that the net water transport coefficient profiledoes not follow a s<strong>in</strong>gle trend across the entire current densityrange. Around α=0, a change <strong>in</strong> the trend is visible and this isdue to the change <strong>in</strong> the anode water transport phenomena atα=0. When α is less than zero, there is a net water transporttowards the anode, and s<strong>in</strong>ce the anode is already humidified,there is liquid water <strong>in</strong> the anode GDL and water transport <strong>in</strong>the anode GDL is governed by the capillary force. However,when α is positive, net water transport across the anode GDL istowards the membrane, and it is governed by the gas phasediffusion of the water vapor, which is much stronger than thecapillary transport of water.It is clearly seen <strong>in</strong> all cases that, the use of a hydrophilicGDL <strong>in</strong> anode side decreases the water flux towards anode onlywhen α0,s<strong>in</strong>ce the gas diffusion is the only mode of water transport <strong>in</strong>the anode GDL, no effect of anode GDL wettability is seen.It is also evident from Figure 3 that the net water transportcoefficient <strong>in</strong>creases with <strong>in</strong>creas<strong>in</strong>g current density. Inmembrane, the electro-osmotic drag of water is <strong>in</strong> counterdirectionto convective and diffusive transport of water.Electro-osmotic drag is towards cathode due to proton flux, andconvective and diffusive transport of water is towards anode4 Copyright © 2004 by ASME
s<strong>in</strong>ce liquid pressure and water content is higher <strong>in</strong> the cathodeside of the membrane than the anode side. Therefore, with<strong>in</strong>creas<strong>in</strong>g current density, the electro-osmotic drag <strong>in</strong>creasesand starts to dom<strong>in</strong>ate over the convective and diffusivetransport of water across the membrane, result<strong>in</strong>g <strong>in</strong> <strong>in</strong>creas<strong>in</strong>gnet water transport coefficient with <strong>in</strong>creas<strong>in</strong>g current density.When cathode GDL is coated with MPL, it is seen that watertransport towards anode is significantly <strong>in</strong>creased and this<strong>in</strong>crease is clearly visible at the entire current density range.In Figure 4, the liquid pressure profiles <strong>in</strong> all fourconfigurations are shown at a current density of 0.1 A/cm 2 . Inthis current density, all four configurations result <strong>in</strong> two-phasetransport <strong>in</strong> both the anode and the cathode GDM. The <strong>in</strong>set ofthe figure shows the details of liquid pressure across themembrane. As stated above, the liquid pressure differentialacross the membrane is higher when anode GDL is hydrophilic.However, this difference becomes less significant whencathode GDL is coated with MPL. Due to its smaller pore size,MPL has much smaller permeability; therefore, liquid waterflow requires higher pressure differential across the MPL,<strong>in</strong>creas<strong>in</strong>g liquid pressure on the cathode side of the membrane.Here, the permeability of MPL is calculated from the follow<strong>in</strong>gexpression given by Rumpf and Gutte (Kaviany, 1995) forpacked beds with narrow range of distribution <strong>in</strong> size:5.52K = ε d(31)5.6where d is the average pore diameter. For an MPL of mean poresize of 1 µm and porosity of 0.5, this expression gives apermeability of 3.95·10 -15 m 2 , which is comparable withexperimentally measured values.Figure 5 shows the liquid saturation profiles <strong>in</strong> anode andcathode GDM at the same current density. It is seen that theliquid saturation <strong>in</strong> cathode GDL is decreased by use of anMPL due to decreased cathode water flux. It is also seen <strong>in</strong>cathode GDM, there is a discont<strong>in</strong>uity <strong>in</strong> the liquid saturationprofile at the GDL-MPL <strong>in</strong>terface. This discont<strong>in</strong>uity isgoverned by the cont<strong>in</strong>uity of phase pressures at this <strong>in</strong>terface.S<strong>in</strong>ce both gas and liquid pressures are cont<strong>in</strong>uous at this<strong>in</strong>terface, the capillary pressure is also cont<strong>in</strong>uous. Follow<strong>in</strong>gthe def<strong>in</strong>ition of capillary pressure <strong>in</strong> Eq. (13), one has thefollow<strong>in</strong>g relation for pressure cont<strong>in</strong>uity at the GDL-MPL<strong>in</strong>terface.GDL1 2MPL1 2GDL ⎛ ε ⎞GDLMPL ⎛ ε ⎞MPL( ) ⎜ ⎟ J ( s ) = cos( θ ) ⎜ J ( s )cos θcGDL <strong>in</strong>tcMPL <strong>in</strong>tK⎜ K ⎟ (32)⎜ ⎟⎝ ⎠⎝ ⎠It is clear that this discont<strong>in</strong>uity is a function of wett<strong>in</strong>gand porous characteristics of MPL and GDL, as well as theliquid flux <strong>in</strong> the cathode. Due to this discont<strong>in</strong>uity, liquidsaturation <strong>in</strong> cathode catalyst layer-GDM <strong>in</strong>terface may also besmaller than s<strong>in</strong>gle-layer configurations depend<strong>in</strong>g on themicro-structure of MPL; therefore catalyst layer flood<strong>in</strong>g canalso be reduced with MPL.It is also seen from Figure 5 that when hydrophilic GDL isused <strong>in</strong> anode, the liquid saturation <strong>in</strong> the anode GDL <strong>in</strong>creases,which is particularly due to smaller capillarity effects <strong>in</strong>hydrophilic GDL. It has been shown that capillary watertransport is stronger <strong>in</strong> hydrophobic GDLs than hydrophilicGDLs, particularly at lower liquid saturations (Pasaogullari andWang, 2004).Similar water transport characteristics that are observedwith MPLs can also be achieved by adjust<strong>in</strong>g the operat<strong>in</strong>gconditions, such as us<strong>in</strong>g higher cathode and lower anodepressures. Particularly, operat<strong>in</strong>g with pressure differentials hasbeen shown to significantly improve the performance (Voss etal., 1995, Jannsen and Overvelde, 2001, Beattie et al. 1999). Inall these examples, an <strong>in</strong>creased pressure differential across themembrane is formed to enhance the back-flux (i.e. towardsanode) of water, similar to what MPL causes.Effect of MPL ThicknessThe effect of the thickness of the MPL is analyzed us<strong>in</strong>gthe model expla<strong>in</strong>ed <strong>in</strong> the earlier sections. The parametersused for this case are the same as <strong>in</strong> Table 2, except that thethickness of the MPL is varied between 10 µm and 50 µm. Asseen <strong>in</strong> Figure 6, the net water transport coefficient is a strongfunction of MPL thickness. As the MPL thickness <strong>in</strong>creases,the net water transport coefficient curve shifts downwards<strong>in</strong>dicat<strong>in</strong>g that the water flux towards the anode is <strong>in</strong>creas<strong>in</strong>g.<strong>With</strong> <strong>in</strong>creas<strong>in</strong>g MPL thickness, the resistance to liquid waterflow <strong>in</strong> the cathode GDM <strong>in</strong>creases, and this <strong>in</strong>creasedresistance causes the fraction of water transported through themembrane towards anode to <strong>in</strong>crease, hence results <strong>in</strong> adecrease <strong>in</strong> cathode water flux. Inset of the Figure 6 shows thechange of net water transport coefficient with MPL thickness atseveral current densities. It is seen that the thickness of theMPL is particularly effective at lower current densities due tosmaller electro-osmotic drag flux.Effect of Mean Pore Size of MPLFigure 7 shows the net water transport coefficient acrossthe membrane for different mean pore sizes of MPL. Here, theproperties of the MPL are taken from the base case, which aregiven <strong>in</strong> Table 2 except for the mean pore size. The net watertransport curve shifts downwards with decreas<strong>in</strong>g mean poresize, <strong>in</strong>dicat<strong>in</strong>g <strong>in</strong>creas<strong>in</strong>g water flux towards anode. Thepermeability of MPL decreases with the pore size (see Eq.(31)), which <strong>in</strong>creases the resistance to water flow towardscathode channel. Therefore, water tends to flow <strong>in</strong> the pathwhich has smaller resistance, which <strong>in</strong> turn <strong>in</strong>creases the flowrate towards anode. This effect obviously is much more visible<strong>in</strong> lower current densities, where back-flux of water isdom<strong>in</strong>at<strong>in</strong>g over the electro-osmotic drag. As the currentdensity <strong>in</strong>creases, the electro-osmotic drag of water across themembrane becomes larger, dim<strong>in</strong>ish<strong>in</strong>g the effect of MPL. Asseen <strong>in</strong> the <strong>in</strong>set of Figure 7, the effect of the mean pore size ofMPL starts to disappear for larger pore sizes as the MPLpermeability becomes closer to GDL permeability. As theabsolute permeability is directly proportional to the square ofthe mean pore size (Eq. (31)), liquid pressure differential acrossthe MPL is magnified with decreas<strong>in</strong>g pore size. This <strong>in</strong>crease<strong>in</strong> the MPL pressure differential causes a higher pressuredifferential across the membrane, caus<strong>in</strong>g higher back-flux ofwater towards anode.It is evident that smaller pore size <strong>in</strong> MPL is <strong>in</strong>creas<strong>in</strong>g thetendency of liquid water flow towards anode. However,smallest pore size is probably not the optimal design, thus thegas phase transport will be hampered with the decreas<strong>in</strong>g poresizes. The gas-phase transport is most likely to be <strong>in</strong> theKnudsen regime <strong>in</strong> MPL due to the much smaller pore sizes. InKnudsen regime, the wall-to-molecule <strong>in</strong>teractions dom<strong>in</strong>atesover the molecule-to-molecule <strong>in</strong>teractions, and the pore sizebecomes the most important factor for gas diffusion. On the5 Copyright © 2004 by ASME
and water-saturation distribution <strong>in</strong> s<strong>in</strong>gle- and two-layerPEMFC diffusion medium,” Int. J. Heat and Mass Tr., Vol. 46,4595-4611.Pasaogullari, U. and Wang, C.Y., 2004, Two-Phase<strong>Transport</strong> and the Role of Micro-Porous Layer <strong>in</strong> <strong>Polymer</strong><strong>Electrolyte</strong> <strong>Fuel</strong> <strong>Cells</strong>,” Electrochim. Acta, Vol. 49, 4359-4369.Pasaogullari, U. and Wang, C.Y., 2004, “<strong>Liquid</strong> <strong>Water</strong><strong>Transport</strong> <strong>in</strong> Gas Diffusion Layer of <strong>Polymer</strong> <strong>Electrolyte</strong> <strong>Fuel</strong><strong>Cells</strong>,” J. Electrochem. Soc., Vol. 151, pp. A399-A406.Pasaogullari, U. and Wang, C.Y., 2004, “Two-PhaseModel<strong>in</strong>g and Flood<strong>in</strong>g Prediction of <strong>Polymer</strong> <strong>Electrolyte</strong> <strong>Fuel</strong><strong>Cells</strong>,” J. Electrochem. Soc., <strong>in</strong> press.Qi, Z. and Kaufman, A., 2002, “Improvement of watermanagement by a microporous sublayer for PEM fuel cells,” J.Power Sources, Vol. 109, pp. 38-46.Spr<strong>in</strong>ger, T.E., Wilson, M.S., and Gottesfeld, S., 1991,“<strong>Polymer</strong> <strong>Electrolyte</strong> <strong>Fuel</strong> Cell Model”, J. Electrochem. Soc.,Vol. 136, pp. 2334-2342.Voss, H.H., Wilk<strong>in</strong>son, D.P., Pickup, P.G., Johnson, M.C.and Basura, V. 1995, “Anode water removal: a watermanagement and diagnostic technique for solid polymer fuelcells,” Electrochim. Acta, Vol. 40, pp. 321-328.Wang, C.Y. and Cheng, P., 1997, “<strong>Multi</strong>phase Flow andHeat Transfer <strong>in</strong> Porous Media,” Advances <strong>in</strong> Heat Transfer,Vol. 30. pp. 93-196.Weber, A. and Newman, J., Abstract Nr: 1038 204 thElectrochemical Society Meet<strong>in</strong>g, October 12-16, 2003,Orlando, Florida.Wilson, M.S., Valerio, J.A. and Gottesfeld, S., 1995, “Lowplat<strong>in</strong>um load<strong>in</strong>g electrodes for polymer electrolyte fuel cellsfabricated us<strong>in</strong>g thermoplastic ionomers,” Electrochim. Acta,Vol. 40, pp. 355-363.Zawodzisnki, T.A., Spr<strong>in</strong>ger, T.E., Uribe, F. andGottesfeld S., 1993, “Characterization of polymer electrolytesfor fuel cell applications,” Solid State Ionics, Vol. 60, pp. 199-211.Zawodzisnki, T.A., Davey, J., Valerio, J. and Gottesfeld S.,1995, “The water content dependence of electro-osmotic drag<strong>in</strong> proton-condut<strong>in</strong>g polymer electrolytes,” Electrochim. Acta,Vol. 40, pp. 297-302.Table 2 Material properties, transport parameters and operat<strong>in</strong>gconditionsParameterValue<strong>Transport</strong> parametersSurface tension, σ0.0625 N/mAnode gas k<strong>in</strong>ematic viscosity, ν g,a4.45×10 -5 m 2 /sCathode gas k<strong>in</strong>ematic viscosity, ν g,c1.78×10 -5 m 2 /s<strong>Liquid</strong> k<strong>in</strong>ematic viscosity, ν l3.52×10 -7 m 2 /s<strong>Liquid</strong> density, ρ l974.85 kg/m 3Material propertiesGDL absolute permeability, K GDL 8.7×10 -12 m 2GDL porosity, ε GDL0.7Hydrophobic GDL contact angle, θ c110ºHydrophilic GDL contact angle, θ c70ºAnode GDL thickness, δ AGDL 300 µmCathode gas diffusion medium thickness, δ C 300 µmMembrane thickness (Nafion® 112), δ mem 50.8 µmMembrane hydraulic permeability, K mem 2×10 -20 m 2Base case MPL propertiesThickness, δ MPL 30 µmPorosity, ε MPL0.5Average pore size, d MPL1000 nmAbsolute permeability, K MPL 3.95×10 -15 m 2Contact angle, (θ c ) MPL120ºOperat<strong>in</strong>g ConditionsCell temperature, T353.15 KAnode channel pressure, p A1.5 atmCathode channel pressure, p C1.5 atmAnode GDL PEM MPL Cathode GDLElectroosmotic<strong>Liquid</strong> Flow<strong>Liquid</strong> FlowDragGas FlowGas FlowxTable 1 Mass and water flux for <strong>in</strong>dividual layers of PEFCMass Flux, j m<strong>Water</strong> Flux, j wH2I ⎛ MH O⎞I2Anode⎜ + α M⎟αGDLF ⎝ 2 ⎠FIMembrane N/A αFO2I ⎡ M⎤Cathode⎛ 1 ⎞ H O I ⎛ 1 ⎞2⎢−+ ⎜α+ ⎟M⎥ ⎜α + ⎟GDL/MPL F ⎣ 4 ⎝ 2 ⎠ ⎦ F ⎝ 2 ⎠Gas and <strong>Liquid</strong> Pressure<strong>Liquid</strong> FlowGas PressureGas Flow<strong>Liquid</strong> Flow<strong>Liquid</strong>PressureGas FlowxFigure 1 Schematics of model<strong>in</strong>g doma<strong>in</strong>, transport phenomenaand <strong>in</strong>dividual phase pressure profiles <strong>in</strong> PEFCs with microporouslayers7 Copyright © 2004 by ASME
175170Configuration 1Configuration 2Configuration 3Configuration 4<strong>Liquid</strong> pressure [kPa]1651601551501450 0.25 0.5 0.75 010.25 0.5 0.75 10 0.25 0.5 0.75 1Anode GDMPEMCathode GDMDimensionless distance along the cell thicknessFigure 2 Membrane water uptake. Symbols are experimentalmeasurements of Zawodz<strong>in</strong>ski et al. for Nafion® membranes at80ºC.Figure 4 <strong>Liquid</strong> pressure profiles across the cell thickness fordifferent GDM configurations at 1.5 A/cm 2 . For configurationand material properties, refer to Figure 2. Inset shows thedetails of liquid pressure across the membrane.Net water transport coefficient, α0.20.150.10.050-0.05-0.1-0.15-0.2Configuration 1Configuration 2Configuration 3Configuration 4Configuration 1:Anode: Hydrophobic GDL/Cathode: Hydrophobic GDLConfiguration 2:Anode: Hydrophilic GDL/Cathode: Hydrophobic GDLConfiguration 3:Anode: Hydrophobic GDL/Cathode: Hydrophobic GDL+MPLConfiguration 4:Anode: Hydrophilic GDL/Cathode: Hydrophobic GDL+MPLα0.050-0.05-0.10.1 0.2 0.3I[A/cm 2 ]0.5 1 1.5 2Current density, I [A/cm 2 ]<strong>Liquid</strong> saturation, s0.050.040.030.020.01Configuration 1Configuration 2Configuration 3Configuration 400 0.25 0.5 0.75 010.25 0.5 0.75 10 0.25 0.5 0.75 1Anode GDMPEMCathode GDMDimensionless distance along the cell thicknessFigure 3 Net water transport coefficient, α for different GDMconfigurations. MPL properties are taken from base case given<strong>in</strong> Table 2. Inset shows the enlarged view at lower currentdensities.Figure 5 <strong>Liquid</strong> saturation profiles across the GDM/MEAthickness for different MEA thickness at 1.5 A/cm 2 . Theconfiguration details are given <strong>in</strong> Figure 2.8 Copyright © 2004 by ASME