Opportunities for California Green Companies in Brazil - Brazil-US ...
Opportunities for California Green Companies in Brazil - Brazil-US ...
Opportunities for California Green Companies in Brazil - Brazil-US ...
- No tags were found...

Create successful ePaper yourself
Turn your PDF publications into a flip-book with our unique Google optimized e-Paper software.
<strong>Opportunities</strong> <strong>for</strong> Cali<strong>for</strong>nia<strong>Green</strong> <strong>Companies</strong> <strong>in</strong> <strong>Brazil</strong>San Jose Chamber of CommerceCity of San JoseBay <strong>Brazil</strong><strong>Brazil</strong>- U.S. Bus<strong>in</strong>ess CouncilCarlos Senna FigueiredoNational Confederation of IndustrySan Jose, Cali<strong>for</strong>nia, February 13, 2012
Contents•<strong>Brazil</strong>ian energy outl<strong>in</strong>e•The ma<strong>in</strong>stream of renewablesW<strong>in</strong>d energyBiomass energyHydro•Entrances to the energy marketEnergy auctionsEquitiesEquipment & services supply•The <strong>for</strong>thcom<strong>in</strong>g sourcesSolar energySea wave energy•Foreign companies <strong>in</strong> the energy sector•Why <strong>in</strong>vest <strong>in</strong> the Country, particularly <strong>in</strong> energy ?•How to enter the regulated electricity market <strong>in</strong> <strong>Brazil</strong> ?OPPORTUNITIES POTENTIAL ANDFOR OPPORTUNITIES CALIFORNIA GREEN IN BRAZILIAN COMPANIESRENEWABLE IN BRAZIL ENERGY
Primary Energy ProductionSource: BEN 2011, MMEOPPORTUNITIES POTENTIAL ANDFOR OPPORTUNITIES CALIFORNIA GREEN IN BRAZILIAN COMPANIESRENEWABLE IN BRAZIL ENERGY
F<strong>in</strong>al Energy ConsumptionSource: BEN 2011, MMEOPPORTUNITIES POTENTIAL ANDFOR OPPORTUNITIES CALIFORNIA GREEN IN BRAZILIAN COMPANIESRENEWABLE IN BRAZIL ENERGY
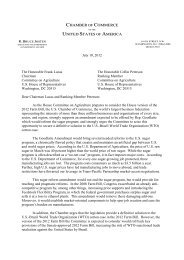
F<strong>in</strong>al Consumption by SectorAgriculture4%EnergySector11%Commercial3%Residential11%PublicServices2%Transport31%Industry38%10 6 toeSector 2010 2009 Δ 10/09Industry 86 76 12,1%Transport 69 63 10,8%Energy Sector 25 24 3,8%Residential 24 23 1,9%Agriculture 10 9 4,8%Commercial 7 6 4,5%Public Services 4 4 -2,1%Total 224 206 8,7%Source: BEN 2011, MMEOPPORTUNITIES POTENTIAL ANDFOR OPPORTUNITIES CALIFORNIA GREEN IN BRAZILIAN COMPANIESRENEWABLE IN BRAZIL ENERGY
Hydropower: a Paramount Renewable <strong>in</strong> Electricity SupplySource: BEN 2011, MMEOPPORTUNITIES POTENTIAL ANDFOR OPPORTUNITIES CALIFORNIA GREEN IN BRAZILIAN COMPANIESRENEWABLE IN BRAZIL ENERGY
Grid Electricity Consumption (TWh)Sector 2011 2020Annual averagegrowth (%)ResidentialIndustryCommercialOthersTotal112,7 166,9 4,5193,4 283,7 4,474,1 123,8 6,261,2 84,7 3,7441,4 659,1 4,6Source: PDE 2020, EPEOPPORTUNITIES POTENTIAL ANDFOR OPPORTUNITIES CALIFORNIA GREEN IN BRAZILIAN COMPANIESRENEWABLE IN BRAZIL ENERGY
Electricity Generation Installed CapacitySource: BEN 2011, MMEOPPORTUNITIES POTENTIAL ANDFOR OPPORTUNITIES CALIFORNIA GREEN IN BRAZILIAN COMPANIESRENEWABLE IN BRAZIL ENERGY
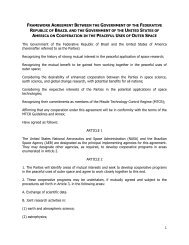
Power Plants <strong>in</strong> OperationBiomass7%Coal1%Nuclear2%Oil6%W<strong>in</strong>d1%Importedenergy7%Source Quantity Capacity(GW)Share (%)Hydro 966 82.3 65.7Natural Gas 140 13.2 10.6Oil 924 7.0 5.6Biomass 427 9.0 7.2Nuclear 2 2.0 1.6Hydro66%Coal 10 1.9 1.6W<strong>in</strong>d 72 1.5 1.2NaturalGas10%Solar PV 6 0.001 -Imported energy - 8.20 6.5Total 2,547 125.1 100Source: ANEELOPPORTUNITIES POTENTIAL ANDFOR OPPORTUNITIES CALIFORNIA GREEN IN BRAZILIAN COMPANIESRENEWABLE IN BRAZIL ENERGY
Power Plants under ConstructionThermal17%Nuclear5%W<strong>in</strong>d3% Small hydro2%Source Quantity Capacity(GW)Small hydro (lessthan 1 MW)Share (%)1 0.001 0,0%W<strong>in</strong>d 30 0.8 2.8Small hydro (1 to 30MW)50 0.6 2.4Hydro 12 19.7 73.0Thermal 41 4.5 16.8Nuclear 1 1.4 5.0Hydro73%Total 135 27.0 100Source: ANEELOPPORTUNITIES POTENTIAL ANDFOR OPPORTUNITIES CALIFORNIA GREEN IN BRAZILIAN COMPANIESRENEWABLE IN BRAZIL ENERGY
Annual Growth of Generat<strong>in</strong>g Capacity (MW)Year Thermal BiomassSmall hydro(1 to 30 MW)HydroW<strong>in</strong>d2002 1,555 367 56 2,662 -2003 1,141 365 268 2,216 -2004 2,944 76 68 1,140 72005 490 76 126 1,733 -2006 490 76 228 2,387 2082007 643 201 253 2,215 102008 611 633 643 180 892009 1,069 1,155 463 602 2672010 2,013 1,750 471 1,590 3262011 1,207 925 428 1,143 458Source: ANEELOPPORTUNITIES POTENTIAL ANDFOR OPPORTUNITIES CALIFORNIA GREEN IN BRAZILIAN COMPANIESRENEWABLE IN BRAZIL ENERGY
Evolution of Installed Capacity (MW)Source 2012 2013 2014 2015 2016 2017 2018 2019 2020Hydro a 86,741 88,966 89,856 94,053 94,053 104,415 109,412 111,24 115,123Uranium 2,007 2,007 2,007 2,007 2,007 3,412 3,412 3,412 3,412Natural Gas 10,184 11,309 11,309 11,659 11,659 11,659 11,659 11,659 11,659Coal 3,205 3,205 3,205 3,205 3,205 3,205 3,205 3,205 3,205Fuel Oil 5,172 8,790 8,790 8.790 8,790 8,790 8,790 8,790 8,790Diesel Oil 1,471 1,471 1,471 1.121 1,121 1,121 1,121 1,121 1,121Process gas 686 686 686 686 686 686 686 686 686Small hydro plant 4,230 4,376 4,633 4,957 4,957 5,457 5,737 6,047 6,447Biomass 6,272 6,681 7,053 7,353 7,353 8,003 8,333 8,703 9,163W<strong>in</strong>d energy 3,224 5,272 6,172 7,022 7,022 8,682 9,532 10,532 11,532Total b 123,192 132,763 135,182 140,853 140,853 155,430 161,887 165,779 171,138Source: PDE 2020, EPENotes: Values as of December of each yeara) excludes Itaipu supply to Paraguayb) excludes own generationOPPORTUNITIES POTENTIAL ANDFOR OPPORTUNITIES CALIFORNIA GREEN IN BRAZILIAN COMPANIESRENEWABLE IN BRAZIL ENERGY
Total Hydro Storage Capacity (average GW)Source: PDE 2020, EPEOPPORTUNITIES POTENTIAL ANDFOR OPPORTUNITIES CALIFORNIA GREEN IN BRAZILIAN COMPANIESRENEWABLE IN BRAZIL ENERGY
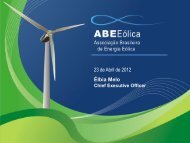
Expansion of Renewable Energy SourcesInstalled CapacityDistribution (MW)5,0004,5004,0003,5003,0002,5002,0001,5001,0005001,795Expansion <strong>in</strong>contract7.196 MW2,7982,6031,530 1,473Planned expansion10.813 MW1,290Biomass4,7GW15%SmallHydro2,6GW26%1,520 1,460Planned + Contract Expansion1,6801,860W<strong>in</strong>dEnergy10,7GW59%0Source: PDE 20202011 - EPE 2012 2013 2014 2015 2016 2017 2018 2019 2020OPPORTUNITIES POTENTIAL ANDFOR OPPORTUNITIES CALIFORNIA GREEN IN BRAZILIAN COMPANIESRENEWABLE IN BRAZIL ENERGY
Energy SupplyRenewable versus non-renewable energy (%)Non-renewable EnergyRenewable energy201154.5% 45.5%201553.0%47.0%202053.8%46.2%Source: PDE 2020, EPEOPPORTUNITIES POTENTIAL ANDFOR OPPORTUNITIES CALIFORNIA GREEN IN BRAZILIAN COMPANIESRENEWABLE IN BRAZIL ENERGY
Kaya Identity Factor: CO 2 Intensity of Energy Use(tons per billion Btu)Country/Year 2008 2020 2035United States 58.3 55.1 55.3Canada 41.6 37.2 36.2Ch<strong>in</strong>a 79.3 72.1 70.3India 68.1 62.6 62.4<strong>Brazil</strong> 33.1 32.4 32.4World 59.8 56.8 56.2Source: International Energy Outlook 2011, DOE/EIAOPPORTUNITIES POTENTIAL ANDFOR OPPORTUNITIES CALIFORNIA GREEN IN BRAZILIAN COMPANIESRENEWABLE IN BRAZIL ENERGY
World Electricity Generation by Source (Million GWh)14.012.010.08.06.04.02.00.02008 2015 2020 2025 2030 2035Liquids Nuclear Natural gas Renewables CoalSource: International Energy Outlook 2011, EIAOPPORTUNITIES POTENTIAL ANDFOR OPPORTUNITIES CALIFORNIA GREEN IN BRAZILIAN COMPANIESRENEWABLE IN BRAZIL ENERGY
Electricity Generation <strong>in</strong> <strong>Brazil</strong> by Source (Million GWh)0.800.700.600.500.400.300.200.100.002008 2015 2020 2025 2030 2035Liquids Coal Other renewables Nuclear Natural gas HydropowerSource: International Energy Outlook 2011, EIADOING POTENTIAL OPPORTUNITIES B<strong>US</strong>INESS ANDFOR OPPORTUNITIES INCALIFORNIA BRAZIL: HOW GREEN INTO BRAZILIAN COMPANIES FORM PARTNERSHIPS RENEWABLE IN BRAZIL IN ENERGY THE ENERGY SECTOR
W<strong>in</strong>d Energy
Projection of W<strong>in</strong>d Energy Generat<strong>in</strong>g Capacity (GW)CountryInstalledcapacity <strong>in</strong>2008Installedcapacity <strong>in</strong>2035W<strong>in</strong>d-powered<strong>in</strong>stalledcapacity <strong>in</strong> 2008W<strong>in</strong>d-powered<strong>in</strong>stalled capacity<strong>in</strong> 2035United States 1,009 1,221 25 57Canada 128 180 2 17Ch<strong>in</strong>a 797 1,817 12 156India 177 411 10 24<strong>Brazil</strong> 104 242 - 4World 4,623 7,272 121 533Source: Source: International Energy Outlook 2011, EIAW<strong>in</strong>d EnergyDOING POTENTIAL OPPORTUNITIES B<strong>US</strong>INESS ANDFOR OPPORTUNITIES INCALIFORNIA BRAZIL: HOW GREEN INTO BRAZILIAN COMPANIES FORM PARTNERSHIPS RENEWABLE IN BRAZIL IN ENERGY THE ENERGY SECTOR
Share of W<strong>in</strong>d Generation <strong>in</strong> Total Electricity Generation (TWh)CountryW<strong>in</strong>d-poweredgeneration <strong>in</strong>2008Share <strong>in</strong> totalCountrygeneration (%)W<strong>in</strong>d-poweredgeneration <strong>in</strong>2035Share <strong>in</strong> totalCountrygeneration (%)United States 56 1.4% 163 3.2%Canada 4 0.6% 46 5.1%Ch<strong>in</strong>a 12 0.4% 447 4.7%India 13 1.7% 56 2.6%<strong>Brazil</strong> 1 0.2% 9 0.8%World 210 1.1% 1,462 4.2%Source: Source: International Energy Outlook 2011, EIAW<strong>in</strong>d EnergyOPPORTUNITIES POTENTIAL ANDFOR OPPORTUNITIES CALIFORNIA GREEN IN BRAZILIAN COMPANIESRENEWABLE IN BRAZIL ENERGY
Growth of World W<strong>in</strong>d Energy Generat<strong>in</strong>g CapacitySource: 2010 Survey of Energy Resources, World Energy CouncilW<strong>in</strong>d EnergyOPPORTUNITIES POTENTIAL ANDFOR OPPORTUNITIES CALIFORNIA GREEN IN BRAZILIAN COMPANIESRENEWABLE IN BRAZIL ENERGY
Onshore W<strong>in</strong>d Energy Generation CostSource: 2010 Survey of Energy Resources, World Energy CouncilW<strong>in</strong>d EnergyOPPORTUNITIES POTENTIAL ANDFOR OPPORTUNITIES CALIFORNIA GREEN IN BRAZILIAN COMPANIESRENEWABLE IN BRAZIL ENERGY
Source: PNE 2030, EPEW<strong>in</strong>d EnergyOPPORTUNITIES POTENTIAL ANDFOR OPPORTUNITIES CALIFORNIA GREEN IN BRAZILIAN COMPANIESRENEWABLE IN BRAZIL ENERGY
Biomass energy
Sugar Cane Energy1 ton ofsugar cane1718x10³kcal1/3 >> sugar cane juice(sugar and ethanol)1/3 >> bagasse(biolectricity)1/3 >> straw (compost andbioeletricity)1 barrel of oil = 1386 x10³ KcalIn primary energy1 ton of sugar cane = 1,2 barrel of oil equivalent1 ton of sugar cane = <strong>US</strong>$ 201 barrel of oil = <strong>US</strong>$ 120Source: União da Indústria de Cana-de-açúcar (UNICA)BiomassenergyOPPORTUNITIES POTENTIAL ANDFOR OPPORTUNITIES CALIFORNIA GREEN IN BRAZILIAN COMPANIESRENEWABLE IN BRAZIL ENERGY
Projection of Sugar Cane Total DemandSource: PDE 2020, EPEBiomassenergyOPPORTUNITIES POTENTIAL ANDFOR OPPORTUNITIES CALIFORNIA GREEN IN BRAZILIAN COMPANIESRENEWABLE IN BRAZIL ENERGY
Estimates of Production ExpansionSource: União da Indústria de Cana-de-açúcar (UNICA)BiomassenergyOPPORTUNITIES POTENTIAL ANDFOR OPPORTUNITIES CALIFORNIA GREEN IN BRAZILIAN COMPANIESRENEWABLE IN BRAZIL ENERGY
Energy <strong>in</strong> Contract – Sugar Cane Based Power PlantsAverage MW200018001600140012001000800600Source: EPE397215728215547670215640 613 610215 215 21540064420215137 137137 137 137200 452311531116 105 166 176 211 211 21102008 2009 2010 2011 2012 2013 2014 2015New energy auctionRenewables auctionReserve energy auctionPro<strong>in</strong>fra (Government program fot renewables)Nom-regulated Non-regulated market (average MW) MW)720759 786 789BiomassenergyOPPORTUNITIES POTENTIAL ANDFOR OPPORTUNITIES CALIFORNIA GREEN IN BRAZILIAN COMPANIESRENEWABLE IN BRAZIL ENERGY
Bagasse Energy <strong>for</strong> the GridSource: EPEBiomassenergyOPPORTUNITIES POTENTIAL ANDFOR OPPORTUNITIES CALIFORNIA GREEN IN BRAZILIAN COMPANIESRENEWABLE IN BRAZIL ENERGY
Hydroelectricity is Complementary to Sugar & AlcoholProduction (<strong>in</strong> % of highest supply month)Source: : ONS and Unica. 2008 dataBiomassenergyOPPORTUNITIES POTENTIAL ANDFOR OPPORTUNITIES CALIFORNIA GREEN IN BRAZILIAN COMPANIESRENEWABLE IN BRAZIL ENERGY
Hydroelectric energy
Geographical Distribution of the <strong>Brazil</strong>ianHydroelectric PotentialNote : 50% of Itaipu <strong>in</strong>cluded <strong>in</strong> the South Region.Small hydro potential: 15 GW (5,7% of total potential)Source: Plano 2015; EletrobrásHydroelectricOPPORTUNITIES POTENTIAL ANDFOR OPPORTUNITIES CALIFORNIA GREEN IN BRAZILIAN COMPANIESRENEWABLE IN BRAZIL ENERGY
Hydro Resources Generation Potential (MW)River bas<strong>in</strong> Amazon Tocant<strong>in</strong>s/AraguaiaOthersTotalExploited potential 835 12,198 64,744 77,777Potential expansion until 2015 12,153 2,428 5,563 20,144Potential expansion 2015-2020 16,943 1,600 5,000 23,543Potential expansion 2020-2030 44,200 3,200 5,000 52,400Total 74,131 19,426 80,307 173,864Note1) Exploited potential <strong>in</strong>cludes plants <strong>in</strong> operation, under construction and commissioned2) Figures <strong>in</strong>dicate only 50% of b<strong>in</strong>ational power plants3) The generat<strong>in</strong>g potential of small hydro plants is not taken <strong>in</strong>to accountSource: PNE 2030 – Hydro generationHydroelectricOPPORTUNITIES POTENTIAL ANDFOR OPPORTUNITIES CALIFORNIA GREEN IN BRAZILIAN COMPANIESRENEWABLE IN BRAZIL ENERGY
Small Hydro Plant Potential (MW)NorthNortheastCentrewestSoutheastSouth<strong>Brazil</strong>Known potential 1 773 706 2,808 3,275 2,899 10,461Theoreticalpotential4,763 155 3,911 3,625 3,000 15,454Total 5,536 861 6,719 6,900 5,899 25,915Source: CERPCH(1) does not <strong>in</strong>clude plants <strong>in</strong> operationHydroelectricOPPORTUNITIES POTENTIAL ANDFOR OPPORTUNITIES CALIFORNIA GREEN IN BRAZILIAN COMPANIESRENEWABLE IN BRAZIL ENERGY
Ma<strong>in</strong> Entrances to the <strong>Brazil</strong>ian Energy Market•Investors enter the energy market as.tenders <strong>in</strong> energy auctions.stakeholders <strong>in</strong> equitiesequipment and services suppliersHydroelectricOPPORTUNITIES POTENTIAL ANDFOR OPPORTUNITIES CALIFORNIA GREEN IN BRAZILIAN COMPANIESRENEWABLE IN BRAZIL ENERGY
F<strong>in</strong>ance <strong>in</strong>dices of selected energy public corporationsCompany Code P/P Div.Yield P/EBIT EV/EBIT Mrg Ebit Curr. Liq ROELiq. AssetR$ billionElectricityELETROBRAS ELET3 7,67 4,96% 8,51 17,8 8,69% 1,49 4,01% 77,5CEMIG CMIG4 8,27 9,15% 4,52 6,57 32,78% 1,19 20,59% 13,1COPEL CPLE3 7,61 4,70% 4,94 5,02 22,91% 2,07 9,58% 11,8CESP CESP6 -118,25 2,21% 8,09 9,85 44,14% 0,69 -0,85% 10,4CPFL CPFE3 16,38 5,05% 7,74 10,61 23,92% 1,46 22,17% 6,7TRACTEBEL TBLE3 14,95 5,22% 9,08 10,25 52,03% 0,94 26,10% 5,3EDP ENBR3 9,92 5,88% 4,34 5,93 27,68% 1,19 13,61% 4,8TRANS. PAULISTA TRPL411,49 9,84% 6,46 7,99 49,02% 1,19 17,20% 4,6AES ELPL4 4,7 20,16% 2,76 3,47 21,36% 1,07 37,67% 3,5LIGHT S.A LIGT3 16,24 5,76% 5,91 8,94 15,30% 1,01 11,35% 3,3Sugar and AlcoholCOSAN CSAN3 0 1,79% 6,04 8,03 9,42% 2,02 0,00% 8,8<strong>US</strong>INA COSTAPINTOUCOP4Source: www.fundamentus.com.br6,06 0,57% -21,35 -22,94 5,75% 4,52 19,79% 1,0*data refer to the third quarter of 2011OPPORTUNITIES POTENTIAL ANDFOR OPPORTUNITIES CALIFORNIA GREEN IN BRAZILIAN COMPANIESRENEWABLE IN BRAZIL ENERGY
F<strong>in</strong>ance <strong>in</strong>dices of selected companies – electricity sectorNet receipt CapitalNet profit Net marg<strong>in</strong>AssetprofitabilityProfitCurrentliquidityEbitda(R$ million) (orig<strong>in</strong>) (R$ million) % % (R$ million) (R$ million)CPFLEnergia12,024 <strong>Brazil</strong> 1,560 13.0 23.1 2,739 0.88 3,431Coelce 2,850 Spa<strong>in</strong> 472 16.6 34.8 663 0.67 807CachoeiraDouradaItapebiEnergia373 Spa<strong>in</strong> 226 60.5 21.1 227 5.77 288288 <strong>Brazil</strong>/Spa<strong>in</strong>Source: Valor 1000, Valor Econômico, Edição 2011142 49.2 41.9 189 0.53 208Cemig 12,863 <strong>Brazil</strong> 2,258 17.6 19.7 3,719 1.26 4,614Ampla 3,155 Italy 216 6.8 13.6 462 0.7 634Brasil PCH 263 <strong>Brazil</strong> -3.2 -1.2 -2.4 163 1.3 210Enercan 380 <strong>Brazil</strong> 137 36.1 18.0 261 1.01 298Eletrobras 27,419 <strong>Brazil</strong> 2,553 9.3 3.6 4,833 1.79 6,426Neoenergia 8,950 <strong>Brazil</strong> 1,778 19.9 15.8 2,194 2,18 2,677OPPORTUNITIES POTENTIAL ANDFOR OPPORTUNITIES CALIFORNIA GREEN IN BRAZILIAN COMPANIESRENEWABLE IN BRAZIL ENERGY
Us<strong>in</strong>a BelaVistaF<strong>in</strong>ance <strong>in</strong>dices of selected companies – sugar & alcoholsectorNetNet AssetCurrentCapital Net profitProfitreceiptmarg<strong>in</strong> profitabilityliquidityEbitda(R$ million) (orig<strong>in</strong>) (R$ million) % % (R$ million) (R$ million)314 <strong>Brazil</strong> 39 12.3 24.4 53 3.02 90Copersucar8,433 <strong>Brazil</strong> 356 4.2 97.3 399 2.02 415L<strong>in</strong>colnJunqueiraGrupo Olhod’Agua1,338 <strong>Brazil</strong> 234 17.5 30.1 252 2.01 456308 <strong>Brazil</strong> 57 18.4 60.8 71 1.85 111Us<strong>in</strong>aNard<strong>in</strong>iUs<strong>in</strong>aSantaTerez<strong>in</strong>ha348 <strong>Brazil</strong> 54 15.5 22.0 65 1.08 1521,361 <strong>Brazil</strong> 279 20.5 21.9 303 1.11 674Cosan 18,064 <strong>Brazil</strong> 777 4.3 11.4 1,251 1.41 2,055427 <strong>Brazil</strong> 43 10.1 23.6 73 1.93 88Us<strong>in</strong>aBazanLDC-SEV 3,187 France 268 8.4 8.9 452 1.11 1,0881,186 <strong>Brazil</strong> 96 8.1 9.3 145 0.92 227EmpresasZilorSource: Valor 1000, Valor Econômico, Edição 2011OPPORTUNITIES POTENTIAL ANDFOR OPPORTUNITIES CALIFORNIA GREEN IN BRAZILIAN COMPANIESRENEWABLE IN BRAZIL ENERGY
Solar Photovoltaic Energy
Solar Energy•Potential: 170 W/m 2•First plant: Taua, with 1 MW <strong>in</strong>stalled capacity•Energy Development Program <strong>for</strong> States and Municipalities -Prodeem, from 1994 to 2002:Water pump<strong>in</strong>g, public light<strong>in</strong>g, electricity <strong>for</strong> isolatedcommunities, with 5 MWp <strong>in</strong>stalled capacitySolar EnergyOPPORTUNITIES POTENTIAL ANDFOR OPPORTUNITIES CALIFORNIA GREEN IN BRAZILIAN COMPANIESRENEWABLE IN BRAZIL ENERGY
Eletrosul Megawatt Solar Project•Photovoltaic Station with 1 MWp capacity•First large scale and grid connected BIPV plant <strong>in</strong> <strong>Brazil</strong>•Start<strong>in</strong>g po<strong>in</strong>t <strong>for</strong> BIPV technique <strong>in</strong> the Country and SouthAmerica•The Company strives to become a benchmark <strong>in</strong> the PV sector<strong>in</strong> <strong>Brazil</strong>Solar EnergyOPPORTUNITIES POTENTIAL ANDFOR OPPORTUNITIES CALIFORNIA GREEN IN BRAZILIAN COMPANIESRENEWABLE IN BRAZIL ENERGY
Support <strong>for</strong> the Megawatt Solar Project•KfW Bankengruppe – http://www.kfw.de/•Deutsche Gesellschaft für Internationale Zusammenarbeit –GIZ –http://www.giz.de•Bundesm<strong>in</strong>isterium für Umwelt, Naturschutz undReaktorsicherheit – http://www.bmu.de•Universidade Federal de Santa Catar<strong>in</strong>a – UFSC http://ufsc.br/•Instituto para o Desenvolvimento de Energias Alternativas naAmerica Lat<strong>in</strong>a – Ideal http://www.<strong>in</strong>stitutoideal.org•www.eletrosul.gov.br•megawatt.solar@eletrosul.gov.brOPPORTUNITIES POTENTIAL ANDFOR OPPORTUNITIES CALIFORNIA GREEN IN BRAZILIAN COMPANIESRENEWABLE IN BRAZIL ENERGY
ProjectCapacityCost(1,000 R$/kW)*I - Stations(A) Under constructionEletrosul Megawatt Solar Project 1 MWTaua Solar Plant, Ceará 1 MW 10CEMIG — Sete Lagoas Pilot Project 3 MW 8(B) Ga<strong>in</strong><strong>in</strong>g <strong>for</strong>mal approvalTaua Solar Plant, Ceará 4 MW 9**Solar projects pipel<strong>in</strong>eStations total (A + B)II - Solar stadiums (ga<strong>in</strong><strong>in</strong>g <strong>for</strong>mal approval)9 MWM<strong>in</strong>eirão (CEMIG/MG) 1.4 MW 7.2Maracanã (Light/RJ) 3.2 MW 7.2Pituaçu (Salvador/BA)* 446 kWp R$ 3,8 million (total cost)Subtotal5 MWIII - Stations and stadiums subtotal (I + II) 14 MWIV – Solar stadiums (estimat<strong>in</strong>g time & cost)Mané Garr<strong>in</strong>cha (Brasília) 2.4 MW 7.2Verdão (Cuiabá) 1.9 MW 7.2Joaquim Américo Guimarães (Curitiba) 1.7 MW 7.2Castelão (Fortaleza) 1.7 MW 7.2Vivaldo Lima (Manaus) 3.3 MW 7.2Arena das Dunas (Natal) NdBeira Rio (Porto Alegre) 3.6 MW 7.2Arena Cidade da Copa (Recife) NdFonte Nova (Salvador) 3.2 MW 7.2Morumbi (SP) 2.4 MW 7.2Subtotal 20.2 MWPOTENTIAL AND OPPORTUNITIES IN BRAZILIAN RENEWABLE ENERGYTotal (III + IV)34.2 MW*Cost estimate basedon multi crystall<strong>in</strong>esilicon solar cells,except <strong>for</strong> Pituaçu(th<strong>in</strong> film)** Cost estimate <strong>for</strong>plant expansionSource: A Carta doSol, Relatório Técnico,UFRJ
Solar PV Cost ProjectionsSource: Renewable Energy Technology Cost Review, Melbourne Energy Institute.OPPORTUNITIES POTENTIAL ANDFOR OPPORTUNITIES CALIFORNIA GREEN IN BRAZILIAN COMPANIESRENEWABLE IN BRAZIL ENERGY
Cost Improvement <strong>in</strong> PV TechnologySource: Solar Photovoltaics: expand<strong>in</strong>g electric generation options, Electric Power Research Institute - EPRIOPPORTUNITIES POTENTIAL ANDFOR OPPORTUNITIES CALIFORNIA GREEN IN BRAZILIAN COMPANIESRENEWABLE IN BRAZIL ENERGY
Solar RadiationSource: CEPEL - Atlas Solarimétrico do BrasilSolar EnergyOPPORTUNITIES POTENTIAL ANDFOR OPPORTUNITIES CALIFORNIA GREEN IN BRAZILIAN COMPANIESRENEWABLE IN BRAZIL ENERGY
Sea wave energy
Annual Wave Power Averages Worldwide (kW/m wavefront)Source: World Wave Atlas.OPPORTUNITIES POTENTIAL ANDFOR OPPORTUNITIES CALIFORNIA GREEN IN BRAZILIAN COMPANIESRENEWABLE IN BRAZIL ENERGY
Sea Wave Energy•Onshore potential: 90 GW (average 12 kW/m wave crestpeaks and 7,367 km coastl<strong>in</strong>e extension)•Near shore potential: 40 GW•Offshore potential: 240 GW (estimate based on U.S. data)•Good news: sea energy is complementary to hydroelectricity•University (UFRJ) project with small-scale model of 100 kWSea waveOPPORTUNITIES POTENTIAL ANDFOR OPPORTUNITIES CALIFORNIA GREEN IN BRAZILIAN COMPANIESRENEWABLE IN BRAZIL ENERGY
Grubb Curve <strong>for</strong> Renewable Energy TechnologiesSource: Electric Power Research Institute - EPRI.OPPORTUNITIES POTENTIAL ANDFOR OPPORTUNITIES CALIFORNIA GREEN IN BRAZILIAN COMPANIESRENEWABLE IN BRAZIL ENERGY
Foreign <strong>Companies</strong> <strong>in</strong> the <strong>Brazil</strong>ian Energy Sector (rankedby liquid receipt)CompanySectorTotal asset(Million R$)Foreign <strong>in</strong>vestorBrasiliana de Energia Electricity 18,215 AES <strong>US</strong>Tereos InternationalSugar &AlcoholCountry8,366 Tereos FranceEDP Energias do Brasil Electricity 12,810 EDP PortugalTractebel Energia Electricity 12,850 Tractebel & GDF Suez BelgiumComgas Oil and Gas 3,848 BG Group & ShellSource: Valor Econômico – Edição Especial 2011UK andNetherlandElektro Electricity 3,242 Iberdrola Spa<strong>in</strong>LDC-SEVSugar &Alcohol9,155Louis DreyfusCommoditiesFranceAmpla Electricity 4,314 Enel ItalySHV Gas Brasil Oil and Gas 1,128 SHV Gas NetherlandCoelce Electricity 3,076 Enel ItalyPetroleo Sabba Oil and Gas 341 SHV GasUK andNetherlandCEG Oil and Gas 2,013 Gas Natual Fenosa Spa<strong>in</strong>OPPORTUNITIES POTENTIAL ANDFOR OPPORTUNITIES CALIFORNIA GREEN IN BRAZILIAN COMPANIESRENEWABLE IN BRAZIL ENERGY
CompanyForeign <strong>Companies</strong> <strong>in</strong> the <strong>Brazil</strong>ian Energy Sector(ranked by liquid receipt)SectorTotal asset(Million R$)Foreign <strong>in</strong>vestorCountryTransmissão Paulista Electricity 6,931 ISA ColombiaAES Sul Electricity 2,430 AES <strong>US</strong>CEG Rio Oil and Gas 486 Gas Natural Fenosa Spa<strong>in</strong>Duke Energy-ParanapanemaElectricity 4,876 Duke Energy <strong>US</strong>UTE Norte Flum<strong>in</strong>ense Electricity 1,641 EDF FranceEndesa Fortaleza Electricity 830 Enel ItalyRepsol S<strong>in</strong>opec Brasil Oil and Gas 14,420 Repsol Spa<strong>in</strong>Gas Natural SPS Oil and Gas 768 Gas Natural Fenosa Spa<strong>in</strong>Sugar andUK/Inf<strong>in</strong>ity Bio-energy1,014 Inf<strong>in</strong>ity Bio-energyAlcoholBermudasCachoeira Dourada Electricity 1,241 Enel ItalyBrookfield EnergiaBrookfield AssetElectricity 3,712CanadaRenovávelManagementCien Electricity 1,315 Enel ItalyItapebi Energia Electricity 637 Iberdrola Spa<strong>in</strong>Source: Valor Econômico – Edição Especial 2011OPPORTUNITIES POTENTIAL ANDFOR OPPORTUNITIES CALIFORNIA GREEN IN BRAZILIAN COMPANIESRENEWABLE IN BRAZIL ENERGY
Foreign <strong>Companies</strong> <strong>in</strong> the <strong>Brazil</strong>ian Transmission NetworkSource: ANEEL<strong>Companies</strong>Total lenght of l<strong>in</strong>es Annual receipt(km)(Million R$)Elecnor 2,991 195Isolux 2,288 234Abengoa 2,224 269Abengoa et al. 1,474 67Enel et al. 1,050 128Cymi 1,036 65Cobra 957 111Cymi et al. 604 72Abengoa, Inabensa,Cobra, Elecnor & Isolux575 52Asa Investment 389 47Inabensa 386 47Inabensa, Cobra,Elecnor, Isolux212 73Elecnor, Isolux 181 28InterconexionesElectricas172 11Zhejang InsigmaEng<strong>in</strong>eer<strong>in</strong>g et al.102 20OPPORTUNITIES POTENTIAL ANDFOR OPPORTUNITIES CALIFORNIA GREEN IN BRAZILIAN COMPANIESRENEWABLE IN BRAZIL ENERGY
The Road AheadPer capita electricity consumption versus per capita <strong>in</strong>comeSource: PDE 2020, EPEOPPORTUNITIES POTENTIAL ANDFOR OPPORTUNITIES CALIFORNIA GREEN IN BRAZILIAN COMPANIESRENEWABLE IN BRAZIL ENERGY
Why Invest <strong>in</strong> the <strong>Brazil</strong>ian Energy Market ?•Vast energy potential•Renewables shar<strong>in</strong>g 45% of energy matrix•Consumption average annual growth of 5,3%•6,000 MW of new generat<strong>in</strong>g capacity per year until 2020•Large experience <strong>in</strong> eng<strong>in</strong>eer<strong>in</strong>g, construction and operationof power systemsOPPORTUNITIES POTENTIAL ANDFOR OPPORTUNITIES CALIFORNIA GREEN IN BRAZILIAN COMPANIESRENEWABLE IN BRAZIL ENERGY
Why Invest <strong>in</strong> the <strong>Brazil</strong>ian Energy Market ?•Major producer of sugar cane, alongside with India•Has the largest <strong>for</strong>estry <strong>in</strong>dustry <strong>in</strong> Lat<strong>in</strong> America•One of the major producers of biofuels•Largest exporter and second largest producer of ethanol•Large areas available <strong>for</strong> agricultural expansion•Fourth largest portfolio of chartered oil tankersOPPORTUNITIES POTENTIAL ANDFOR OPPORTUNITIES CALIFORNIA GREEN IN BRAZILIAN COMPANIESRENEWABLE IN BRAZIL ENERGY
How to Enter the Regulated Electricity Market <strong>in</strong> <strong>Brazil</strong> ?•Establish a Specific Purpose Company, with representative<strong>in</strong> <strong>Brazil</strong>•Know legal and regulatory rules <strong>for</strong> commission andexploitation of generat<strong>in</strong>g sources•Agree with the energy auctions’ conditions, published by theRegulatory Agency – Aneel . See: www.aneel.gov.br•Enrol <strong>for</strong> technical qualification with the GovernmentPlann<strong>in</strong>g Company – Empresa de Pesquisa Energética – EPE.See: www.epe.gov.br•Onl<strong>in</strong>e enrolment <strong>for</strong> energy auctions <strong>in</strong> Aneel web siteOPPORTUNITIES POTENTIAL ANDFOR OPPORTUNITIES CALIFORNIA GREEN IN BRAZILIAN COMPANIESRENEWABLE IN BRAZIL ENERGY
How to Enter the Regulated Electricity Market <strong>in</strong> <strong>Brazil</strong> ?•The 2011 energy auctions required w<strong>in</strong>d energy <strong>in</strong>vestors tocomply with:I – aerogenerators to be <strong>in</strong>stalled are newII – If imported, aerogenerators are at least 1,500 kWplate capacity•Per<strong>for</strong>mance bond deposit (5% of total <strong>in</strong>vestment)OPPORTUNITIES POTENTIAL ANDFOR OPPORTUNITIES CALIFORNIA GREEN IN BRAZILIAN COMPANIESRENEWABLE IN BRAZIL ENERGY
Thank you!Carlos Senna FigueiredoConfederação Nacional da IndustriaPhone55 61 3317 9475csenna@cni.org.brOPPORTUNITIES POTENTIAL ANDFOR OPPORTUNITIES CALIFORNIA GREEN IN BRAZILIAN COMPANIESRENEWABLE IN BRAZIL ENERGY
AnnexEnergy auctionsPOTENTIAL AND OPPORTUNITIES IN BRAZILIAN RENEWABLE ENERGY
2009 “A–3” Energy Auction (3 years be<strong>for</strong>e supply).Power plantCapacity (MW)Energy price(R$/MWh)Rio Bonito small hydro plant 1 144Codora thermal plant(biomass)10 144.6Source: ANEELOPPORTUNITIES POTENTIAL ANDFOR OPPORTUNITIES CALIFORNIA GREEN IN BRAZILIAN COMPANIESRENEWABLE IN BRAZIL ENERGY
2009 Reserve Energy Auction – W<strong>in</strong>d energyStatePower plantsCapacity (MW)Quantity % Quantity %Bahia 18 25.4 390 21.6Ceará 21 29.6 542.7 30.1Rio Grande doNorteRio Grande doSul23 32.4 657 36.48 11.3 186 10.3Sergipe 1 1.4 30 1.7Total <strong>Brazil</strong> 71 100 1,805.7 100.Source: ANEELOPPORTUNITIES POTENTIAL ANDFOR OPPORTUNITIES CALIFORNIA GREEN IN BRAZILIAN COMPANIESRENEWABLE IN BRAZIL ENERGY
2010 Energy Auction <strong>in</strong> Isolated Systems.Power PlantFuelEnergy price(R$/MWh)Energy (MWh)Value <strong>in</strong>1,000R$Santana doAraguai ISantana doAraguai IBrasil Bio Fuelswood pellets andwastewood pellets andwastewood pellets andwaste149 15,648 2,331.6148,5 600,148 89,121.9149 458,048 68,249.2Source: ANEELOPPORTUNITIES POTENTIAL ANDFOR OPPORTUNITIES CALIFORNIA GREEN IN BRAZILIAN COMPANIESRENEWABLE IN BRAZIL ENERGY
Belo Monte Hydro Plant Auction, april 2010Installed capacity: 11,000 MWInvestment: R$ 20.3 billionF<strong>in</strong>anc<strong>in</strong>g: 80% of total <strong>in</strong>vestment f<strong>in</strong>anced by BndesContract: 30 yearsW<strong>in</strong>ner: Consórcio Norte Energia – Nesa (<strong>Brazil</strong>ian privatecompanies and Eletrobras with 49,9%)Energy price : R$ 77.97/MWh70% of generation <strong>for</strong> the regulated market30% of generation <strong>for</strong> the non-regulated market and freeconsumersSource: ANEELOPPORTUNITIES POTENTIAL ANDFOR OPPORTUNITIES CALIFORNIA GREEN IN BRAZILIAN COMPANIESRENEWABLE IN BRAZIL ENERGY
July 2010 “A–5” Energy AuctionPower plant W<strong>in</strong>ner RiverCapacity(MW)Energy(averageMW)Energyprice(R$/MWh).Garibaldi (SC) TPI Canoas 177.9 58 107.98Colíder (MT) Copel Teles Pires 300 125 103.40Ferreira Gomes (AP) Alupar Araguari 252 105 69.78Pirapora (SP) Emae Tietê 25 16 154.49Canaã (RO) Mega Energia Canaã 17 7 153.98Jamari (RO) Mega Energia Jamari 20 9 154.23Santa Cruz deMonte Negro (RO)Mega Energia Jamari 17 7 153.73Total 327 99.48Source: ANEELOPPORTUNITIES POTENTIAL ANDFOR OPPORTUNITIES CALIFORNIA GREEN IN BRAZILIAN COMPANIESRENEWABLE IN BRAZIL ENERGY
December 2010 “A – 5” Energy Auction.Power Plants W<strong>in</strong>ner River/StateTeles PiresS. Antõniodo JariConsórcio TelesPires EnergiaEficienteConsórcioAmapá EnergiaInstalledcapacityEnergy(average MW)EnergyPrice(R$/MWh)Teles Pires / MT 1820 778 58.35Jari / AP 300 190 1042,120 968 Total 67.31Source: ANEELOPPORTUNITIES POTENTIAL ANDFOR OPPORTUNITIES CALIFORNIA GREEN IN BRAZILIAN COMPANIESRENEWABLE IN BRAZIL ENERGY
2010 Renewables and Reserve Energy Auction.SourcePowerPlantsCapacity(MW)Energy(average MW)Average energyprice (R$/MWh)W<strong>in</strong>d energy 70 2,047.8 899 130.86Biomass 12 712.9 190.6 144.2Small hydro (1 to 30MW)7 131.5 69.8 141.93Total 89 2,892.2 1,159.4 133.56Source: ANEELOPPORTUNITIES POTENTIAL ANDFOR OPPORTUNITIES CALIFORNIA GREEN IN BRAZILIAN COMPANIESRENEWABLE IN BRAZIL ENERGY
2011 “A -3” Energy Auction.SourceProjectsInstalledcapacity (MW)Average MWAverage energyprice (R$/MWh)W<strong>in</strong>d energy 44 1,067,7 484.2 99.58Biomass 4 197,8 91.7 102.41Hydro 1 450 209.3 102Natural Gas 2 1,029.1 900.9 103.26Total 51 2,744.6 1,686.1 102.07Source: ANEELOPPORTUNITIES POTENTIAL ANDFOR OPPORTUNITIES CALIFORNIA GREEN IN BRAZILIAN COMPANIESRENEWABLE IN BRAZIL ENERGY
2011 Reserve Energy Auction.SourceProjectsInstalledcapacity (MW)Average MWAverageenergy price(R$/MWh)W<strong>in</strong>d 34 861.1 428.8 99.54Biomass 7 357.0 169.5 100.40Total 41 1,218.1 589.3 99.61Source: ANEELOPPORTUNITIES POTENTIAL ANDFOR OPPORTUNITIES CALIFORNIA GREEN IN BRAZILIAN COMPANIESRENEWABLE IN BRAZIL ENERGY
2011 “A – 5” Energy Auction.SourceProjectsInstalledcapacity (MW)AverageMWAverage energyprice (R$/MWh)W<strong>in</strong>d 39 976.5 478.5 105.12Biomass 2 100 43.1 103.06Hydro São Roque 135 90.9 91.2Total 42 1,211.50 612.5 102.18Source: ANEELOPPORTUNITIES POTENTIAL ANDFOR OPPORTUNITIES CALIFORNIA GREEN IN BRAZILIAN COMPANIESRENEWABLE IN BRAZIL ENERGY
2012 “A – 3” Energy AuctionEnrolled projects by source(Auction to be held next march)Source Projects Capacity (MW)W<strong>in</strong>d 524 13,180Natural gas 26 10,344Biomass 23 1,042Small hydro 22 343Hydro 3 941Total 598 25,850Source: ANEELOPPORTUNITIES POTENTIAL ANDFOR OPPORTUNITIES CALIFORNIA GREEN IN BRAZILIAN COMPANIESRENEWABLE IN BRAZIL ENERGY